
Today we are taking our weekly look at the charts for gold and silver.
Corvid 19, the US Election and US Financial Stimulus talks have given gold plenty to digest over the last week. On a short term basis gold has been taking a lot of signal from the fortunes of the stock markets and increased hopes of agreement of a financial stimulus package gave a boost to both stock markets and the gold price. Gold ran in to significant resistance and failed to close above the short term resistance level around $1,930 and close to the 50 day moving average as can been seen from the chart below.
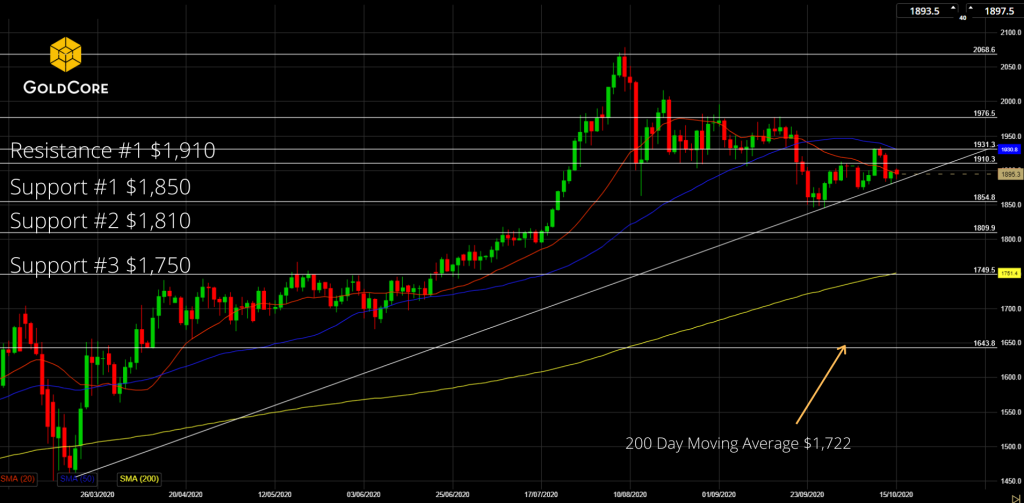
GoldCore Gold Chart
The subsequent news of the failure in stimulus negotiations weighed then on both markets with gold finding support at the long term trend line.
With so many major market moving event unfolding in October, this could be a very interesting couple of weeks for gold. A negative news cycle could see a retest of $1,850 to the downside with a close below this brings the $1,810 support level in to play. Below this $1,750 should prove to be a major support level.
However, a major “flight to safety” would be very bullish for gold and a close above resistance at $1,910 opens up $1,930 as the next target. Above this $1,975 is the next target and any close above this opens up the potential for re-testing the psychological $2,000 and a re-test of the recent all-time highs at $2,078.
Silver has taken a lot of signal for gold and while more volatile. The news cycle effecting gold has resulted in a number of false breakouts for silver that caught a number of technical traders by surprise. We have seen a breach of the long established trend support line that never turned in to a further move to the downside and a break to the topside as traders tried to digest and second guess the stimulus package news.
Today silver is looking a bit heavy and another close below trend support opens up the recent support level of $23/22.80 as a target and below this we are light in terms of major support for silver most notably at $19.50 which also happens to be at the 200 day moving average.
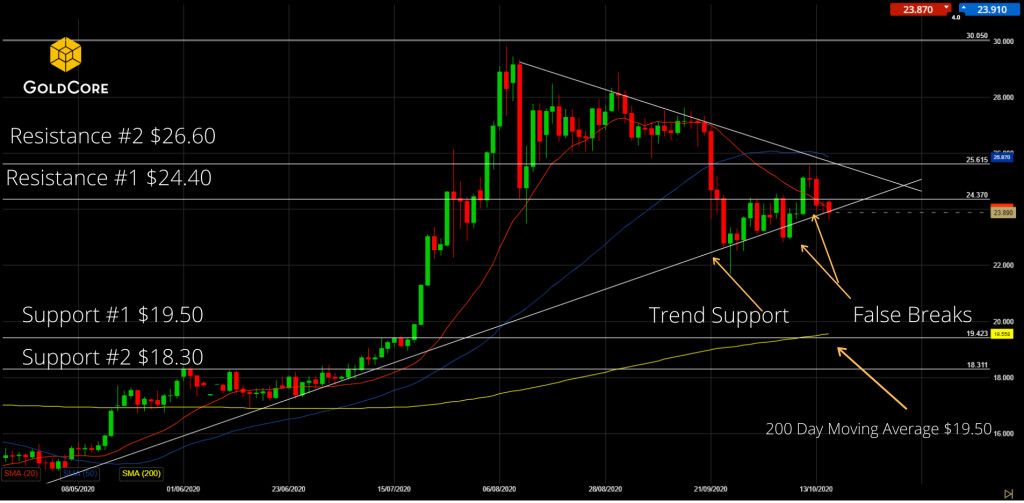
GoldCore Silver Chart
A close above $24.40 presents an opportunity to test resistance at $25.15 and $26.60 beyond that.
Silver seems to be working it’s way in to a bit of a triangle which suggests that the bulls and bears in the market are fairly balanced and waiting for the next major news cycle that will influence the next major move for silver.
On balance short term we could see some weakness in the silver price which could be very healthy as it forms a base for its next major move higher to retest the recent highs and open up the opportunity for a test of the psychological $30.00 level.
Access Latest Goldnomics Podcast (Part II) HereGOLD PRICES (USD, GBP & EUR – AM/ PM LBMA Fix)
14-Oct-20 1896.45 1910.05 1466.15 1464.63 1616.91 1624.12
13-Oct-20 1920.80 1891.30 1471.33 1457.06 1629.03 1608.74
12-Oct-20 1891.35 1887.45 1460.12 1460.70 1608.03 1607.73
09-Oct-20 1912.40 1923.25 1478.48 1482.63 1620.76 1628.99
08-Oct-20 1891.35 1887.45 1460.12 1460.70 1608.03 1607.73
07-Oct-20 1888.00 1884.50 1464.33 1463.69 1605.56 1601.83
06-Oct-20 1912.50 1913.40 1472.82 1476.00 1623.33 1623.90
05-Oct-20 1899.65 1909.60 1467.48 1472.49 1616.41 1620.49
02-Oct-20 1906.40 1903.05 1473.46 1471.82 1627.87 1624.44
01-Oct-20 1895.55 1902.00 1477.01 1476.33 1615.96 1619.74
30-Sep-20 1883.40 1886.90 1468.49 1467.63 1609.74 1613.30
29-Sep-20 1882.40 1883.95 1461.87 1465.71 1610.02 1606.44
28-Sep-20 1850.95 1864.30 1440.78 1448.37 1589.41 1597.52
25-Sep-20 1870.05 1859.70 1467.05 1462.65 1605.25 1598.78
Buy gold coins and bars and store them in the safest vaults in Zurich, Switzerland with GoldCore.
About the author
