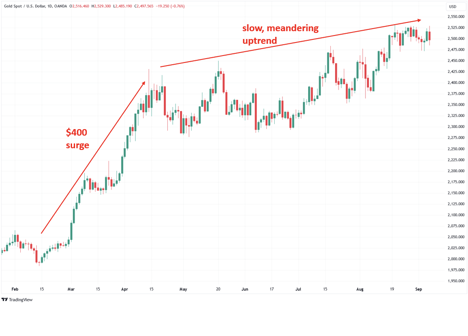
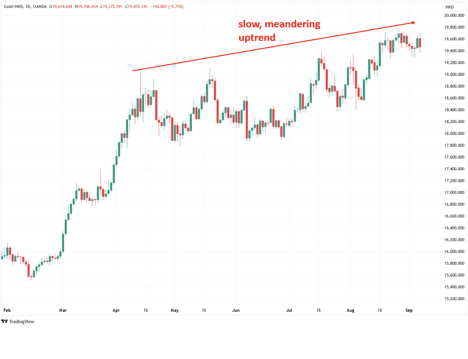
After its impressive $400 surge in March and April, gold has settled into a slow, meandering uptrend. While precious metals investors welcome any price gains, many commentators have expressed frustration and confusion over the summer's inconsistent rally, which feels like two steps forward, and one step back. In this piece, I’ll reveal the little-known reason behind gold's seemingly lackluster rally and why it should actually be seen as a cause for optimism.
Here’s the chart of gold priced in U.S. dollars since its bull market started earlier this year:
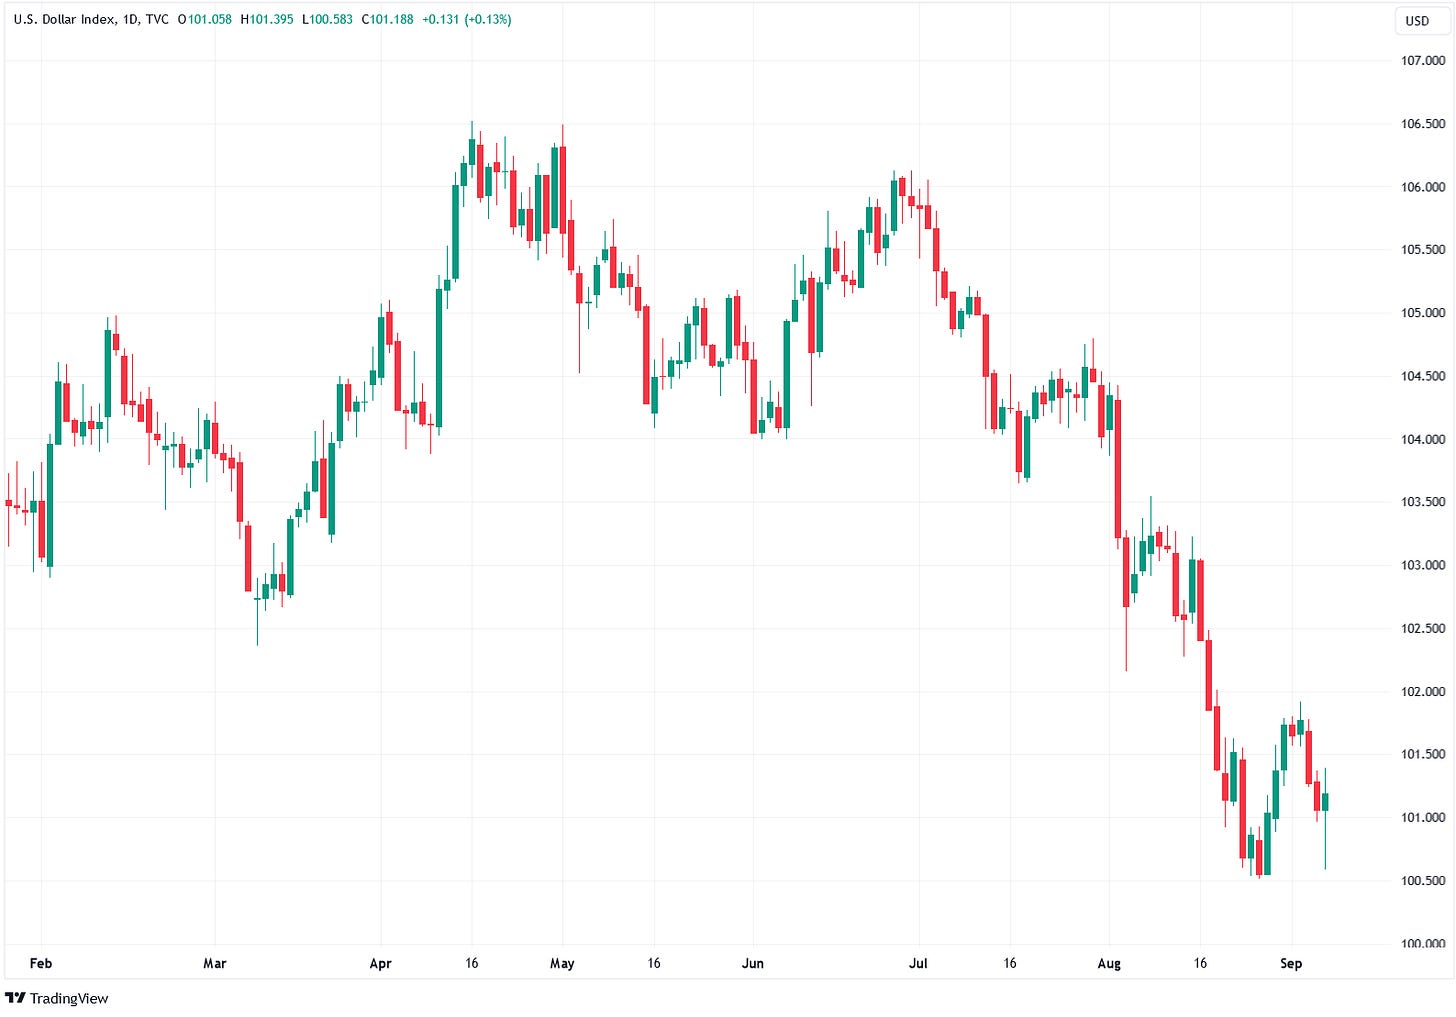
A key but little-known factor behind gold's tepid summer uptrend is that it has been driven almost entirely by weakness in the U.S. dollar rather than by gold's own strength. Gold and the U.S. dollar typically move inversely, meaning dollar strength weakens gold and vice versa. (When I discuss dollar weakness or strength in this instance, I’m referring to its exchange rate against other fiat currencies. Of course, the dollar is losing purchasing power as a function of time.)
Since late April, the U.S. Dollar Index has been in a significant downtrend:
 Despite the rising price of gold in U.S. dollars, the yellow metal has gone virtually nowhere since April when priced in currencies other than the dollar. It hasn’t been firing on all cylinders, basically. My theory is that gold needs to break out in all major currencies in order to signal that the next leg of the bull market has truly begun. Once that occurs, the lukewarm summer uptrend will morph into another surge similar to the one that occurred in March and April. Let’s take a look at gold priced in major currencies so that you can see what I’m saying.
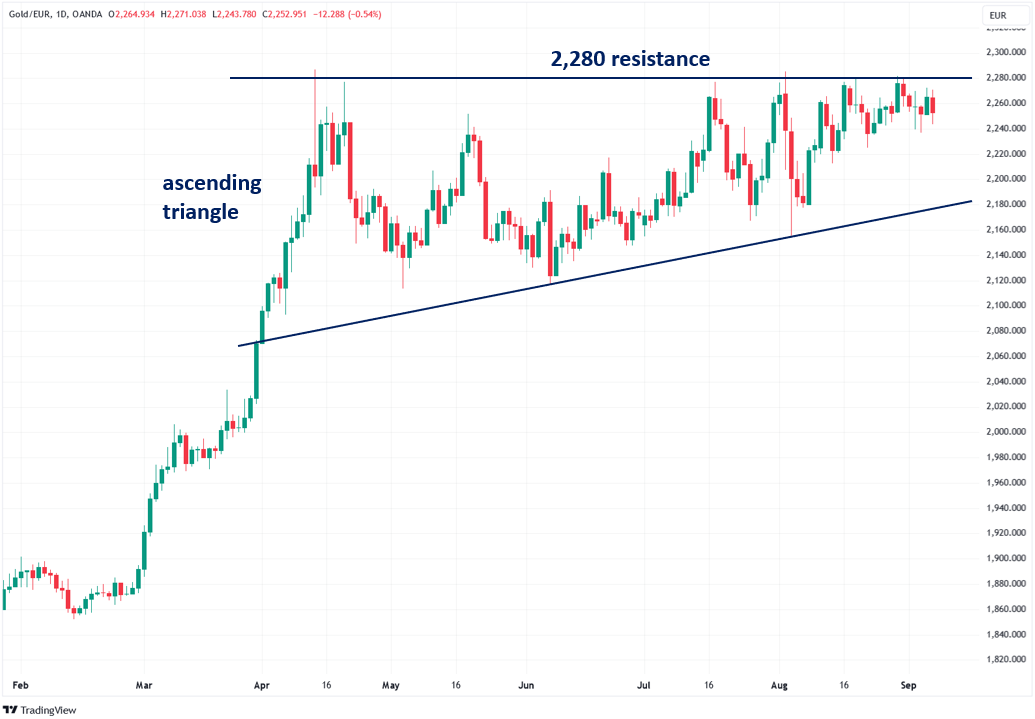
Gold priced in euros has been trading in a narrowing range for the past five months. This trading range appears to be a bullish technical pattern known as an “ascending triangle.” A convincing close above the 2,280 resistance level is necessary to confirm a breakout.
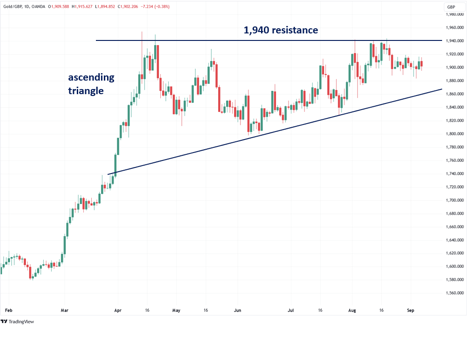
 Gold priced in British pounds is also forming an ascending triangle with key resistance at 1,940:
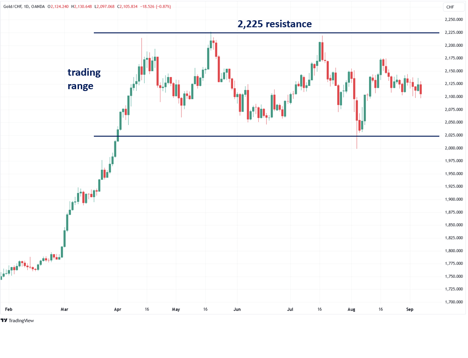
Gold priced in Swiss franc is forming a clear trading range with a key resistance at 2,225. This chart is worth paying close attention to because Switzerland is a very important center for the international gold industry with its numerous mints, refiners, and extensive gold trading and banking sector. A close above the 2,225 resistance should have a significant psychological impact on the Swiss gold industry.
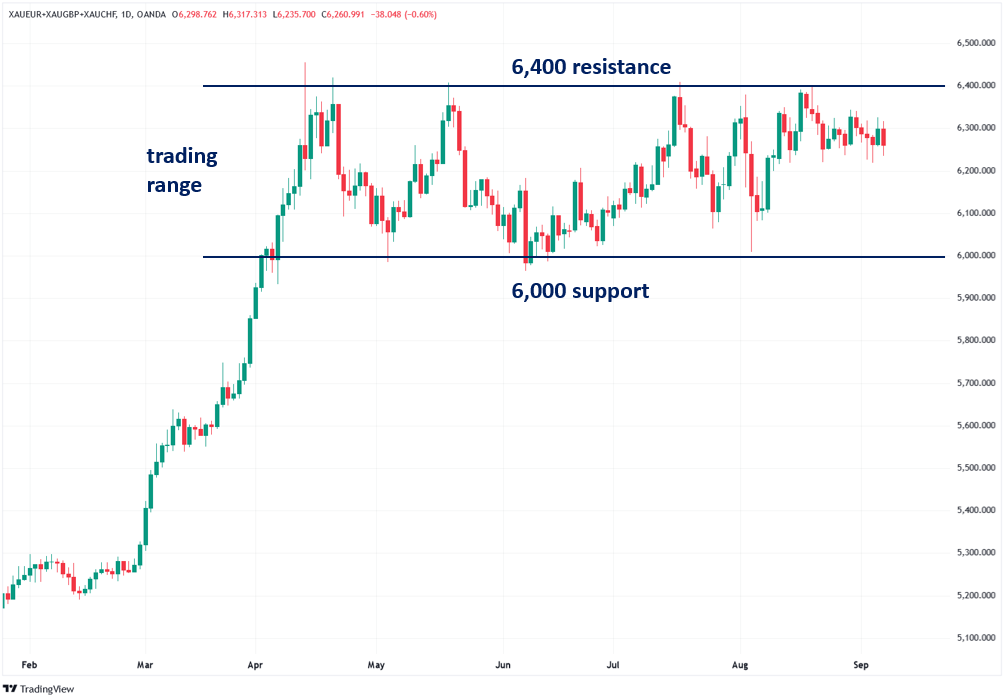
The chart below shows gold prices in euros, British pounds, and Swiss francs. I find that this particular mix shows gold's movements very clearly. Notice how gold has been trading in a well-defined 400-point range over the summer. I recently used this chart to project that gold will hit $3,000 fairly quickly after it breaks out.
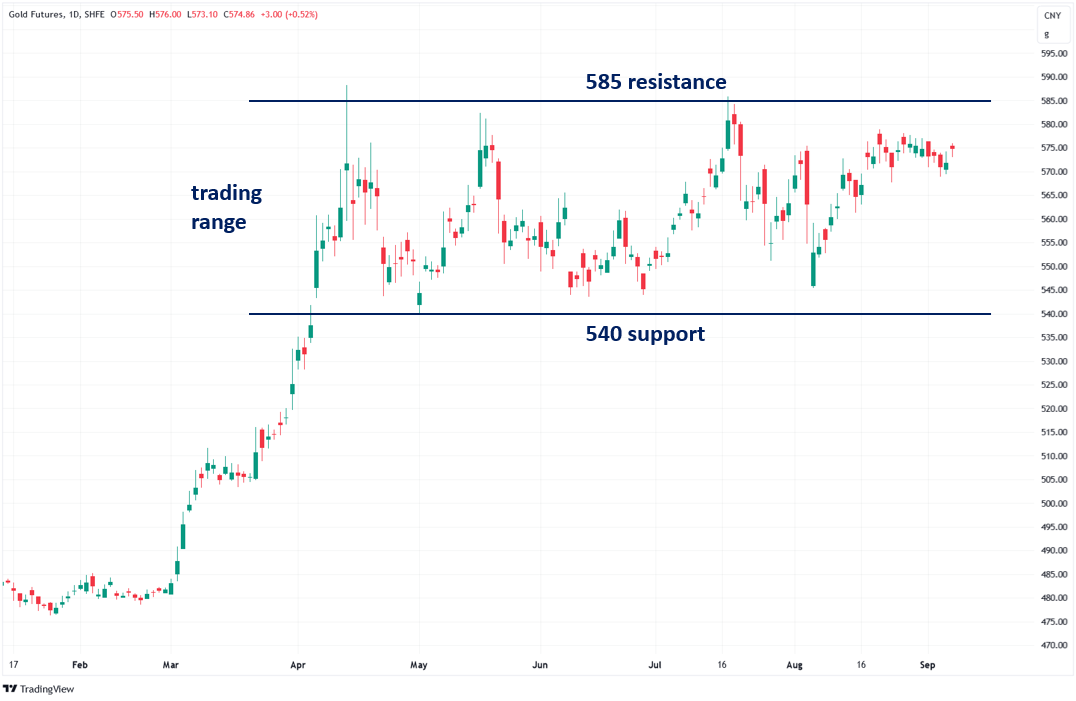
 The chart below displays Shanghai Futures Exchange gold futures, which were the primary vehicle behind the China-centric gold frenzy in March and April. Notice how prices have been oscillating within a well-defined trading range. As I explained in another piece, my theory is that a convincing break above the 585 resistance level will kick off another surge of Chinese gold buying as trend-following buy programs kick in, human traders get FOMO, and the rest of the world piles on as well. Watch this chart very closely.
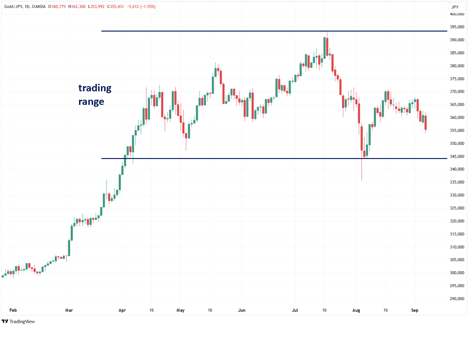
 Gold priced in Japanese yen has been trading in a wide range, mostly due to wild swings in the yen:
Gold priced in Hong Kong dollars has been in a slow uptrend, similar to gold priced in U.S. dollars—a byproduct of the Hong Kong dollar’s peg to the U.S. dollar:
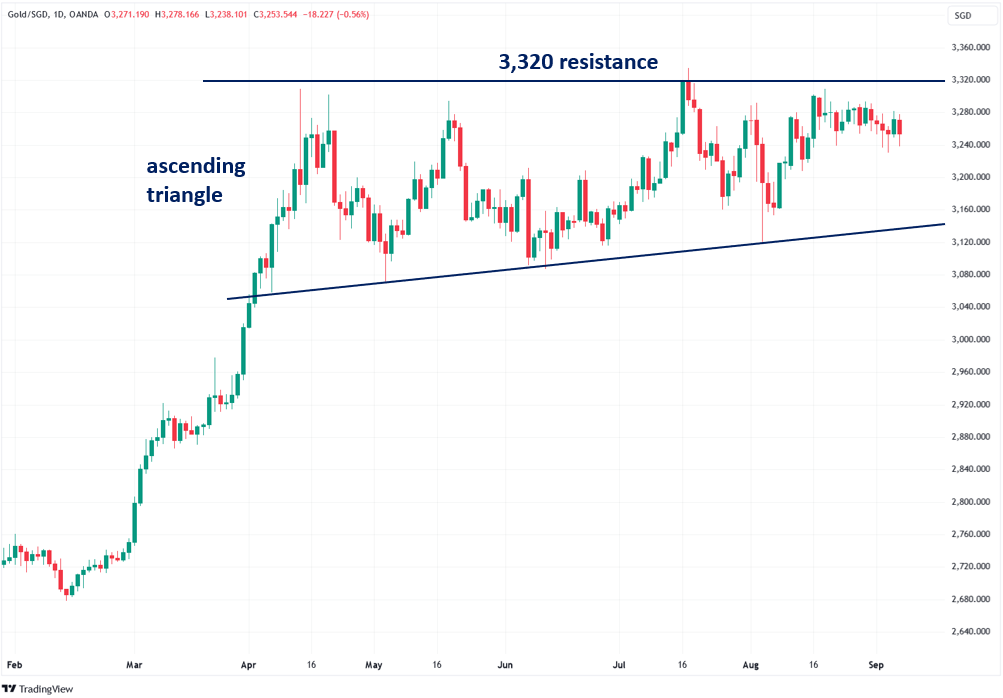
Gold priced in Singapore dollars is forming an ascending triangle with a key resistance at 3,320. This is important to watch because Singapore is a regional gold trading hub and is expected to become even more influential in the gold arena in the years ahead. Similar to Switzerland, a close above the 3,320 resistance should have a significant psychological impact on Singapore’s gold industry.
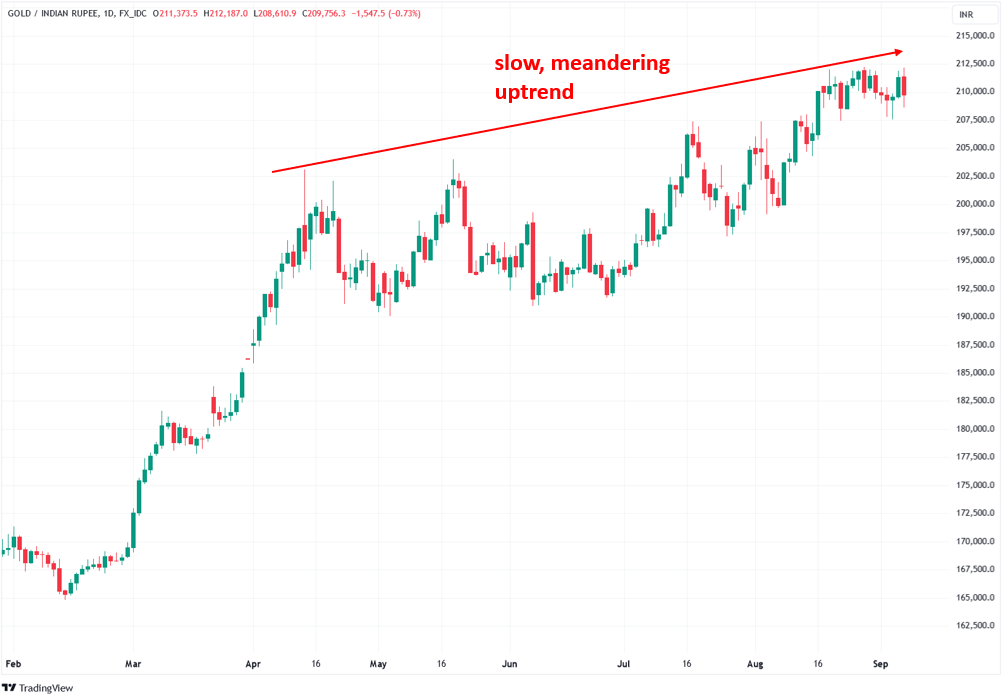
 Gold priced in Indian rupees has been in a slow uptrend that has largely been due to the weakening rupee rather than gold’s strength:
 Please keep in mind that this thesis needs to be confirmed by high-volume breakouts in all major currencies; without that, all bets are off. In addition, it is important to be aware that gold may experience a brief pullback before it finally breaks out.
In conclusion, while gold’s recent rally may seem lackluster, driven more by U.S. dollar weakness than by gold’s intrinsic strength, this is actually a reason for optimism. Gold has yet to break out in major currencies beyond the dollar, and once it does, it will signal the start of the next major leg of the bull market. When gold begins to gain momentum across all currencies, I believe that the slow, uneven uptrend of the summer will transform into a powerful surge, much like the explosive rally we witnessed in March and April.
About the author