Image: Chesapeake Gold Share Price, Market Cap, and Outstanding Share Count Overlays
Over the years as an advisor and investor, I’ve spoken to hundreds of mainly natural resource investors. A topic I’ve always found difficult to explain, which is vitally important to understanding a stock, is the difference between ‘share price’ and ‘market capitalization’ (also known as ‘market cap’).
In this article, we’ll discuss why these two items are important and different from each other, and explore how knowing the difference will allow one to determine the true ‘price paid’ for a stock (or business). Knowing the true price of a business will provide one with a competitive edge, which is particularly important when investing in natural resource shares.
Countless times we’ve been part of investment discussions, where the question of buying a stock comes up. Invariably, the question “How much did you pay?” is asked. Ten out of ten investors will tell you, “I paid $100 per share for Apple (or Barrick Gold)”.
If we then ask, “How much did you pay for the business”? Ninety-nine out of one hundred investors will repeat themselves, and say, “I paid $100 per share.” The odd man out, or the 100th investor would instead say, “I paid $100 per share, at a market capitalization of $100 billion”. In other words, this rare fellow understands that while he paid $100 per share, he actually paid $100 billion, notionally, for the business itself.
How does this compute?
The share price represents the price of a single fractional share of a business. If we wanted to purchase the entire business, we would need to purchase every share issued by the company. If the company has issued 100 million shares (referred to as ‘shares outstanding’) – we would need to purchase all 100 million, in order to purchase the business in its entirety.
How do we calculate how much money is needed to purchase an entire business?
This is where market capitalization comes into play. Market cap is simply the total number of shares issued, multiplied by the share price.
To use our earlier example – if we bought Apple stock at $100 per share, and if (hypothetically speaking) there were 100 million shares outstanding – that would imply a market cap of $10 billion. Therefore, $10 billion would be needed to ‘notionally’ purchase the entire company.
In reality, there are other moving parts involved in purchasing an entire company, but this is a simplified explanation of ‘market cap’.
The best place to find the outstanding share count of a company is the most recent quarterly or annual report. This report can usually be found on the investor relations page of the company’s website, or through the stock exchange or regulatory filing website for the country in question.
When investing in natural resource shares, one must pay extra close attention to market capitalization and outstanding share count. The reason is that the outstanding share count can change rapidly over time, and in most cases, the number only grows in size.
In the natural resource and mining sector, there are four asset categories: 1. Major producers, 2. Junior producers, 3. Development stage companies, and 4. Exploration stage companies.
Most companies in the bottom three asset categories are ‘negative cash flowing.’ Meaning, they lose money from year to year just staying in business. “How can a company remain in business if it loses money?” you might ask.
Well, the approach taken for most natural resource companies is to issue more stock (shares) and sell it to investors privately in the form of a private placement, or ‘equity offering’.
(Side note: Some investors jokingly refer to profligate junior resource issuers who ‘over-issue’ shares, as “Mining the Stock Market” as opposed to mining anything from the ground.)
When the process of share issuance continues over time, it causes the outstanding share count to grow, and when multiplied by the market price – causes the market cap to continually grow. Therefore, while the share price of a company may remain the same or decline over time, the expansion or contraction of the outstanding share count may cause the market cap (or ‘price paid for the business’) to increase or decrease.
Given that most companies in the bottom three asset classes of the natural resource space are negative cash-flowing, investors need to anticipate share count expansion over time.
The brutal fact is that each additional share issued by the company represents a ‘slice of the pie’ taken from your plate, as the investor. Your interest in the company is diluted, unless you continue to purchase additional shares, as they are issued.
Why would a company issue more shares – isn’t that a form of theft, and are they cheating me out of my investment?
In defense of management teams, there are many ways in which a share issuance may be helpful to investors (the term we might use is ‘accretive’). For example, let’s say a management team wishes to purchase a strip of property adjacent to their own company’s operating gold mine.
If they issue shares and exchange them for the strip of property, the transaction may be deemed beneficial to shareholders, despite the share dilution. Whether or not the transaction is beneficial would be a separate set of calculations – namely, deciding what the shares exchanged are ‘worth’, what the strip of property is worth – and whether there is a reasonable rate of return, on the ‘notional’ value spent on the property.
A company may also issue additional shares, with the intended use of funds going toward purchasing complementary assets which may reduce the cost of operations. As an example - purchasing a fleet of vehicles or other machinery, versus leasing the same. Whether or not the transaction is beneficial would be determined by the details – comparing the value of the shares issued, versus the cost savings gained.
Quite often in the natural resource space, and nearly always by the exploration stage companies – share issuances generate funds to pay employee salaries and ‘keep the lights on’ (also known as general & administrative expense). Many exploration companies survive by continuous financings, year after year, without assurance of continued survival – throughout which, the share count continually grows.
A common term for describing the rate of the annual consumption of funds of negative cash-flowing resource companies is called ‘Burn Rate’. As an example, a company may have a $2 million cash balance on hand, with an expected expense or Burn Rate of $2 million per annum. Therefore, we know the company will run out of money within 12 months or less and will need to conduct financing.
The odds of an exploration company exploring a project on its own, funded solely by its shareholders, and discovering a Tier 1 (highly profitable) deposit, are akin to the odds of winning the lottery. When such a remote set of survival odds is combined with a negative cash-flowing business model, it becomes clear, that ‘sole-funded’ exploration companies are among the riskiest market sectors on the planet.
Let’s take a look at a hypothetical example of market cap expansion, via share count:
Beaverbrook Gold Exploration Company (a fictitious company) – has an outstanding share count of 100,000,000 as of its most recent annual report. The market price is $.10 per share. If we multiply this share price against the outstanding share count, we arrive at a market cap (or price to buy the business as a whole), of $10,000,000.00.
The company has $2 million cash on hand, which they estimate will cover exploration expenditures and general & administrative expenses for 1 year – a $2 million per annum Burn Rate, in other words.
With that knowledge, we know the company will need to raise additional funds within 12 months or less, and if they expect another year of $2 million in expenditures – then we know it will likely be a $2 million financing (assuming they wish to ask the market for that amount).
A common financing practice to attract investors is to offer shares at a discount to the market price. If our hypothetical company offers a $2mm share issuance, let’s assume they offer the shares at a price of $.08 per share – a 20% discount to market. This would imply the issuance of an additional 25,000,000 shares, bringing the total share count up to 125,000,000 – diluting existing shareholders’ interests by 20%.
In response to seeing the offering, some shareholders decide to sell their shares, and the market price drops to $.08, matching the recent offering price. However, since the share count grew – the market cap, using the new share price of $.08 – comes out to $10,000,000 – matching precisely the prior market cap, when there were fewer shares outstanding priced at $.10.
In this circumstance, the share price dropped by 20%, but the ‘price of the business’ – market cap, in other words, stayed the same. This is an incredibly important dynamic to keep track of when investing in the junior resource space, or any negative cash-flowing sectors for that matter. The negative cash flows, year after year, accumulate in the form of ballooning share structures (rising share counts), diluting one’s interest in the underlying company fairly quickly.
The process resembles a musical accordion, expanding to enormous proportions as the music is played:
 Original Image Credit: Richard Brandao, Creative Commons.
For many ‘sole-funded’ exploration companies, the speed of annual share issuance is so rapid, that within just a few years – say 3-5 – hundreds of millions of additional shares are issued. The speed and size of share issuance may cause the ‘accordion’ share structure to bloat beyond recognition.
After blowing out the share structure, many companies carry out share consolidations (also known as ‘rollbacks’ or ‘reverse share splits’). A share consolidation might entail 10, 20, 50, or even 100 shares, being condensed and replaced by as few as 1 single post-consolidation share.
Other instances may see shareholders completely wiped out through bankruptcy or other reorganization, with the subsequent launching of a new separate company under a different name (in order to shed the stigma associated with the prior corporate failure).
There are however a few segments of the junior resource space that generate mildly lower speeds of share dilution. Conservatively run ‘Prospect Generator’ and ‘Optionality Deposit’ companies may meet this criterion. We will discuss ‘Prospect Generator’ model companies at a later date.
Optionality companies typically possess one or more large resource deposits that exhibit ‘leverage’ to a higher commodity price. In simple terms, this means a deposit that is not economic to extract at today’s commodity pricing but could potentially become economic should the price of a commodity such as gold, silver, or copper, double or triple in price – with assumed production costs remaining the same.
The hoped-for strategic intent (from an investor’s viewpoint) of optionality strategy company management teams, is to spend as little money as possible on development, and general & administrative expenses while preserving the deposit’s good & marketable condition. Preserving capital helps preserve the share structure of the company – ie. decelerating share expansion as much as possible.
There are a few optionality companies that engage in exploratory drilling to increase the resource base of an existing deposit, advance feasibility study work, and/or acquire additional optionality deposits over time. ‘Active’ optionality deposit companies of this type will consequently produce share expansion at a faster speed.
Let’s take a look at a few examples of optionality companies, and inspect the share price, share count, and market cap over time, of each.
Please note, however – this exercise is meant to observe changes over time related to share price, share count, and market cap only. The examples used here do not represent an endorsement of quality or investment ‘attraction’.
For a snapshot of corporate development changes over time, and changes to what a business is ‘worth’ from an intrinsic standpoint - that would be a separate exercise outside the scope of this article.
The following statistical displays are one of many information-gathering processes. Inspection of corporate developments over time would require a review of the balance sheet, asset and resource base of the company, and income (or loss) statement.
The first company we’ll look at is Chesapeake Gold. As illustrated by the red line below – the share price declined from CAD $4.60 to approximately CAD $1.82 over the last 20-year period, from January 2004 to September 2024. This is over a 50% decline:
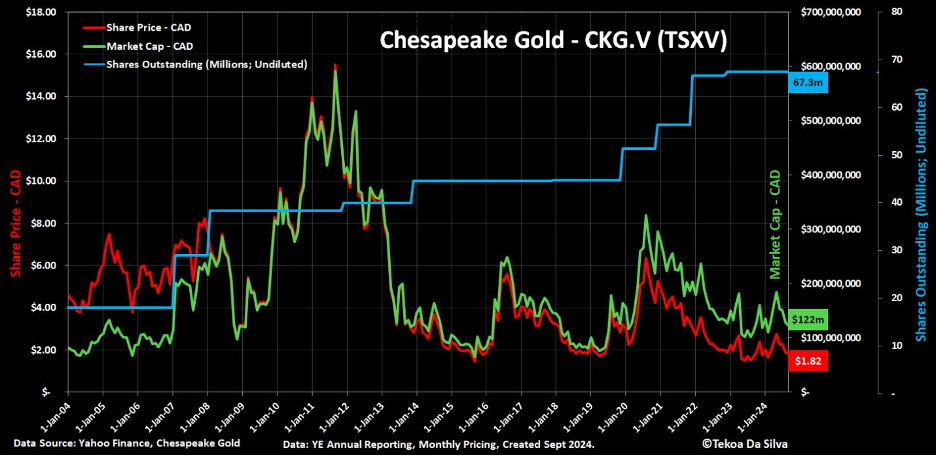 Image: Chesapeake Gold Share Price, Market Cap, and Outstanding Share Count Overlays
As illustrated by the blue line above, the outstanding share count increased from about 17 million to over 67 million during the same 20-year period; nearly a 4x increase.
This resulted in a market cap (the price of the business) increase, as illustrated by the green line, which over the same 20-year period grew from about CAD $81 million to over CAD $122 million – an increase of over 50%.
In this example, over the 20 year period, shareholders experienced a 50%+ share price decline, while the price of the business itself rose by over 50% - due to the expansion of share count, and consequently, market cap.
The second company we’ll look at is Seabridge Gold. As illustrated by the red line below – the share price increased from CAD $4.75 to approximately CAD $23.71 over the last 20-year period, from January 2004 to September 2024. This is roughly a 5x move higher:
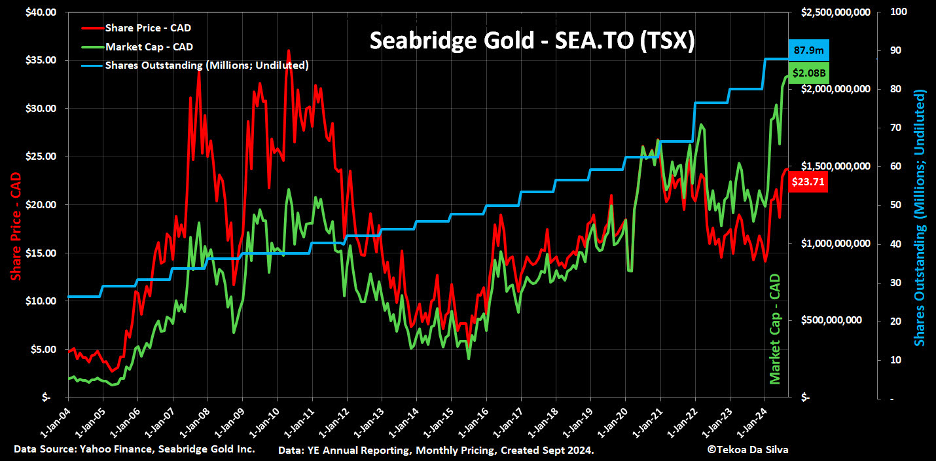 Image: Seabridge Gold Share Price, Market Cap, and Outstanding Share Count Overlays
As illustrated by the blue line above, the outstanding share count increased from about 26 million to over 87 million during the same 20-year period; over a 3x increase.
This resulted in a market cap (the price of the business) increase, as illustrated by the green line, which over the same 20-year period grew from about CAD $124 million to a recent high over CAD $2.08 billion – an increase of over 16x.
In this example, over the 20 year period, shareholders experienced nearly a 400% gain on their shares, while the price of the business itself rose by over 16x - due to the expansion of share count, and consequently, market cap.
The last company we’ll look at is Northern Dynasty. As illustrated by the red line below – the share price decreased from USD $6.15 to approximately USD $0.35 over the last 20-year period, from January 2004 to September 2024. This is nearly a 95% decline:
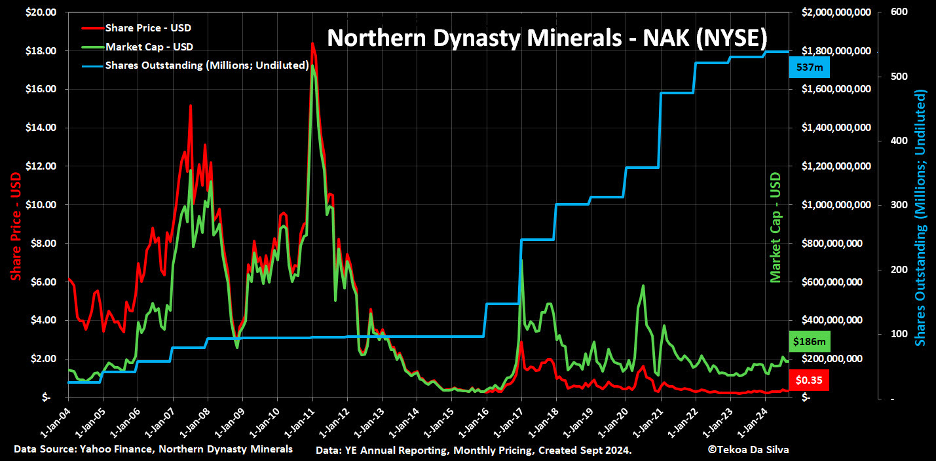 Image: Northern Dynasty Share Price, Market Cap, and Outstanding Share Count Overlays
As illustrated by the blue line above, the outstanding share count increased from about 23 million to over 537 million during the same 20-year period; over a 23x increase.
This resulted in a market cap (the price of the business) increase, as illustrated by the green line, which over the same 20-year period grew from about USD $143 million to over USD $186 million – an increase of over 30%.
In this example, over the 20 year period, shareholders experienced nearly a 95% share price decline, while the price of the business itself rose by over 30% - due to the expansion of share count, and consequently, market cap.
To further dampen this picture – a common assumption made by nonprofessional investors when looking at a 20-year price chart of Northern Dynasty – is that the USD $18.00 per share price peak generated in 2011, as a matter of course, should be recovered during the next precious metal equity ‘bull market’. From the current USD $.35 share price this would imply a 50x move higher.
When looking at the price of the business – the 2011 market cap peaked around USD $1.7 billion. The current market cap is roughly USD $186 million. Recovering the prior market cap high from here would imply a 9x move higher – not a 50x move. A 9x move higher in the share price and market cap from here (assuming no further expansion of share count), would imply a share price of USD $3.15 – a far cry, from the majestic heights of USD $18.00 per share, exhibited at the 2011 peak.
The reason the market cap revisitation multiple is lower than some expect is explained by the blue line in the Northern Dynasty chart above – the outstanding share count ballooned by over 23x, during the 20 year period.
A counterargument for a higher Northern Dynasty (or any other company) market cap might rest in the real fact that ‘2011’ US dollars are not the same as ‘2024’ US dollars. The US dollar has weakened to the extent that in January 2011 only 1,360 US dollars were required to purchase an ounce of gold, whereas in September 2024 it takes 2,513 US dollars to purchase an ounce of gold – nearly a 50% loss of purchasing power, during the period.
If we measure Northern Dynasty’s January 2011 market cap peak in gold terms – it would indicate an approximate 1,266,705 gold ounce market cap. If Northern Dynasty today revisited that same market cap peak, in gold ounce terms – at USD $2513 per oz. gold, it would imply a USD market cap of $3.183 billion. A market cap increase to that size would imply about a 17x move higher, from here.
There is a speculative prospect of further USD devaluation, which offers the potential of driving market caps higher for all ‘hard asset’ businesses. It is up to individual investors and speculators, to decide if they wish to factor currency devaluation into their approach.
The difference between ‘share price’ and ‘market capitalization’ is stark. Without knowing the quantity and difference between the two, an investor will not know how much he or she is paying for a business.
Many investors discuss share price, but not many engage in market cap discussions. Market cap is determined by outstanding share count, which like a musical accordion, can expand and contract greatly over time.
To increase survival odds, investors and speculators should consider visiting with company financial statements over time. The statements will indicate whether the share count has been expanding or contracting. It is an especially important metric to follow in the junior natural resource space.
This tool (market cap monitoring) will contribute to your competitive edge. And most investors are unaware of it.
About the author