Since its peak in August 2020, Gold has moved towards a breakout on multiple occasions but failed in every case.
Nevertheless, as of Thursday, November 16, Gold is within 4% of a daily all-time high and 2% of a weekly all-time high. It appears only weeks, if not months, from a historic breakout.
For months and months, I have explained the significance of the coming breakout in Gold.
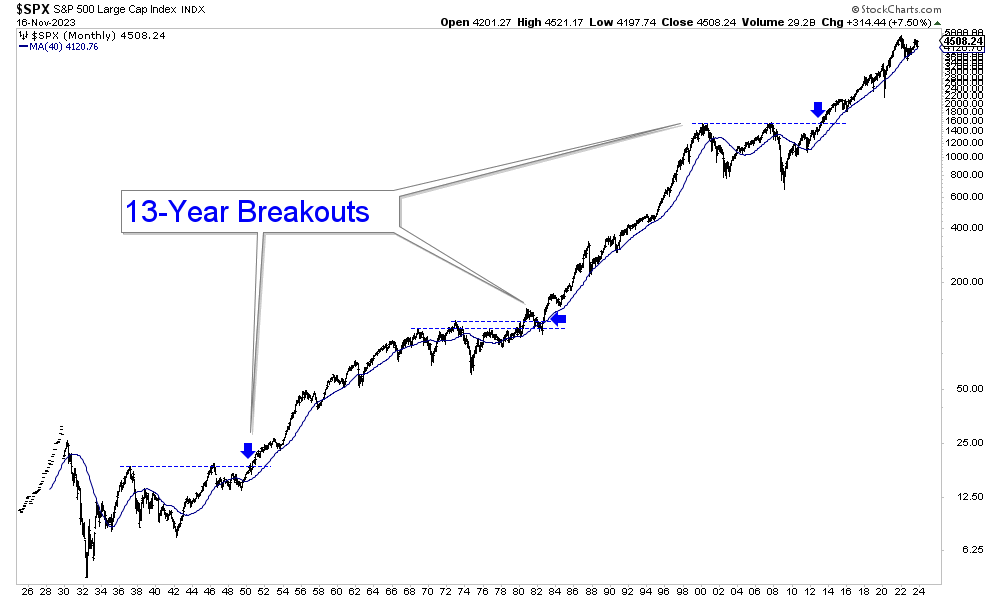
Another interesting factor is that a gold breakout in 2024 would mark a breakout from a 13-year base, and the most significant historical breakouts have occurred from 13-year bases.
Let me explain.
The three most significant breakouts in the stock market, occurring in 1950, 1982, and 2013, were from 13-year bases. Two breakouts were clean, while the stock market pulled away from the 1968 to 1982 bear market after 13 years.

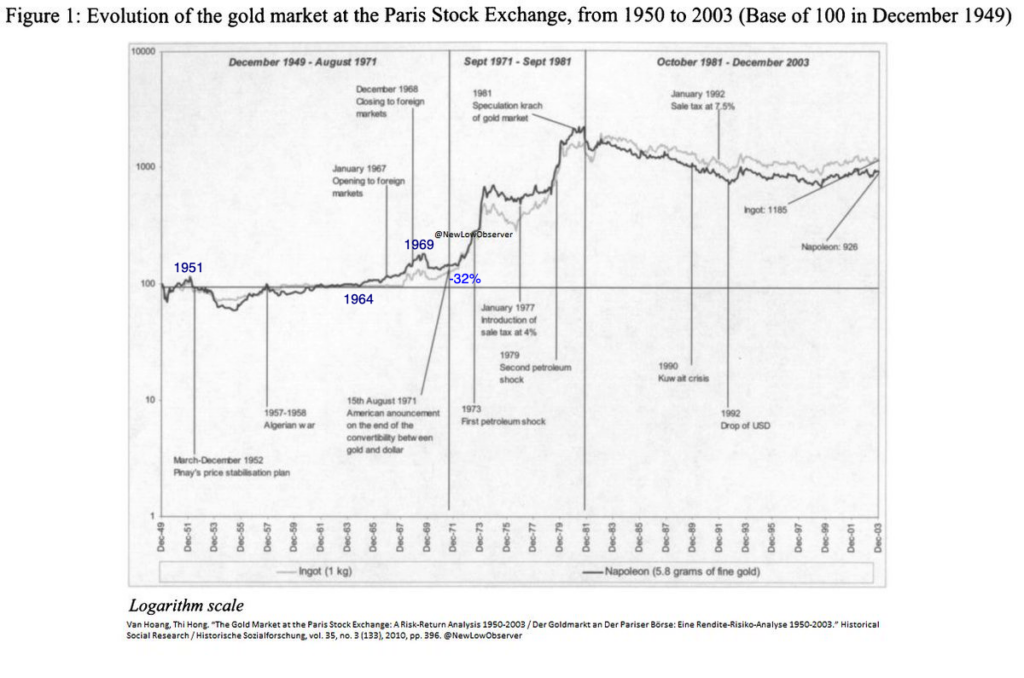
The Gold price was fixed until 1971, but there is Gold price data from the Paris Stock Exchange. See the chart below courtesy of @newlowobserver.
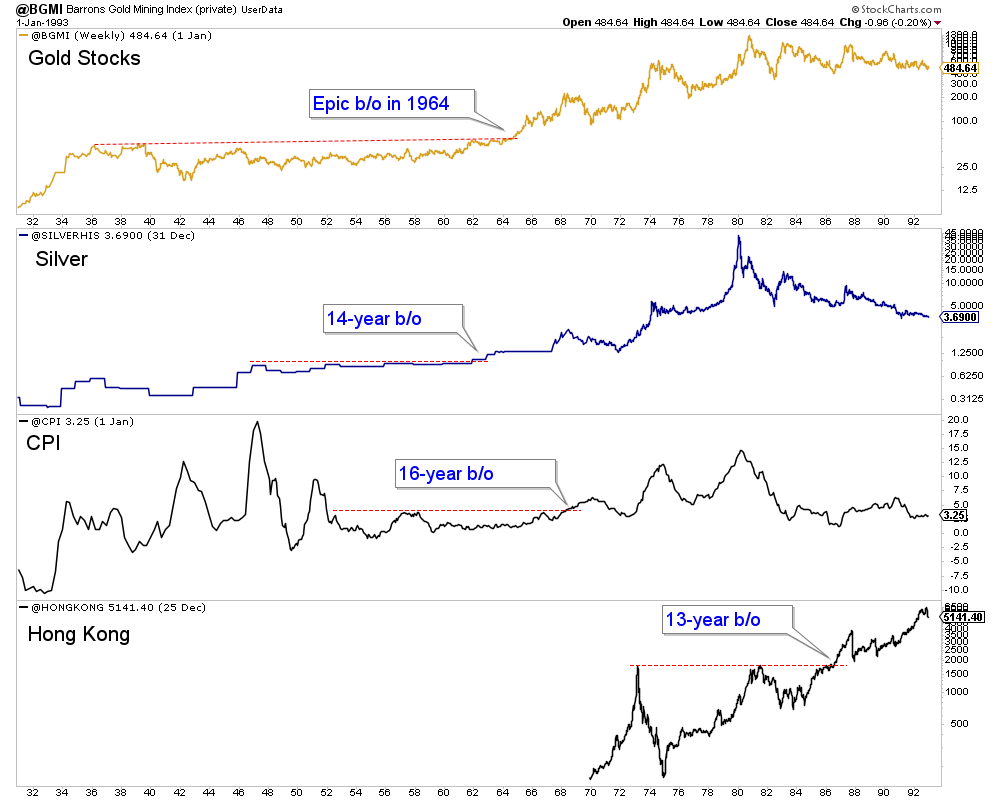
Gold’s breakout move in Paris began in 1964, 13 years after the peak (and commodity peak in 1961). Note, the best proxy for Gold in the US, gold stocks made a multi-decade breakout in 1964.

We plot other markets and data series below.
Silver broke out from a 14-year consolidation in 1961, while the inflation rate made a 16-year high in 1968. The Hang Seng, one of the largest stock markets in the world, broke out from a 13-year base in the mid-1980s.

Note that this analysis is more subjective than objective. Gold does not have to break out in the next 12 months solely because of the history of 13-year breakouts. But Gold is within striking distance, and history shows how common these 13-year breakouts are.
Gold is very close to triggering a new bull market just as sentiment towards the sector and mining companies is in the toilet. Meanwhile, fund redemptions and tax loss selling are driving these stocks lower even as a new bull market awaits.
That is creating some incredible buying opportunities.

