Following more than two months of stagnation after the U.S. presidential election, gold is now breaking out decisively, signaling its readiness to resume its rally toward $3,000 and beyond.
While this recent pause has tested the patience of many investors, I've consistently maintained that it was a healthy consolidation phase, paving the way for even greater gains. Now, as I'll demonstrate with numerous charts, gold is breaking out of its post-election trading range across nearly every major currency, reaffirming its bullish momentum.
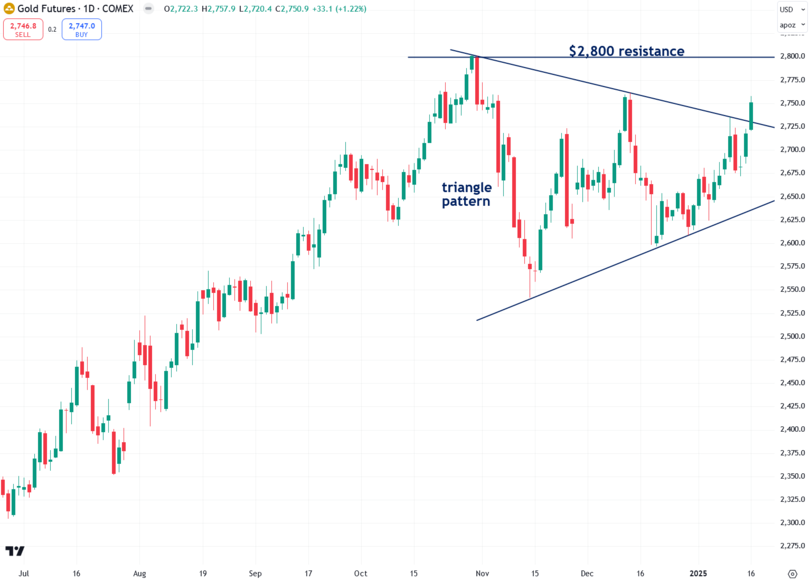
In my view, the most important gold chart to monitor is the COMEX gold futures chart, priced in U.S. dollars. Over the past few months, a triangle pattern has taken shape—a formation that is typically a continuation pattern, suggesting the uptrend preceding it is likely to persist.
Yesterday, gold broke out of this triangle, an encouraging development. A similar triangle formed in late 2007, and its breakout signaled substantial gains in the ensuing months.
To fully confirm that yesterday's breakout is genuine, I’m looking for a decisive, high-volume close above the key $2,800 resistance level. Breakouts above horizontal resistance levels carry greater validity than those above diagonal ones, making this milestone particularly significant.
The $2,800 resistance level holds particular significance as it marked gold's peak in late October before the recent pullback. Additionally, it serves as a key psychological level, reinforcing its importance in the eyes of investors.
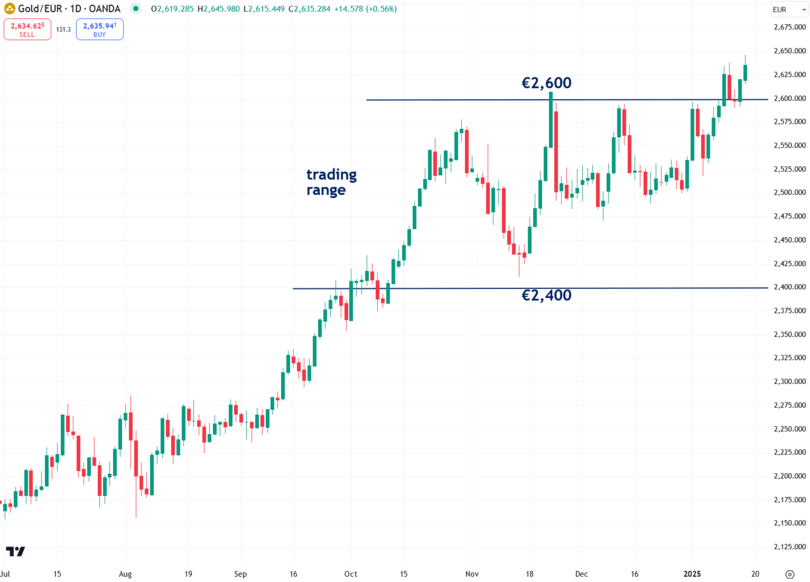
The next critical chart to watch is gold priced in euros. This chart is particularly informative because it eliminates the influence of U.S. dollar fluctuations, providing a clearer view of gold’s intrinsic strength.
Over the past two months, gold priced in euros has outperformed gold priced in U.S. dollars, largely due to the dollar's strong rally, which has made gold seem weaker than it truly is. Just a few days ago, gold priced in euros closed above the key €2,600 resistance level—an all-time high—delivering a strong bullish signal.
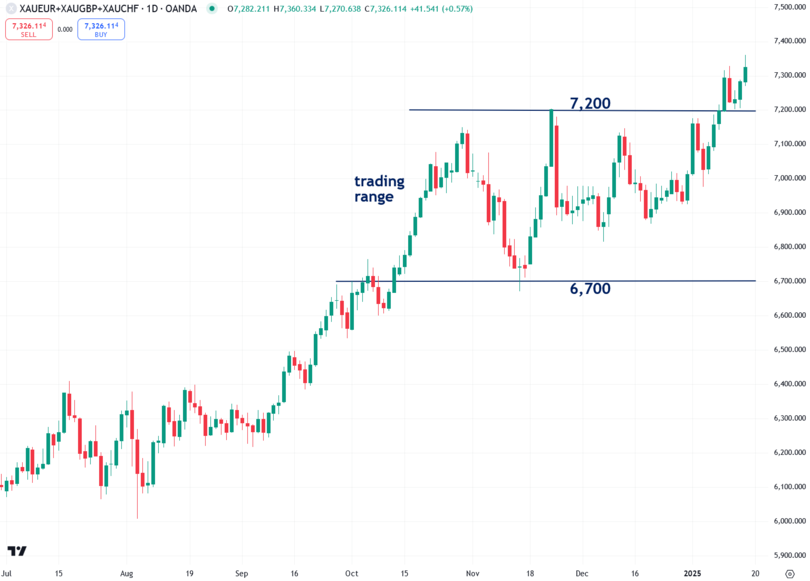
The chart below shows gold prices in euros, British pounds, and Swiss francs. I find that this particular mix shows gold's movements very clearly.
Gold priced in this mix of currencies recently closed above the key 7,200 resistance level signaling that the yellow metal’s bull market is ready to continue once again.
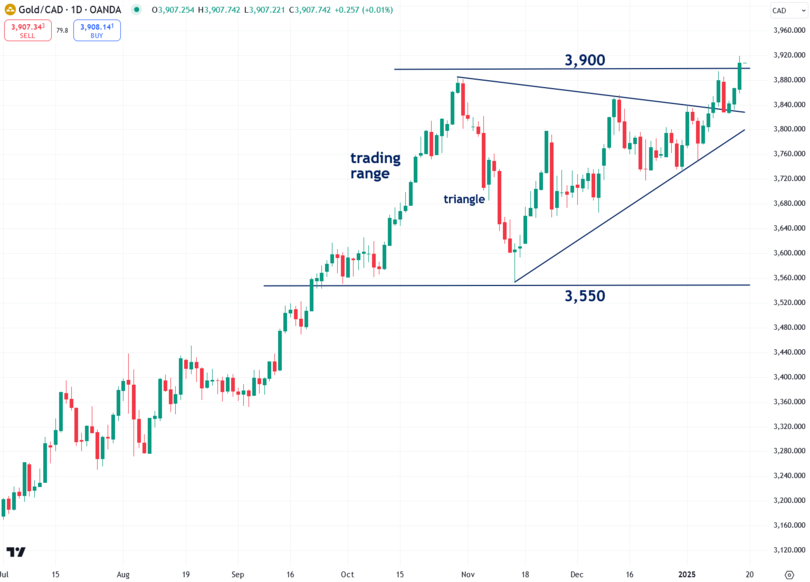
Gold priced in Canadian dollars recently broke out of a triangle pattern, signaling bullish momentum. For further confirmation, I’m looking for a decisive close above the horizontal 3,900 resistance level.
This chart holds particular significance as Canada ranks among the world’s top gold producers, claiming the fourth spot globally with 200 metric tons of gold produced in 2023.
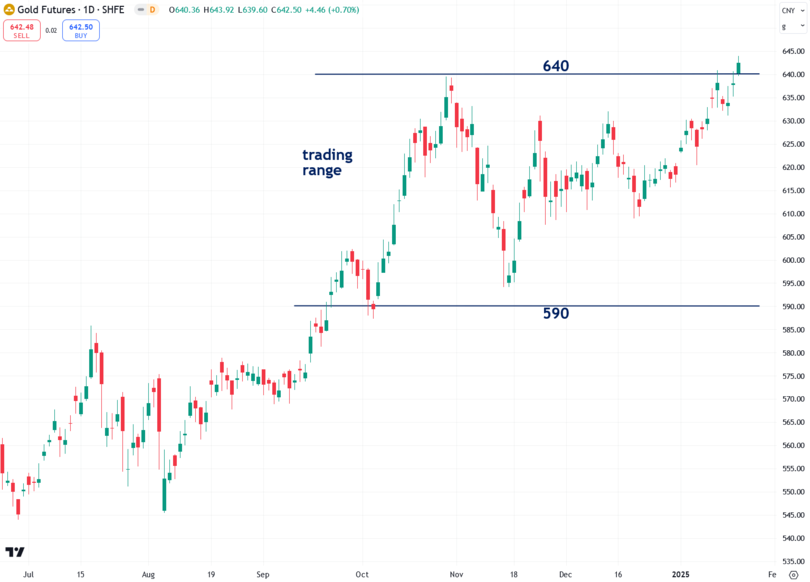
China’s gold benchmark, the Shanghai Futures Exchange (SHFE) gold futures, closed above the critical 640 resistance level on Thursday. As the world’s largest producer of gold—producing 370 metric tons in 2023—and one of its largest consumers, China plays a pivotal role in the global gold market.
For months, I’ve theorized that a resurgence of Chinese gold futures traders—who were instrumental in driving gold’s surge in March and April—could be the catalyst to propel prices toward $3,000 and beyond. I believe that today’s bullish breakout will turn that forecast into reality.
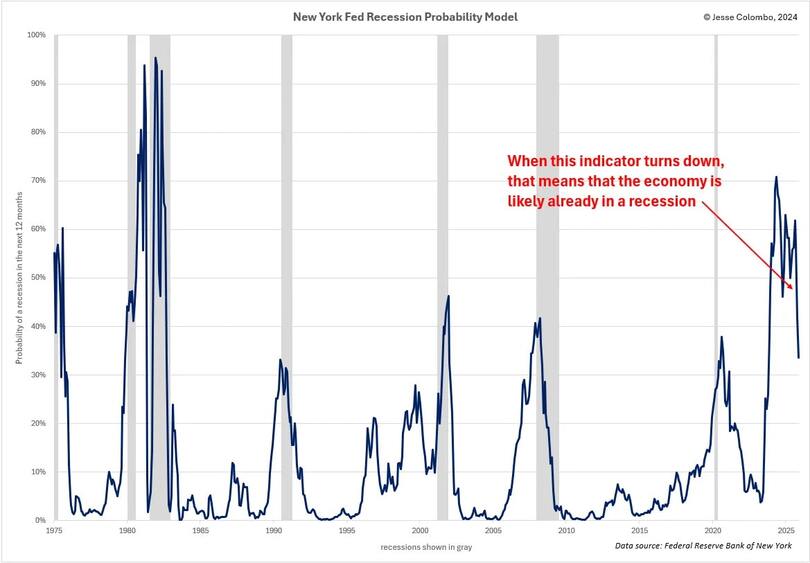
One key reason gold’s bull market is gaining momentum again is the increasing risk of a U.S. recession. Recessions are typically bullish for gold, as they lead to interest rate cuts and quantitative easing (QE)—essentially digital money printing.
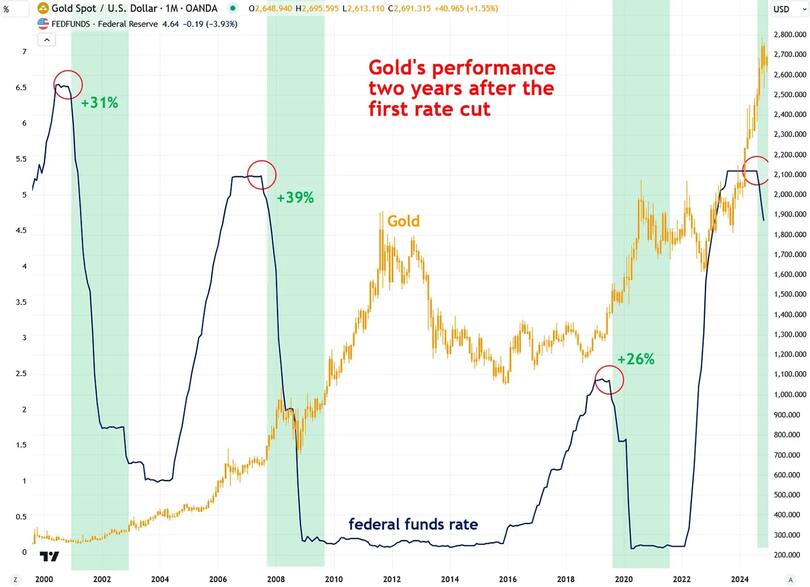
There are other reasons to believe that gold’s bull market is still quite young. For example, there is a strong tendency for gold to continue to rise strongly after the first Fed funds rate cut in a rate-cutting cycle.
As the In Gold We Trust report aptly stated, "rate cuts are like rocket fuel for gold." The report showed that over the past three rate-cutting cycles, gold has risen an average of 32% within two years of the initial rate cut.
If gold follows a similar trajectory this time—following the Fed's rate cut on September 18—it could rise to $3,380, representing a 25% increase from its current level of $2,714.
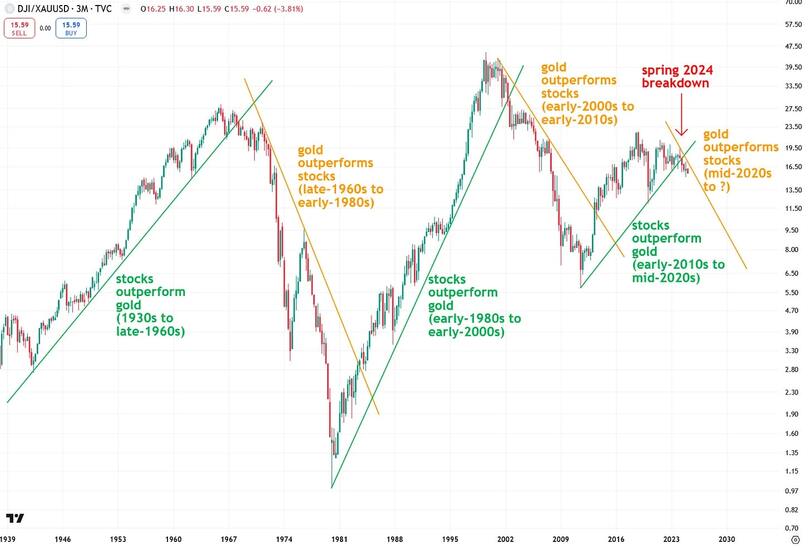
Another key reason gold’s bull market is still in its infancy is the massive bubble in the U.S. stock market, which will end in a significant bear market.
This downturn will lead to a substantial transfer of capital from stocks into gold. Notably, the Dow-to-gold ratio broke below its uptrend line in the spring of 2024, signaling that the rotation of capital from stocks to gold has already begun. This shift will gain momentum as the stock market bubble inevitably bursts.
In conclusion, gold is undergoing a significant breakout from its recent consolidation period, signaling the continuation of its bull market. This rally is poised to propel gold to $3,000 and much higher as the global paper money experiment inevitably unravels.
Additionally, inflated asset prices, such as U.S. stocks, are destined to correct sharply, driving a massive shift of capital into safe havens like gold. While many investors remain bored or pessimistic about gold, now is the time for optimism.
The outlook for gold is exceptionally bright, offering a promising opportunity for those paying attention.

