Here we go again. Another year over and a new one just begun. It's a time of gratitude and reflection. It's a time of assessment and resolution. And it's also a time of grandiose forecasts of the year to come.
The biggest challenge I have in writing these "macrocasts" is getting started. It always seems such a daunting task...and for what gain? Experience has taught me that much of what I'm about to write will be proven wrong over the months ahead, anyway, so why make the effort?
But here's why. As I try to explain in the preamble every year, I write these things for me not you, my dear reader. While I encourage you to read what follows, you should simply take it under advisement with all of the rest of the annual forecasts you read at this time of year. Perhaps my guesswork, when combined with other trusted sources, can provide a framework of what to expect in the year ahead? Perhaps. But this is an important piece of work for me personally. Why?
Because I am going to get things wrong and I need to have a written record of what I was thinking as the year began so that I can go back at the end of the year and attempt to learn from my mistakes. By doing so, maybe the next year's macrocast will be more accurate?
With this in mind, let's go back and review what I wrote in early January of 2024. If you'd like to reread the entire macrocast, here's a link:
The forecast was titled "Waiting For Jerome" because the big issue as 2024 began was the expectation of fed funds rates cuts scheduled for later in the year. As 2023 ended, the fed funds futures market was pricing in as many as seven rate cuts (175 basis points) in 2024. However, the FOMC's Summary of Economic Projections from December of 2023 stated that only three rate cuts (75 basis points) should be expected. So who would be right in the end? The Fed. Rate cuts didn't begin until September and, by year end, the fed funds rate had been trimmed by 100 basis points.
The rate cutting cycle that started in September goosed the precious metals to their highs of the year. But the rally had been ongoing since March so it's safe to say that fed funds rate cuts were NOT the primary driver of precious metals prices in 2024. And there you have it. Error #1 in the 2024 macrocast.
If it wasn't Fed policy, then what was the primary driver of price in 2024? That's hard to say as it was a combination of factors that led to the best annual gain for gold since 2010. For me, though, I believe that the most significant factor in driving the gold price higher in 2024 was the consistent and relentless demand for physical gold at the central bank level. 2024 marked the third consecutive year of near-record central bank gold demand and their persistent bid for metal placed a "physical floor" under the digital derivative gold price, negating all attempts by the Bullion Banks to wash price backward.
As such, it seems that the primary factor in predicting the gold price in 2025 will be the persistence of that central bank bid. If it remains, we should expect another solid gain for the gold price this year, regardless of other macro and geopolitical influences. However, if the global central banks begin to ease off their current buying pace, gold will have a more difficult time advancing higher. As such, watch the central bank monthly demand numbers very closely in 2025.
The good news is that overall sovereign demand has remained strong into year end 2024 and shows no sign of letting up in 2025. The much-publicized halt of official Chinese purchases back in May was reversed by November and even Goldman Sachs acknowledged that off-books Chinese gold demand could be as much as 10X higher than officially reported. Combine that with steady demand from Turkey, Russia, India and a host of other "Global South" or "BRICS" nations and you have the recipe for another strong year of central bank gold demand in 2025.
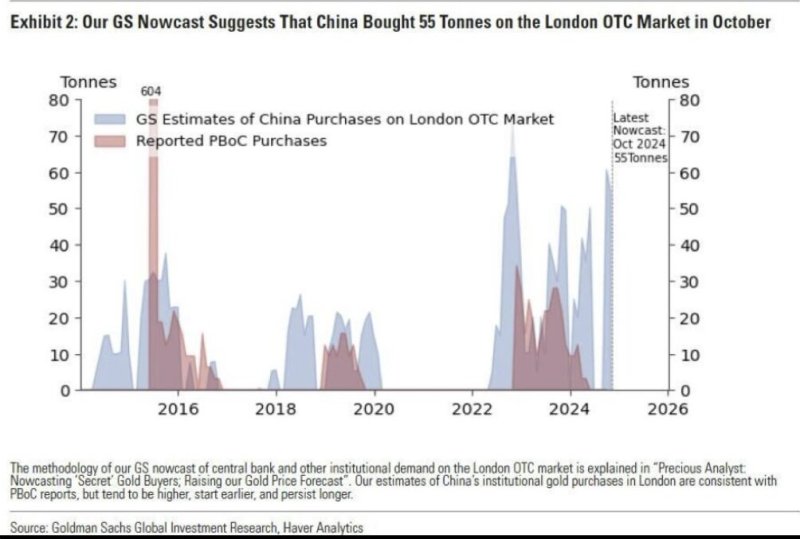
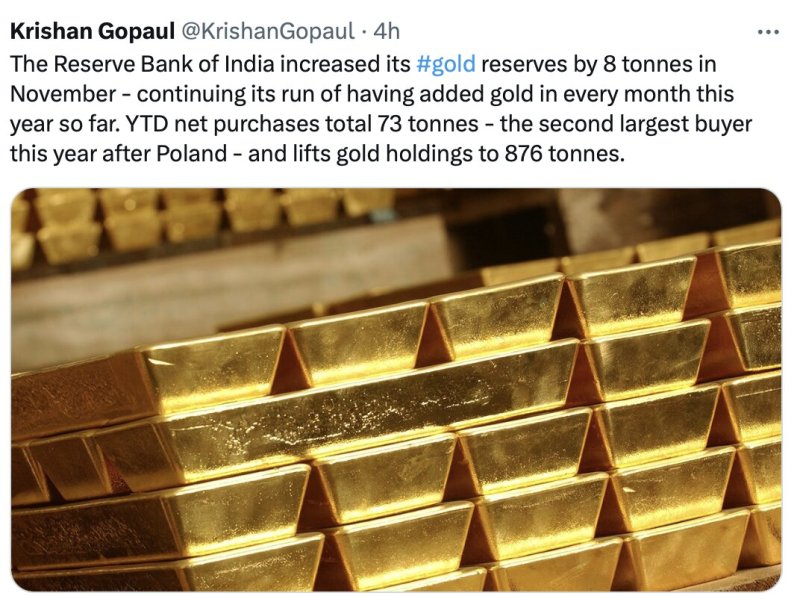
But here's the thing...Central Bank gold demand simply underpins the market and prevents price from falling dramatically. If nothing else changes, central bank demand alone should drive another 8-10% gold price rally in 2025. But there are other factors in play. For example:
- Can the U.S avoid a clear and obvious economic recession?
- Will another liquidity crisis appear?
- Can the Trump administration reel in some of the out-of-control deficit spending and debt?
- What if The Fed is forced to cut the fed funds rate by more than the current forecast of just 50 basis points?
With those factors in mind, let's begin our forecast for 2025.
Let's start with the U.S. economy and possibility of recognized recession in 2025. Now look, I thought that 2023 would bring a recession and I was wrong. I then concluded that 2024 was almost certain to bring recession but, by current government statistics, I was wrong about that, too. As such, take this prediction of a recession in 2025 with a pretty large grain of salt.
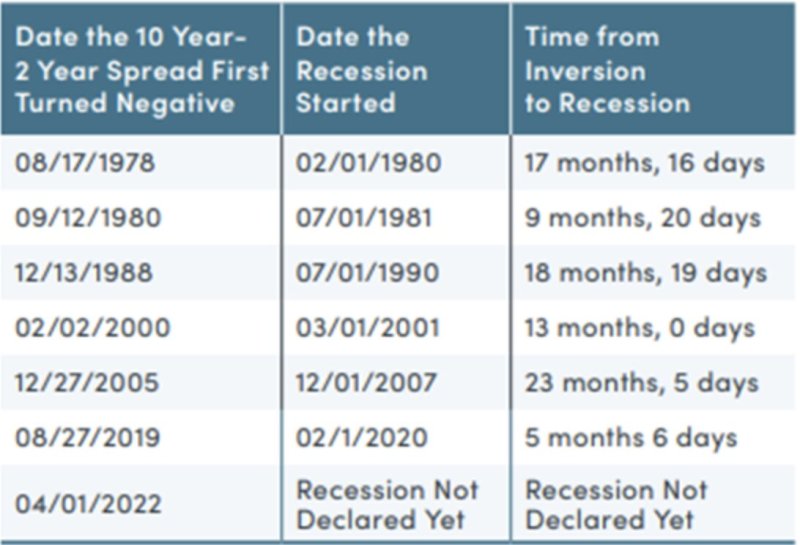
Do you remember the inverted yield curve? That's the situation where short-term interest rates are higher than long-term interest rates. When this develops, it's almost always a signal that a recession is pending and from 2022-2024, the inversion of the 2-year treasury note yield versus the 10-year treasury note yield persisted for a record-breaking 783 days before the "inversion reversion" began in September.
Again, though, the yield curve inversion is simply a signal that a recession is coming. It does not signal that the recession has begun. See below:
What has been proven over time to signal that the recession has begun? That inversion reversion. Look closely at the chart below from the Federal Reserve. When the blue line dips below 0%, the yield curve is inverted. But notice the gray areas that depict periods of economic recession, they all follow after the blue lines moves back above 0%...the inversion reversion.
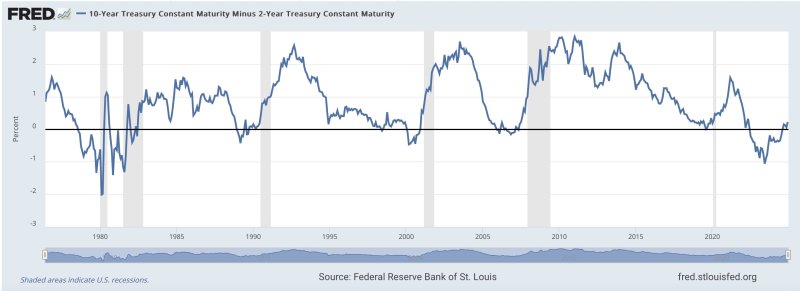
All six recognized recessions since 1980 have followed a yield curve inversion then reversion. All six. The seventh is going to extend this pattern and it will begin in 2025. Of that, I am certain.
OK, so if the U.S. economy slides into recession, how will that impact Fed policy? Well, you can be confident that a recession will lead the Fed to cut by more than just 50 basis points in 2025 but how much more? For that answer, let's keep moving down that bullet point list posted earlier.
What if another U.S. and global liquidity crisis appears? In some ways, we begin 2025 as we began 2019. As 2018 ended, The Fed was forecasting rate hikes in 2019 but, as liquidity dried up and stonk markets began to falter, The Fed quickly shifted course. They opened their repo window (adding liquidity) and actually began to cut rates by June of 2019. Hmmm, does that sound familiar? It should and that same scenario may play out in 2025. Why? Because 2025 begins with the U.S. on the verge of another liquidity crisis.
Much of the "growth" in 2024 was due to excess liquidity and U.S. deficit spending. After reaching a peak of $2.3T in 2022, the reverse repo balance at The Fed has fallen toward ZERO as SecTreas Yellen issued a record amount of T-bills to fund government spending. The chart below was included in the 2024 macrocast. It shows how unusual it was to have a $2.3T reverse repo "slush fund".
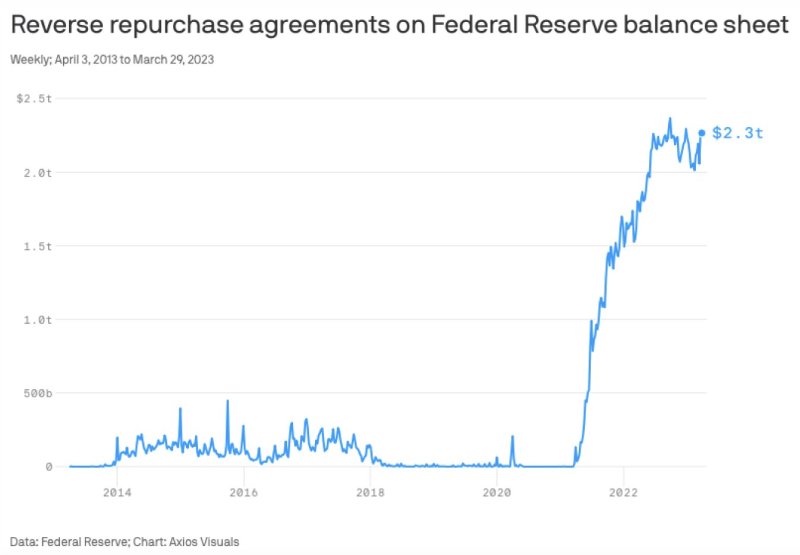
But now that slush fund is nearly drained as cash flowed out of the reverse repo account in 2024 and into treasury bills. As 2025 begins, that game is over and all those treasury bills issued last year will soon mature and need to be refunded, reissued and rolled over. Again, with reverse repo now near zero, from where will the dollars flow into the next generation of debt? The incoming Trump SecTreas claims that he wants to roll the debt into longer-term maturities than bills. OK, fine. But that new cash is going to have to come from somewhere!
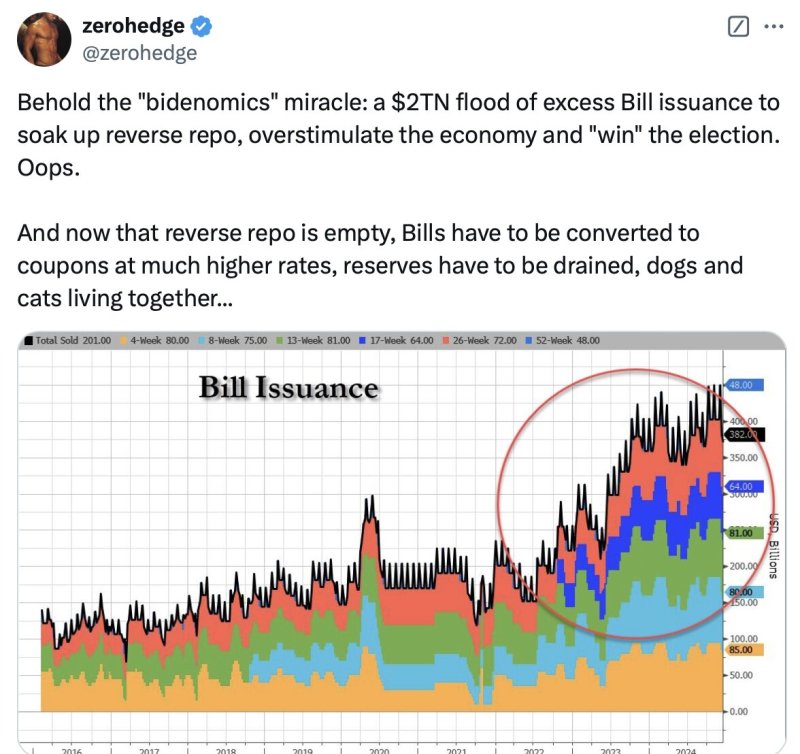
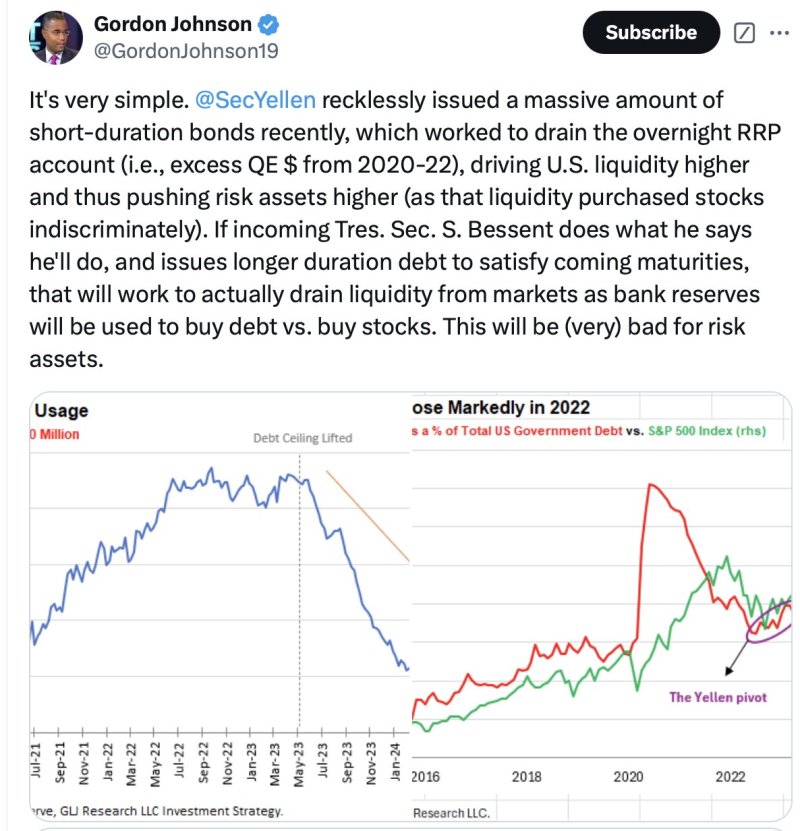 Indeed, the environment for "risk assets" in the first few months of 2025 may be quite challenging, as Gordon Johnson notes above. But that's how the year starts. What I'm concerned with in the macrocast is how the year ends and any liquidity crisis that forces fed fund rate cuts, a flush of liquidity and an easing of financial conditions will, ultimately, drive these same "risk assets" sharply higher.
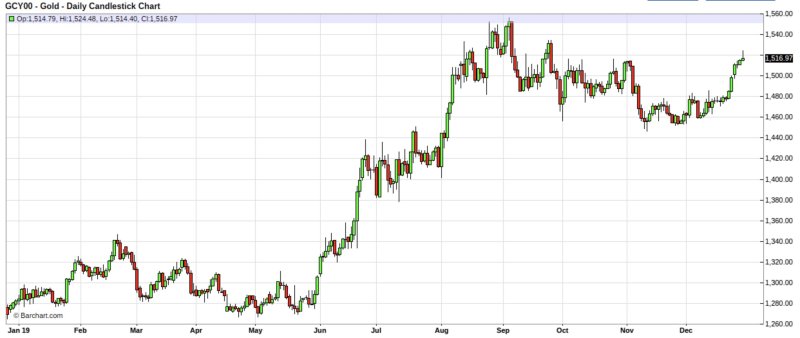
Back to that 2018 example. Check the chart below. Notice how the gold price went sideways for the first five months of the year before surging as The Fed was forced to cut rates more aggressively than anyone was expecting when the year began. Ultimately, gold ended 2019 with a gain of 18.3%. Is that a good analog for 2025? Maybe. But let's keep digging.
As we dig, let's address the other major driver of the gold price for the year ahead...the out of control U.S. deficit and debt. The election of Trump has brought a false optimism that somehow the spending can be reined in, the debt bomb defused and The End of The Great Keynesian Experiment forestalled. In my view, this is wildly misplaced optimism and economic reality will soon return. Why?
Take a look at the chart below. It's taken from the U.S. Treasury's monthly statement and it shows the total deficit spending for just the first two months of the new fiscal year, which for the U.S. government, began on October 1st.
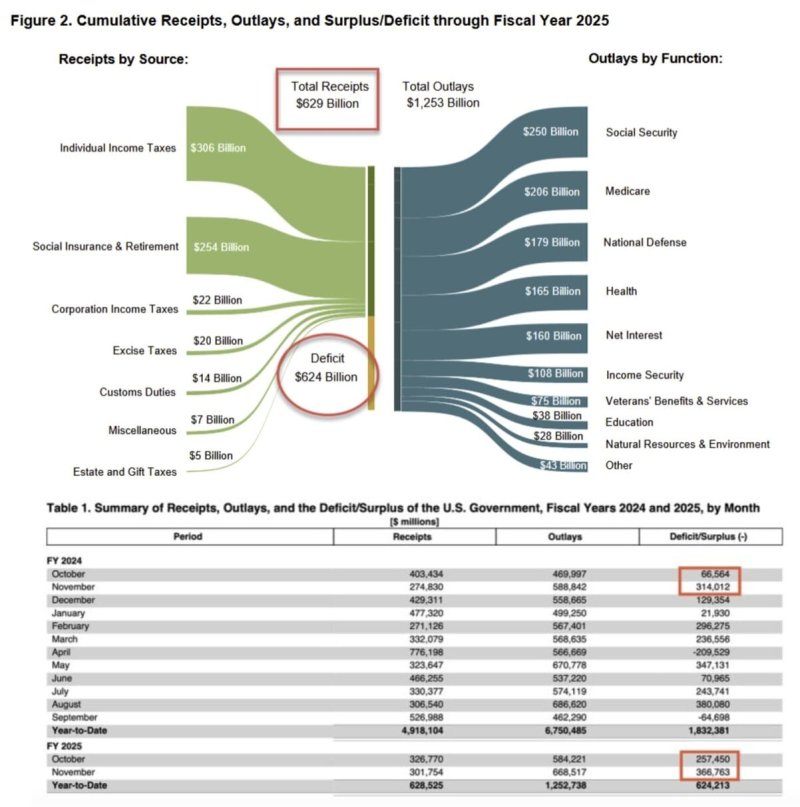 Let's consider some important points from that chart. First, the deficit for just the month of November alone was $366.7B.I'm old enough to remember when an annual deficit of $366B was scandalous and cause for worry and panic. In 2024, $366B in a month barely generates a headline.
Next, notice that November's deficit spending followed a deficit of $257.4B in October. When you combine just these two months of the new fiscal year,you get a total deficit thus far of $624.2B.Again, that's just the first two months of the new fiscal year! Last year at this time, the deficit was already $380.5B and that was bad enough but this year is already 64.2% worse! That's terrible!
Some think that Trump and his team will bring spending down and maybe they will. However, the deficit is calculated by the government spending more than they take in via tax receipts and fees. What if that recession finally comes in 2025 and a slowdown in economic activity leads to lower tax revenues? A $500B cut in overall spending could be offset by a $500B drop in total receipts...leading to the exact same net deficit! The point is....Don't go thinking that the Musk/Ramasway D.O.G.E experiment will lead directly to deficit reduction. Even if their extraconstitutional suggestions get acted upon, the net impact on deficit spending is likely to be negligible.
And all of this leaves the bigger problem...the accumulated U.S. debt...in the same, tenuous and critical state. In 2024, the annual service cost of the existing debt reached over $1T and it continues to grow. Soon, this "net interest" line item will exceed health payment costs for the U.S. government and become the third-largest outlay. How long before it exceeds Social Security and Medicare costs, too? Not long at all.
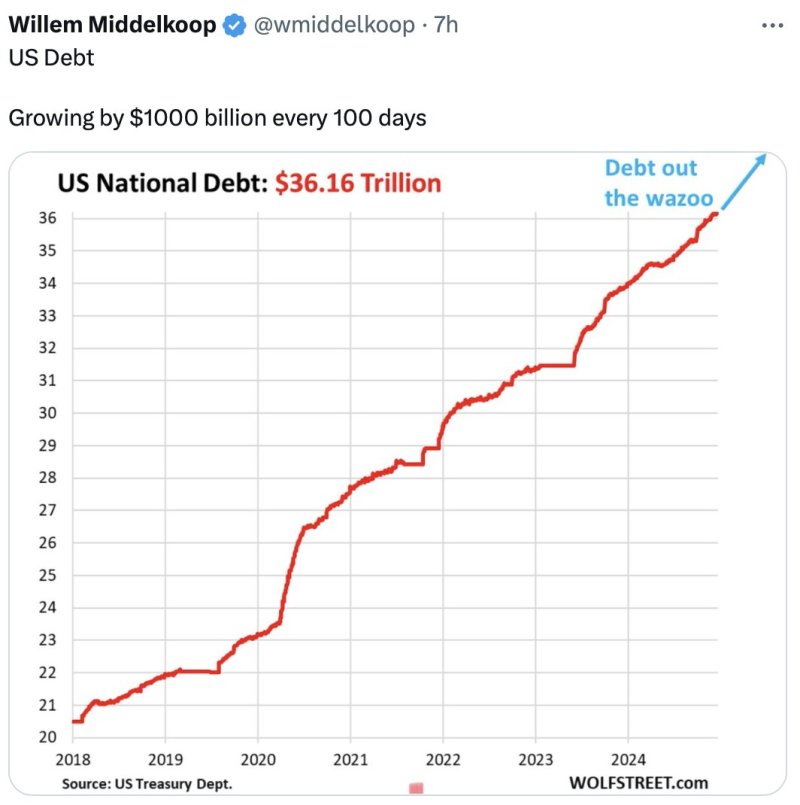
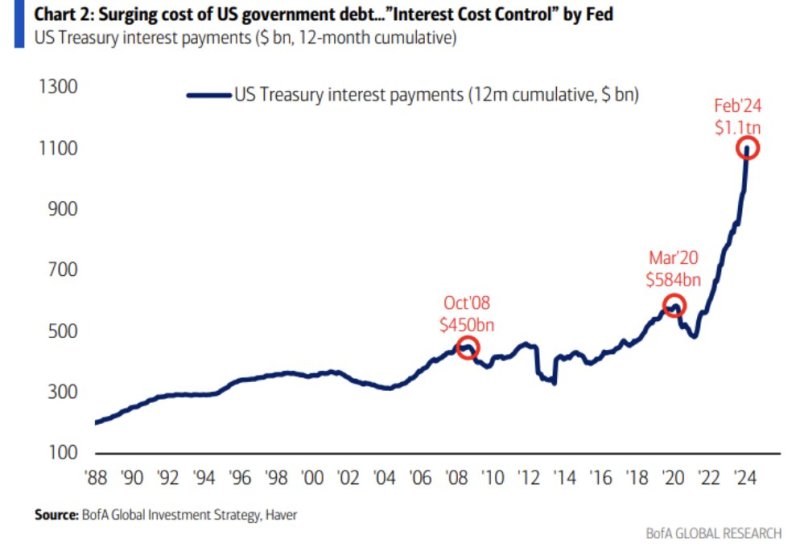 Potentially making matters worse is the notion that higher interest rates will prevail in 2025. Rates have soared in the last 100 days of 2024 and many analysts/economists expect this trend to continue. Consider all of the treasury refunding and new issuance that is pending for 2025. I've seen totals as high as $10T! If rates continue rising, and if new SecTreas Bessent has his way in shifting issuance toward higher-yielding long rates, that debt service cost and associated federal deficit, is about to skyrocket.
In the end, this macrocast is once again reliant upon the question...What will The Fed do? As mentioned earlier, 2024 ended with The Fed expecting solid economic growth, a decent labor market and relatively low price inflation in 2025. As such, they anticipate just two fed funds rate cuts in the next year for a total of just fifty basis points. Here's their Summary of Economic Projections from the December FOMC meeting: https://www.federalreserve.gov/monetarypolicy/files/fomcprojtabl20241218...
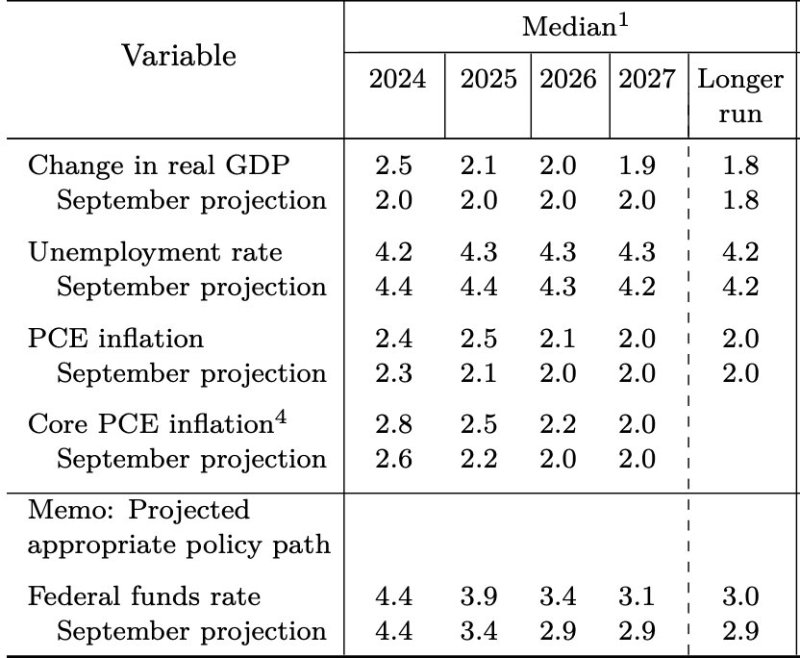
Now would be a good time to remind you that The Fed and the "market" are almost always wrong about their interest rate projections. As such, these experts are likely to be wrong about 2025, too.
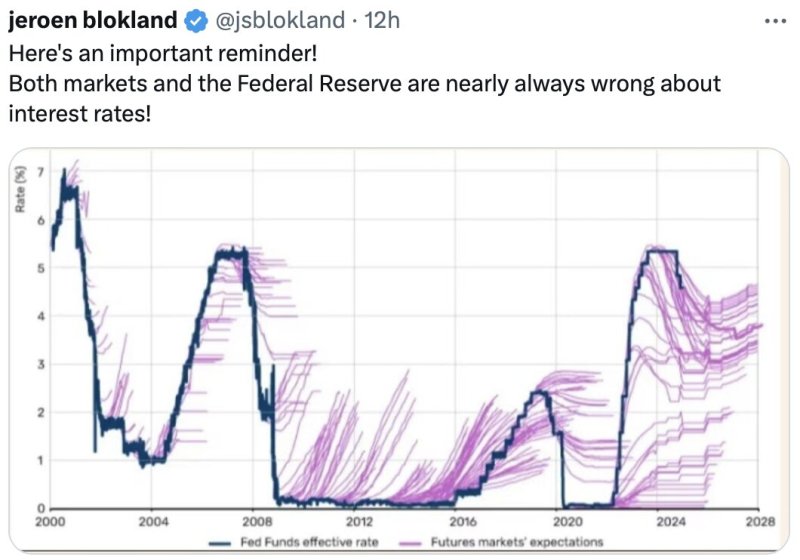
So I'd imagine that you've begun to see where I'm headed here. As 2025 begins, the experts are forecasting stable-to-higher interest rates with an attendant higher U.S. dollar. They're also expecting a strong U.S. economy with slowing U.S. deficit spending. In my view, these "experts" are all wrong.
Instead, a demonstrably weakening U.S. economy and possible/likely liquidity crisis will drive fed funds rate cuts that will begin that earlier than the current consensus of June and these rate cuts will be more substantial than expected, perhaps as much as 150 basis points or more by year end. Additionally, do not be surprised if The Fed is openly discussing the possibility of a yield curve-controlling new QE program by December 2025. They've followed that path as a way of managing government deficits before. It's only a matter of time before they try it again.
If I'm correct, all of this will serve to drive the U.S. dollar index lower over the course of the year and create conditions for a rally in Comex precious metals. As 2024 ended, the dollar index was surging with a gain of over 8% in Q4 alone. However, we've seen this movie before...in 2016. Back then, when Trump was elected the first time, we saw a very similar Q4 rally. But what happened next? A decline as the incoming president prefers a weaker dollar for trade purposes. Could we be about to see a repeat?
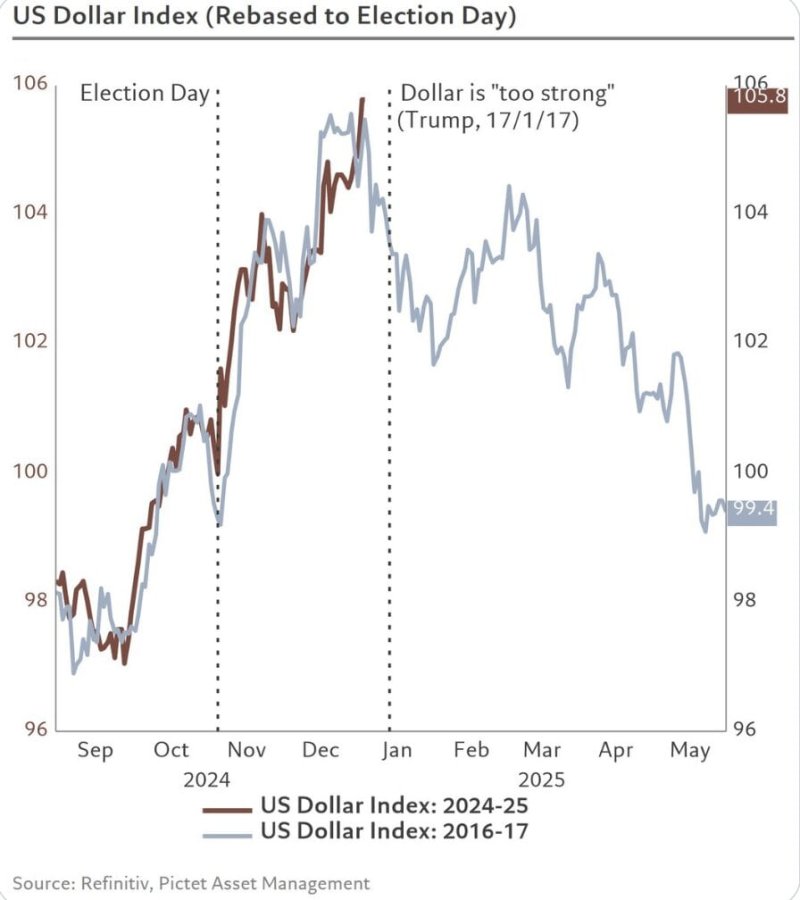 Putting it all together...When we combine a softer dollar, lower interest rates and a weaker economy with the continuance of central bank physical gold demand, we've got the recipe for another year of strong gains ahead.
How strong? Let's start with gold and the history of price gains since The Great Financial Crisis and initial onset of Quantitative Easing in 2009. In this chart from Ronnie Stoeferle, note the pattern of gains measured in all major fiat currencies since that pivotal year. The chart shown below was updated as of a few weeks ago but it's pretty accurate as to where all pricing ended 2024 and in the cumulative average category, as well.
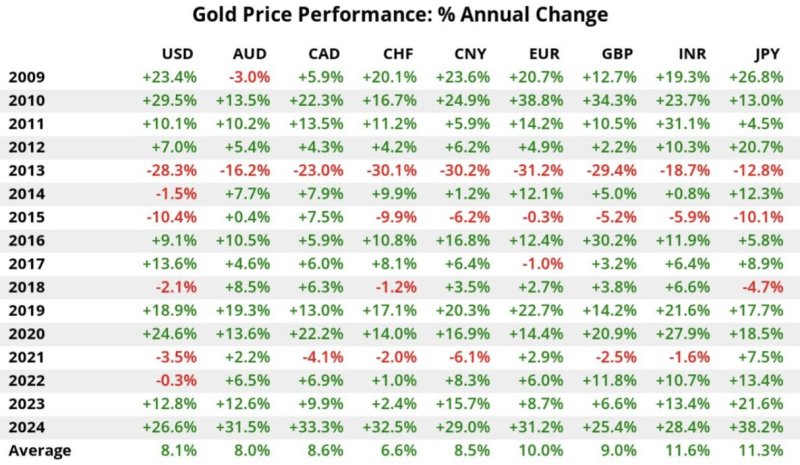
There seems to be a pattern here. As mentioned above, 2025 may be like 2019, a year which in some ways was like 2010. Well, notice the gains for gold in those years. The gains of 2010 led to more gains in 2011 and the gains in 2019 were followed by an even bigger year in 2020. As such, it's not unreasonable to expect further gains for gold in 2025, even though 2023 and 2024 were both years that exceeded the average.
Or look at it this way. The years of 2010, 2019 and 2024 all saw a shift in Fed policy from tightening to easing....less easing to more easing...higher rates to lower rates. The shift occurred within those calendar years. QE1 in 2009 and QE2 in 2010. The rate cuts that began in June of 2019. The rate cuts that began in September of 2024. The gains for gold in those years? 29.5% in 2010, 18.9% in 2019 and 26.6% in 2024. What followed? Another 10.1% in 2011 and a 24.6% rally in 2020. Considering this past performance, it seems reasonable to expect gains for gold in 2025, too.
Back to the question from a few paragraphs earlier...How strong will be the gains in 2025?
Below is a chart of the spot price of gold in 2024. The first thing that should catch your eye is the resemblance to 2019 that was posted above. Beyond that, though, notice the consistent up trend and rally, interrupted as you'd expect by the occasional pullbacks and consolidations.
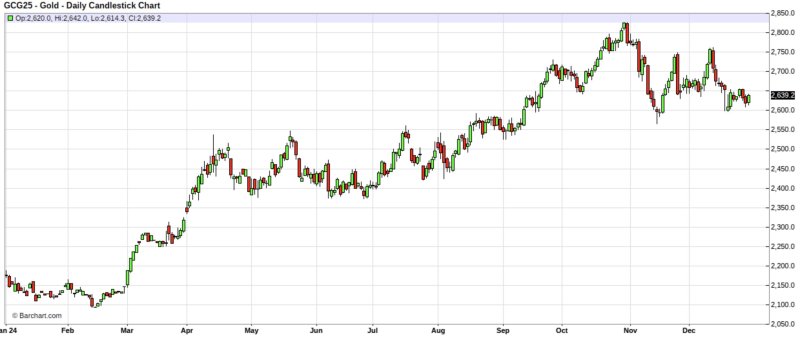
And the long-term chart looks great. As 2024 began, we expected a breakout from the 3-year consolidation pattern and a move toward $2300. We got that and more! Now, as 2025 begins, the major target becomes the all-time highs posted in late October. Moving price up and through that level won't be easy and you can be confident that the Bullion Banks will work diligently to paint a double top once we get there. Additionally, that expected Q1 liquidity crisis is likely to impact all "risk assets", including gold so, like 2019, price may continue its current sideways consolidation for a few months of the new year. However, all of the macro factors detailed earlier in this forecast will...eventually...have an impact.
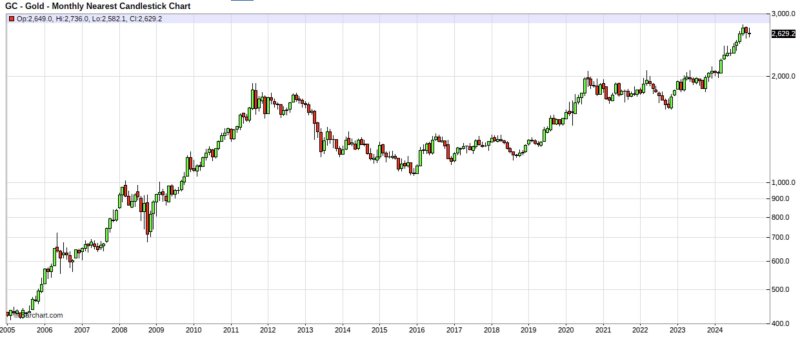
I expect new all-time highs for the gold price by mid-year 2025 at the latest. From there, another 10% rally to new highs should follow, which would take price to about $3100 or so. From the current price level, that's about a 20% rally and in line with what was seen in 2011 and 2020.
Will the gold price finish 2025 above $3000? Almost certainly. Will it far exceed $3000 with another 25-30% annual gain? That's going to depend upon all that you've read thus far. I invite you to stop here, scroll up and read everything again and then decide for yourself. For me, I'm going to go with $3100 as my base case and hope that price exceeds my expectations.
Now let's turn to silver where 2024 was a good year...a solid year...but one that ultimately disappointed somewhat. Why? Because with gold up 26%, we might have expected silver to be up something like 30-40%. Instead, it was up about $22% and failed to finish the year above $30. This tempers my enthusiasm for 2025 just a bit.
Why? See this next series of charts. First, this chart of gold from last year's macrocast. These are annual candlesticks going back to 1997. Note the breakout and new annual closing high that occurred in 2023. This effectively foreshadowed the gains of 2024.
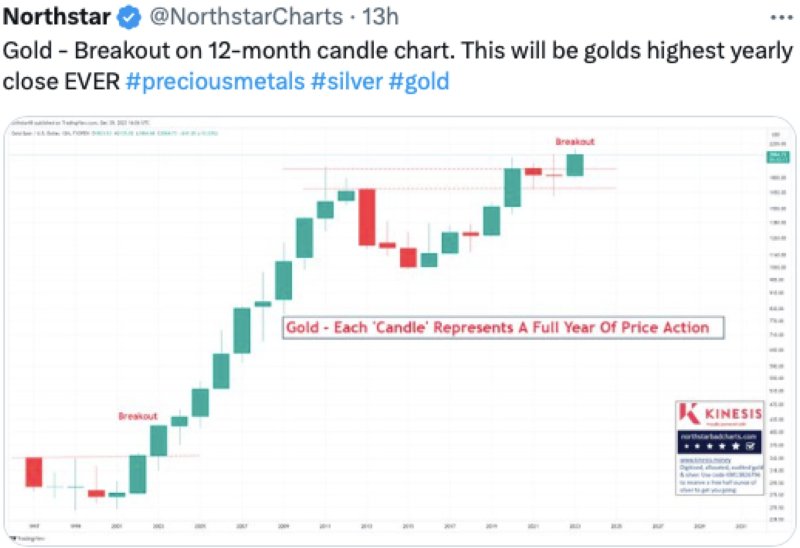
Silver had a chance to paint its own breakout in 2024. As late as mid-December, it appeared poised to post its highest ever annual close, exceeding the $30.85 close seen in 2010. Unfortunately, it wasn't to be. A large liquidation of silver futures following the December FOMC meeting led to weaker prices through New Year's Eve and spot silver finished the year at $28.97.
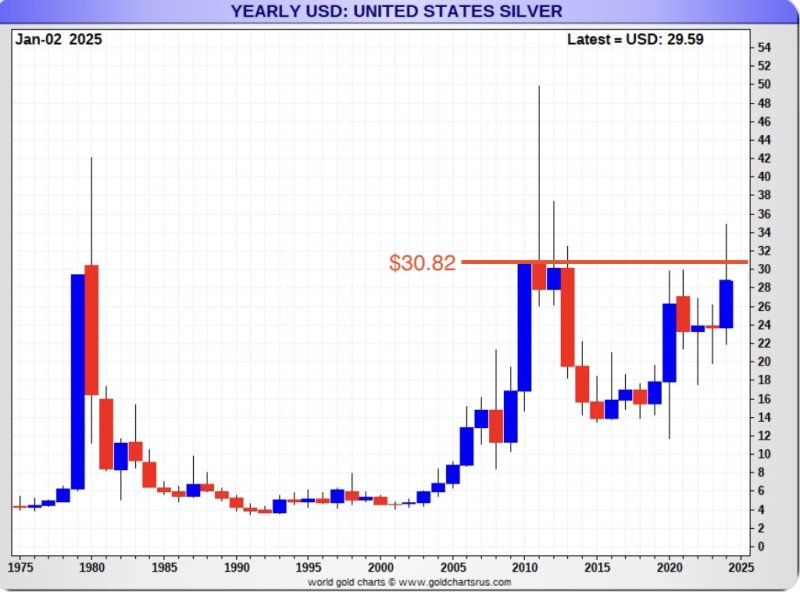
If the silver price had finished 2024 at a new annual closing high, similar to gold in 2023, I'd have been all in for a major rally in 2025. I'd have expected that rally to grow, strengthen and persist all the way to the end of the year. And it still might. Recall all of those possible macro indicators. However, the failure to end 2024 above $31 is concerning, as was the immediate and sharp pullback from the $35 level back in October.
I'm not saying that silver won't rally. It most assuredly will! But my concern is that we'll finish the year 2025 well off the earlier highs...sort of like 2011, 2020 and 2024. An intrayear rally north of $40 is possible, even likely, but what happens after that? Will the Bullion Banks reassert their dominance and drive price backward as they attempt to manage their short position and assuage their losses? As a reminder, silver is the most heavily Bank-shorted commodity on the planet!
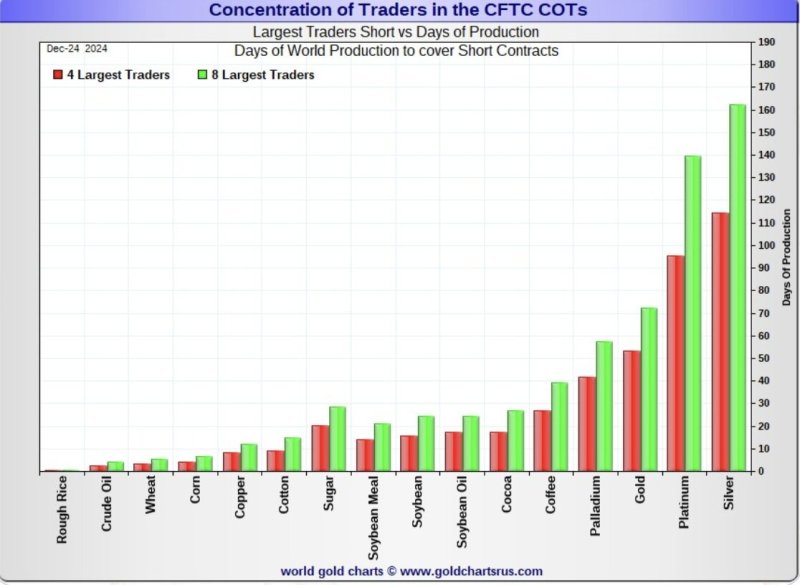
Had the silver price finished 2024 with a new annual high, I'd have been optimistic that a surge in hedge fund, home office and institutional demand might have finally led to the short-crushing rally we've all been expecting for what seems like an eternity. Unfortunately, that optimism must be tempered by the pullback we saw in November and December. I'm not saying it can't happen in 2025, I'm just less optimistic that it will happen in 2025.
So what do I expect for 2025? A solid year for silver. Maybe a great year. But new all-time highs and a break of the Bullion Bank stranglehold? Probably not quite yet.
On the 2024 chart below, you can see that the silver price has moved forward in a series of higher highs and higher lows, in the typical rally-and-pullback structure seen in bull markets. If this pattern continues as I expect, then we're likely to see another move higher in 2025 with the next top near $38.
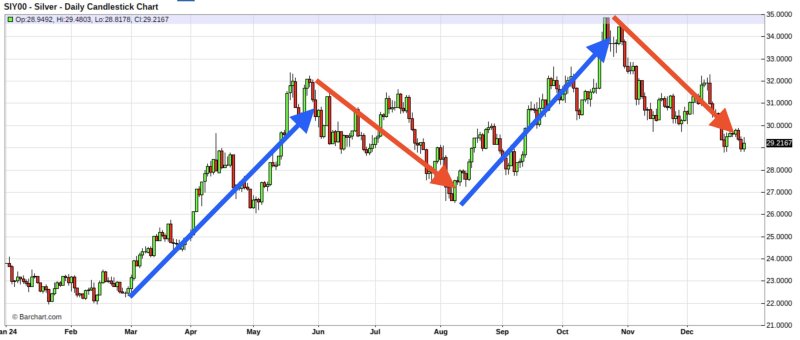
From there, prices should continue higher and into the $40s as the dollar index weakens and Fed policy shifts. But I'm not sure that's where silver will finish 2025. Instead, I'm going with a 2025 closing price of $37, which would mark an annual gain of about 25-30% with new all-time highs postponed to 2026.
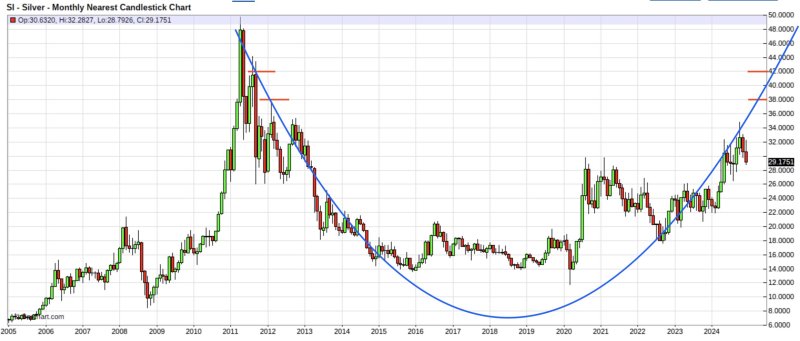
Finally, let's turn to the mining shares. I'd rather not, actually, but I feel as if we must. The year 2024 left many mining investors frustrated as ETFs lagged the metals and the exploration stocks mostly performed as we've come to expect from an under-invested, heavily-shorted and capital-destroying sector. But there's a valuable lesson to be learned from 2024 and it's something we should all consider.
The biggest mistake that I see investors make is simple. New to the sector or unwilling to spend the time to learn what it takes for mining companies to turn a profit, many investors (including investing legends like Stanley Druckenmiller) only buy the ETFs or the major names with which they are familiar. But this is a losing strategy, made clear again over the past year for everyone to see.
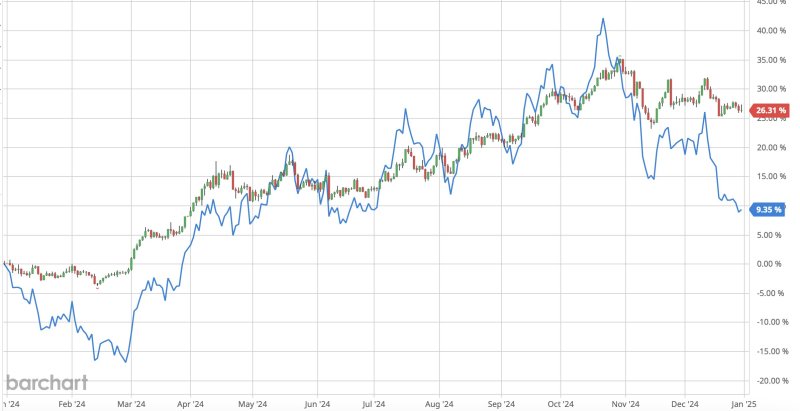
Below is a chart of the gold price in candlesticks. Also displayed as a blue line is the price of the biggest mining share ETF, the GDX. That's some pretty brutal underperformance by the GDX as gold rose 26% on the year but the GDX was up just 9%. Clearly, a strategy of just buying an ETF for "diversification" is a losing proposition.
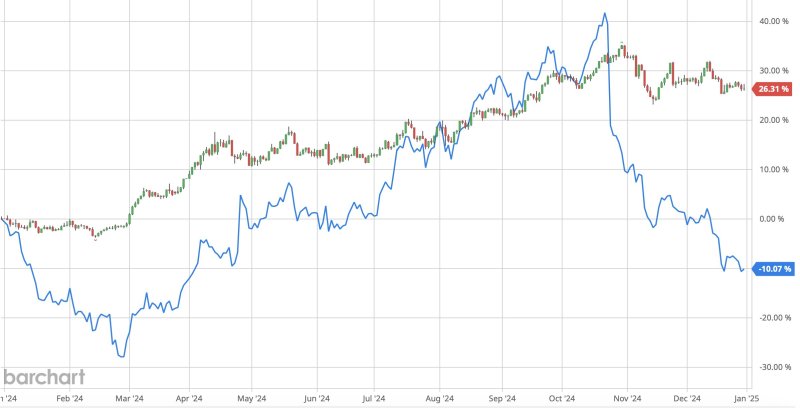
Rather than doing some homework, investors like Druckenmiller also like to buy Newmont, the largest gold miner by volume. But that strategy failed, too, as shares in Newmont were actually DOWN 10% on the year. Yes, you read that right. Gold was up 26% yet the shares of the largest gold miner fell by 10%. That's incredible!
And it wasn't just Newmont. Many folks also own Barrick and it managed a massive underperformance versus physical gold, too!In fact, Barrick was even worse than Newmont, finishing 2024 down over 14%.No wonder so many mining share investors finished 2024 in a gloomy mood!
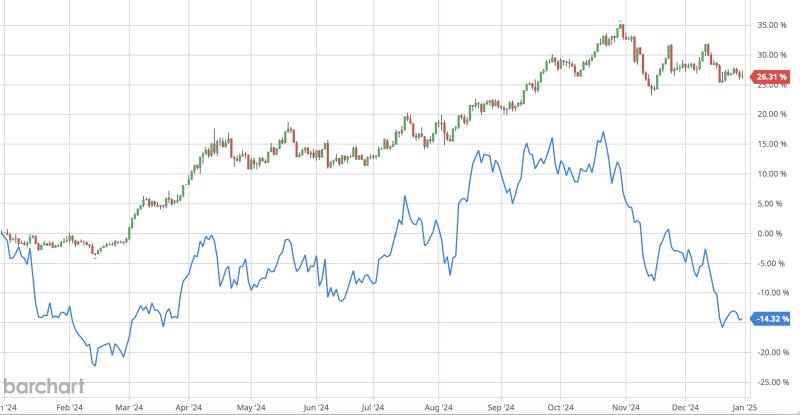 Bringing this full circle...It's now pretty easy to see why the GDX would underperform gold when two of its top three holdings...making up nearly 20% of the portfolio...posted terrible, negative years!
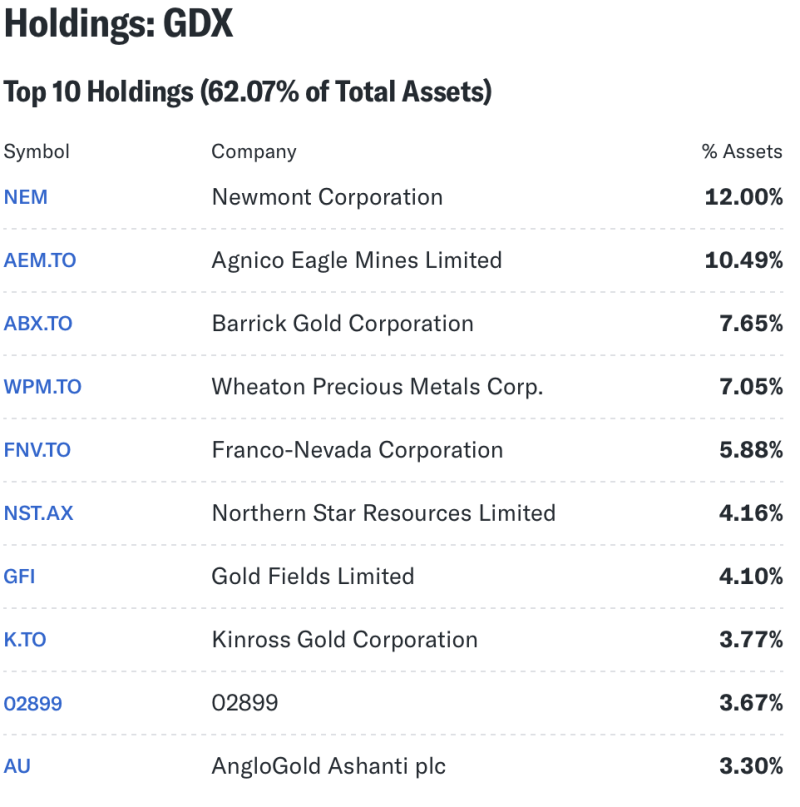
What causes big companies like Newmont and Barrick to post such miserable returns? It's simple. They can't control their costs. As such, their expenses rose just as quickly as the gold price, leaving their margins unchanged or lower, and their share prices fell in response.
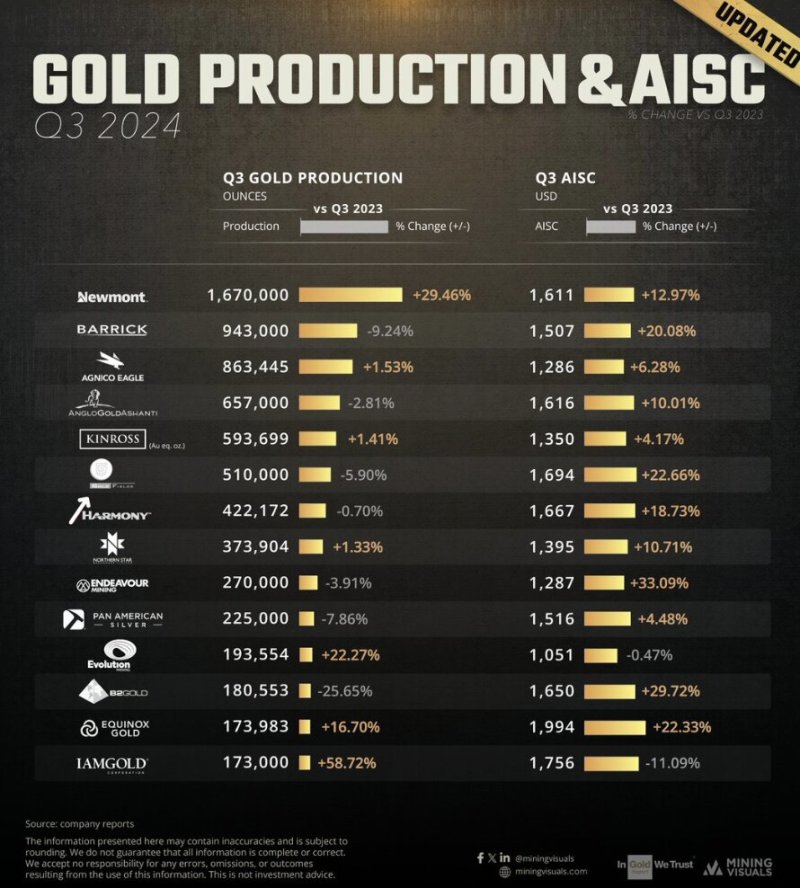 Now look real closely at that chart above. Do you see how Barrick's All-in-Sustaining-Costs (AISC) rose by more than 20% to$1507/ounce in Q3 2024? Do you see how Newmont's rose by 13% to$1611? That's bad. But look down the list. Do you also see Agnico-Eagle at just +6% and$1286? How about Kinross at +4% and $1350 AISC? Do you think that makes a difference? Check the charts below! The first is Agnico-Eagle, which outperformed gold in 2024 by about 50%. The second is Kinross, which saw the gain of its shares more than double the gains of gold!
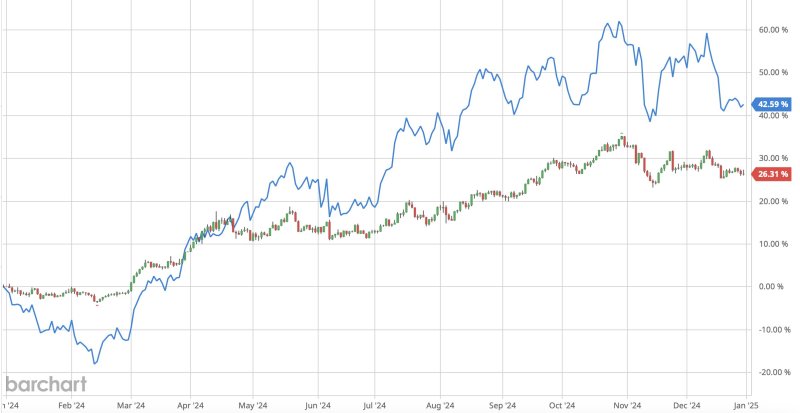
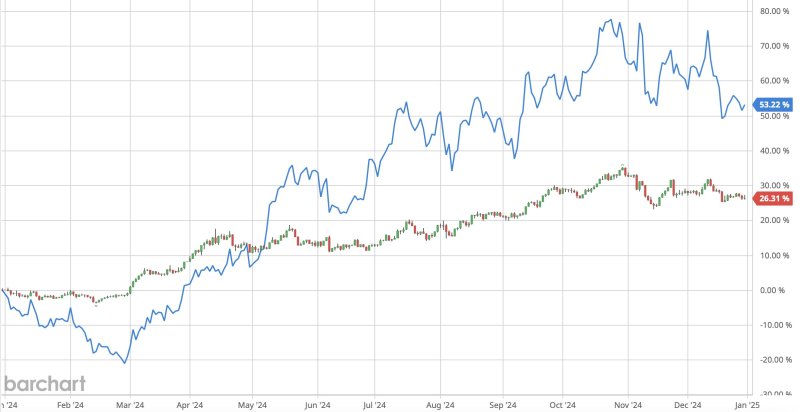 My point here is simple. If you're going to invest in the mining sector in 2025, you must be selective and do some homework! Simply buying an ETF or a name you recognize will not be a winning strategy. Instead, look for producing companies with responsible management that is effective at keeping AISCs low and widening profit margins.
Agnico-Eagle and Kinross were able to do that in 2024 and their shareholders were able to benefit. Find the companies that will follow this model in 2025 and you are likely to benefit, too.
In past years, I've posted a long-term chart of the GDX and tried to discern how high it might trade in the coming months. I'm not going to do that this year. And why would I when 20% of the portfolio is almost certain to lag the gold price? Instead, if you believe as I do that gold and silver prices are headed higher in 2025, then you can probably generate some fiat profits in the mining sector. How much profits?
Well, that solely depends upon the amount of work you want to put in. So long as proxies such as the GDX persist in heavily weighting dogs like NEM and GOLD, then the lines that I draw upon a chart are of little consequence.
And now finally, mercifully, we've come to the end of this year's macrocast. If you've made it this far, you deserve some sort of medal. In fact, your persistence and patience mean that you should seriously consider joining us at TFMR. Not only do I provide analysis and podcasts every day, the global community of TFMR members makes our site a safe harbor in the economic and political tempest. In times like these, we all need someplace where we can freely discuss issues and share information. At about 50¢/day, TFMR access is money well spent. More information on monthly and annual subscriptions can be found here:
In conclusion, I expect another solid year for the precious metals in 2025 but the key to unlocking significant gains will be Fed policy, additional easing and rate cuts. And the key to all of that will be a weakening U.S. economy, foreshadowed at present by the return of a positively-sloping yield curve...the inversion reversion. In short, if I'm correct about the U.S. economy in 2025, then the price projections mentioned in this macrocast should be easily realized in the months ahead.
Thank you for taking the time to read this post and I hope to see you at TFMR in 2025.
CEH


