The big US stocks dominating markets and investors’ portfolios are booming. They just finished reporting great Q3 results, with sales and profits generally surging. But serious challenges loom, led by slowing consumer spending and soaring interest rates. The stock markets have already started rolling over again, with extreme bubble-level valuations exaggerating downside risks. So prudent investors are diversifying.
The mighty flagship S&P 500 stock index has surged higher in 2023, up a strong 14.1% year-to-date. So bullishness, enthusiasm, and greed are running high. Speculators and investors have flooded into big US stocks, fueling outsized gains. From mid-October 2022 to late July 2023, the SPX blasted up 28.3% in a new bull market climaxing in the artificial-intelligence bubble. But overall technicals are still bearish-tinged.
That latest bull was really an oversold bear-market rally supercharged by AI hype. Leading into its birth, the SPX had fallen a major 25.4% from just January to October 2022. So a mean-reversion rebound was due, and that didn’t extend to +20% new-bull status until early June 2023. That was when traders were captivated with the potential of generative AI. Particularly ChatGPT, which initially seemed like pure wizardry.
But these large language models are just looking for patterns in text and spitting out conforming prose. They sure aren’t intelligent or sentient, having zero understanding of their queries or results. So traders soon realized their current state was far from ready for prime time. These AIs are essentially bullshitting machines, prone to what this industry calls “hallucinations”. Those are well-written but nonsensical answers.
So the bloom soon fell off the AI rose, and the SPX rolled over again. By late October it forged into formal correction territory down 10.3% since late July’s AI-bubble peak. And even that was anemic, still 4.3% under early January 2022’s all-time-record high. So the US stock markets still remain in a bearish downtrend since then. Had that AI craze not stoked such greed, that latest bull would’ve stayed a bear rally.
And with the SPX carving lower highs and lower lows on balance during the several months since, that AI bubble has popped. But it peaking in Q3 made that a great quarter for big US stocks. That surging SPX unleashed widespread euphoria, fueling strong consumer spending driving up corporate results. That was a stark contrast to the year-earlier comparable quarter, when the SPX’s deepening bear retarded spending.
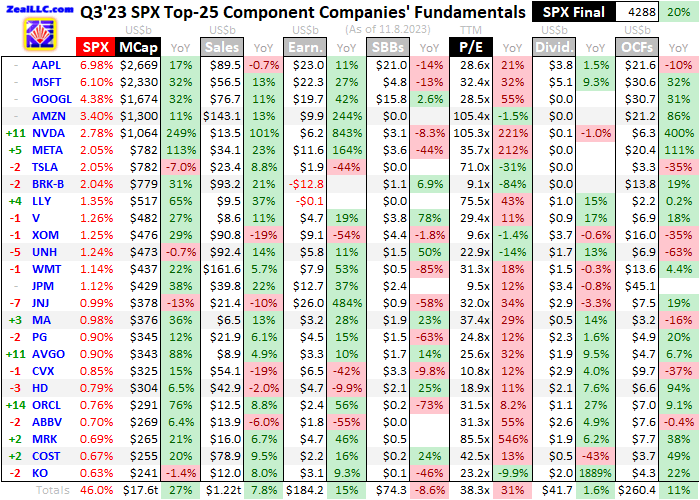
As always big US stocks’ latest Q3’23 results are important for gaming the stock markets’ likely direction in coming months. For 25 quarters in a row now, I’ve analyzed how the 25 largest US companies that dominate the SPX fared in their latest earnings seasons. These behemoths commanded a stunning record 46.0% of the SPX’s total market cap exiting Q3! Their latest-reported key results are detailed in this table.
Each big US company’s stock symbol is preceded by its ranking change within the S&P 500 over the past year since the end of Q3’22. These symbols are followed by their stocks’ Q3’23 quarter-end weightings in the SPX, along with their enormous market capitalizations then. Market caps’ year-over-year changes are shown, revealing how those stocks performed for investors independent of manipulative stock buybacks.
Those have been off the charts for years, fueled by the Fed’s previous zero-interest-rate policy and trillions of dollars of bond monetizations. Stock buybacks are deceptive financial engineering undertaken to artificially boost stock prices and earnings per share, maximizing executives’ huge compensation. Looking at market-cap changes rather than stock-price ones neutralizes some of stock buybacks’ distorting effects.
Next comes each of these big US stocks’ quarterly revenues, hard earnings under Generally Accepted Accounting Principles, stock buybacks, trailing-twelve-month price-to-earnings ratios, dividends paid, and operating cash flows generated in Q3’23 followed by their year-over-year changes. Fields are left blank if companies hadn’t reported that particular data as of mid-week, or if it doesn’t exist like negative P/E ratios.
Percentage changes are excluded if they aren’t meaningful, primarily when data shifted from positive to negative or vice-versa. These latest quarterly results are very important for American stock investors, including anyone with retirement accounts, to understand. They illuminate whether US stock markets are fundamentally sound enough to resume powering higher in coming months, or whether this correction will grow.
The concentration of capital in these dominant US companies is shocking, again commanding 46.0% of the entire S&P 500’s colossal market capitalization! When I started this research thread six years ago, the SPX top 25 represented a more-reasonable 34.8% of this entire index. And over this past year, the most-beloved mega-cap-tech market darlings at the very top have come to be called the Magnificent Seven.
They are the usual suspects Apple, Microsoft, Alphabet, Amazon, NVIDIA, Meta, and Tesla. All have proven amazing businesses, so it’s not surprising investors flock to them. But exiting Q3, this handful of behemoths alone was responsible for fully 27.7% of the entire SPX’s market cap! With such vast money deployed in so few stocks, market concentration risks are off the charts. If the M7 sneeze, markets catch a cold.
But despite their monstrous sizes, the M7’s Q3 results proved phenomenal! These mega-cap techs are firing on all cylinders, still collectively growing fast even from already-gargantuan bases. It is no wonder investors are so enamored with these dominant companies, they are still delivering market-leading results. Even as a hardened contrarian I’m blown away by what the M7 reported last quarter, it was exceptional.
These best-of-the-best SPX-top-7 stocks reported Q3’23 revenues of $436.8b, which soared 11.3% YoY! Double-digit sales growth at the epic scales these giants operate should be impossible, yet they pulled it off. That trounced the 5.9% YoY revenue growth to $784.7b of the next 18 biggest US companies that rounded out the SPX top 25. Both Apple and NVIDIA were particularly noteworthy on the sales front.
While still colossal, mighty Apple’s Q3 revenues actually slipped 0.7% YoY. That isn’t much, but it was the fourth consecutive quarter of annual top-line declines. That is this company’s worst streak of slowing sales since 2001, long before the iPhone era! Americans love these devices, and will sacrifice much to carry newer models in their pockets. They’ve become the main or only computers used by most people.
Apple’s iPhone sales account for about half its revenues, and those still grew 2.8% YoY in Q3. Overall revenues slumped because of much-weaker Mac and iPad demand. I can’t help but think iPhones are a bellwether for broader consumer health. As Americans struggle with way-higher necessities prices from raging inflation, and far-higher interest rates from the Fed fighting it, they will have to pull in their horns.
Apple’s fiscal years end in Q3s, and in this latest one annual iPhone sales actually slipped 2.4% YoY to $200.6b. But that decline could steepen considerably if people are forced to delay their upgrade cycles, keeping their existing iPhones longer. With AAPL commanding an epic 7.0% of the SPX’s market cap, slowing iPhone sales are a real risk for stock markets. Q4’s will be telling with the latest iPhone 15 launch.
NVIDIA is the poster child of the AI bubble, long producing computer-gaming graphics chips that are also great for AI’s massive parallel processing. NVDA’s quarters end a month after calendar ones, so these latest results are current to the end of July as that AI mania peaked. Astoundingly NVIDIA’s revenues skyrocketed 101.5% YoY to $13.5b! That catapulted its earnings a stupendous 843.3% higher to $6.2b!
With such stellar results, it is understandable NVDA’s stock price shot stratospheric up 249.4% between the ends of Q3’22 to Q3’23. No other SPX-top-25 stock came close to matching NVIDIA’s colossal upside. But are these extreme AI-mania sales levels sustainable? Will AI companies keep scrambling to stockpile the latest NVIDIA processors as their investment capital inflows wane? Odds are they won’t be able to.
When NVIDIA reported those blowout results in late August, it also guided to $16.0b in sales in Q4 which smashed Wall Street estimates of $12.5b! Long-time professional analysts marveled at what they called the best quarterly report in history. Yet NVDA stock still topped right then and has ground lower since. If this company warns on slowing sales, it could really taint broader market psychology spawning wider selloffs.
Partially thanks to those incredible Magnificent Seven revenues, overall SPX-top-25 sales grew a strong 7.8% YoY in Q3 to a record $1,221.5b. But one big composition change really distorted this. Over the past year, beloved warehouse retailer Costco replaced Pepsi as the 24th-largest US stock. Everyone I know who shops at Costco including me raves about its high-quality food sold at the lowest prices anywhere.
Costco’s margins are razor-thin to pass along bulk-buying savings to customers, with membership fees accounting for fully 70% of its Q3 earnings! COST’s sales are about 3.5x bigger than PEP’s. If Costco is included in the year-ago comparable quarter instead of Pepsi, SPX-top-25 sales growth is slashed to 3.2% YoY. And for the next-18-biggest US companies under the M7, total revenues actually slump 0.8% YoY!
These elite US stocks’ Q3 earnings were also distorted, for two different reasons. Overall the SPX top 25’s accounting profits surged an impressive 14.7% YoY to $184.2b. The M7 mega-cap techs dominated that, with their earnings skyrocketing an astounding 49.0% YoY to $94.4b! While extraordinary, there’s no way such epic profits growth can persist at such vast operating scales. That has to greatly moderate.
But the next-18-biggest SPX stocks saw earnings drop a considerable 7.7% YoY to $89.8b last quarter. That sounds ominous economically, but it partially resulted from huge unrealized investment gains and losses that Warren Buffett’s Berkshire Hathaway has to flush through its income statements each quarter. In Q3’23 for example, BRK reported $29.8b of investment losses that crushed earnings to an ugly $12.8b loss!
Yet year-to-date as of Q3’23, BRK still has $38.0b of investment gains boosting net income to $58.6b. If Berkshire’s crazy-volatile investment losses are backed out of both Q3’22 and Q3’23, overall profits at the next-18-biggest US stocks actually climbed a good 8.1% YoY to $119.5b. But that was greatly boosted by another unusual item, Johnson & Johnson’s ongoing spinoff of its consumer-health businesses in Kenvue.
Related to divesting those assets, in Q3 JNJ reported an enormous non-cash gain of $21.0b that was run through net income! Pull out that one-time windfall, and the next-18-biggest US stocks’ Q3 profits actually plunged 10.9% YoY to $98.6b! That also guts the overall SPX top 25’s earnings enough to drag them to a mere 1.6% YoY increase even including mega-cap techs’ awesome results, so cracks are starting to show.
Q3 could very well prove the high-water mark for consumer spending, which drives corporate profits, for a long time to come. The Fed reported that Americans’ epic $2,100b of excess savings from pandemic stimulus payments were finally exhausted in Q3. And the 3.5-year pandemic moratorium on student-loan payments also ended in September. So about 1/6th of Americans will now have to pay around $390 per month.
That combined with those inflation-ballooned necessities prices and punishing interest rates will have to increasingly erode Americans’ spending. As they buy less goods and services from these elite SPX-top-25 companies, their revenues and earnings will come under increasing pressure. It seems like they know a slowdown is looming, as they cut their massive corporate stock buybacks despite the SPX surging into Q3.
Overall buybacks dipped 8.6% YoY to $74.3b last quarter, led by the cash-rich Magnificent Seven’s falling a steeper 12.4% to $48.3b. Despite much-better earnings, Apple, Microsoft, NVIDIA, and Meta all slashed their buybacks substantially. Why? The M7’s overall cash hoard still soared 20.1% YoY to an astounding $492.8b! Their operating cash flows rocketed up 36.6% YoY to $134.1b, they are rolling in money.
Overall the SPX top 25’s stock buybacks have now fallen for six consecutive quarters, averaging hefty 15.5% YoY declines! That’s quite a trend, contrary to their normal behavior of using their cash flows to bid up share prices while artificially boosting earnings per share. There has to be some reason why these elite companies are slowing this core strategy. They likely fear economic weakness or see lower stock markets.
While the biggest US stocks’ Q3 results were spectacular, their bubble valuations remain a serious threat. Exiting last quarter, the SPX top 25 averaged trailing-twelve-month price-to-earnings ratios running way up at 38.3x! That is far higher than the 28x bubble threshold, which in turn is double the century-and-a-half fair-value average of 14x. These stock markets remain exceedingly expensive, even dangerously so.
Those valuations soared 31.1% YoY, exceeding the SPX top 25’s collective 27.0% market-cap gain! That means the SPX’s rally has been largely driven by multiple expansion, paying more for underlying profits. The M7 mega-cap techs are even more extreme, averaging shocking valuations way up at 58.1x earnings! So these stock markets are crazily-overvalued, greatly upping the odds another bear is getting underway.
Alphabet and Apple were the cheapest M7 stocks at the end of Q3, but still traded at 28.5x and 28.6x which is high historically for both. The most expensive were Amazon and NVIDIA at a whopping 105.4x and 105.3x. That means at current earnings levels, investors would have to wait 105 years for these companies to earn back their lofty stock prices! Historically bubble valuations have heralded secular bears.
Those fearsome beasts exist to maul stock prices sideways to lower long enough for underlying earnings to catch up with stock prices. Great valuation waves meander through market history, with overvalued markets after bulls yielding to undervalued ones after bears. At 38.3x earnings, a valuation-wave mean reversion much lower in coming years is highly probable. That would guarantee much-lower stock prices.
And increasingly-tapped-out American consumers really exacerbate stock markets’ inevitable downside. As they tighten their belts and become more selective with their spending, corporate sales will weaken. The resulting earnings drops will be much bigger, amplifying the revenue declines. And lower profits force valuations even higher, demanding bigger mean-reversion selloffs to normalize stock prices with earnings.
Eventually stock prices must reflect some reasonable multiple of underlying corporate earnings. It may be that historical 14x, or perhaps higher now near 21x. But either way, fair value is far lower than 38x. The prices investors pay for stocks, the valuations at which they buy, are the biggest driver of their long-term returns. So with today’s extreme bubble valuations, investors need to stay wary of a major bear.
The SPX top 25’s total dividends paid last quarter climbed a normal 1.6% YoY to $41.7b. Yet average dividend yields on these lofty stock prices collapsed 16.7% YoY to just 1.6%. In past years when the Fed was running zero-interest-rate policies, low dividend yields were all investors could get. But today 1-year Treasury yields are running 5.4% thanks to the Fed’s monster rate hikes, dwarfing big US stocks’ yields!
Investors looking for income in big US stocks aren’t earning much, and are facing major downside risks with valuations so extreme. Meanwhile risk-free short-term Treasuries are yielding 3.4x more with capital return guaranteed! So diversifying into bonds makes a lot of sense with dividend yields lagging terribly. That’s another major reason stock prices need to mean revert much lower, to normalize terrible dividend yields.
Not surprisingly with strong revenues and earnings last quarter, the SPX top 25’s operating cash flows were also robust growing 11.4% YoY to $260.4b. But again that was skewed by the M7 mega-cap techs’ incredible 36.6% YoY growth! The next-18-biggest US companies actually saw their OCFs collapse by 15.1% YoY. That excludes mega-bank JPMorgan Chase, which always has wildly-volatile huge OCF swings.
Those big OCFs for the SPX top 25 boosted their collective treasuries a similar 11.0% YoY to $909.2b. Yet the M7 sported huge 20.1% growth, while the rest of the biggest US stocks’ cash hoards only edged up 1.8%. So the enormous bifurcation between mega-cap techs and the rest of leading stocks remains in force. Sooner or later that gaping disconnect has to narrow, with another bear market the most-likely driver.
Ironically because of the Magnificent Seven’s amazing businesses, investors consider their stocks to be safe. But that’s not true during stock bears, the mega-cap techs lead the markets both on the way up and down. Again the SPX’s last bear mauled it 25.4% lower over 9.3 months from January to October 2022. During that exact span, AAPL, MSFT, GOOGL, AMZN, NVDA, META, and TSLA stocks fared much worse.
They averaged ugly 41.8% losses while that bear prowled, and actually fared much worse from their own peaks to troughs. Between October 2021 to December 2022 surrounding that bear, at worst these elite M7 stocks dropped 30.8%, 37.6%, 44.3%, 55.7%, 66.4%, 74.4%, and 73.4%! That made for dismal 54.6% average losses, more than double that 25.4% SPX bear! M7 market darlings offer no refuge in bears.
Investors with stock-heavy portfolios really ought to diversify into gold, which tends to outperform when stock markets weaken. During that last SPX bear gold still slumped 7.1%, but only because the US dollar skyrocketed parabolic on unprecedented monster Fed rate hikes. Since that ended, gold powered up 26.3% at best in a strong new upleg. Yet the SPX’s parallel bear-market rally only climbed 11.1% in that span.
Successful trading demands always staying informed on markets, to understand opportunities as they arise. We can help! For decades we’ve published popular weekly and monthly newsletters focused on contrarian speculation and investment. They draw on my vast experience, knowledge, wisdom, and ongoing research to explain what’s going on in the markets, why, and how to trade them with specific stocks.
Our holistic integrated contrarian approach has proven very successful, and you can reap the benefits for only $10 an issue. We extensively research gold and silver miners to find cheap fundamentally-superior mid-tiers and juniors with outsized upside potential. Sign up for free e-mail notifications when we publish new content. Even better, subscribe today to our acclaimed newsletters and start growing smarter and richer!
The bottom line is big US stocks just reported great Q3 results, with revenues, earnings, and operating cash flows enjoying strong growth. Business boomed as the AI bubble peaked, heavily weighted to the Magnificent Seven mega-cap techs increasingly dominating stock markets. But these gigantic companies can’t enjoy double-digit sales growth forever at the vast scales they operate, and their valuations remain extreme.
Deep into dangerous bubble territory, a mean reversion is still long overdue. That requires a bear to maul down stock prices long enough for corporate earnings to catch up. Tapped-out Americans slowing their spending could soon awaken and feed that beast. Pulling in their horns threatens really eroding sales and crushing profits, forcing lofty valuations even higher. Facing big downside risks, investors need to diversify.
About the author