
Two weeks ago, we wrote a post that warned against a pending drop in the stock market. Two weeks later, it's probably a good idea to update that theme.
The post from two weeks ago mainly focused upon remarks from Fed Goons Dudley and Bullard, and it followed a sort of "don't fight the Fed" narrative. To wit, if the Fed is intent upon "inflicting more losses upon stock market investors", you might want to take that into your investment considerations. Here's the link:
In the two weeks since, the U.S. stock market, as measured by the S&P 500, has begun to roll over. So today let's assess where it may go from here, what impact this may have on future Fed policy and, by extension, precious metal prices.
The most analogous period to the present is Q4 2018. Back then, the Fed was also on a course of higher interest rates and balance sheet reduction. The consensus of Wall Street economists was an expectation of 4-5 additional fed funds rates hikes in 2019 with the yield in the ten-year note moving toward 5% in the months ahead.
This was all well and good...until it wasn't. And what drove the "Powell Pivot" in December of 2018? A 20% drop in the stock market. To stave off further collapse, hiking plans were quickly changed. The Fed soon moved toward easing instead, and by June of 2019, they actually began to CUT the fed funds rate and interest rates across the board fell in tandem.
I have no doubt that "Powell Pivot 2" is coming. Of that you can be certain. However, and as former Goon Dudley suggested, the Fed is looking to "inflict more losses" before they change course. So, how will this play out? The charts hold the clues.
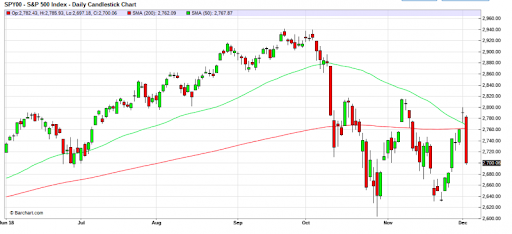
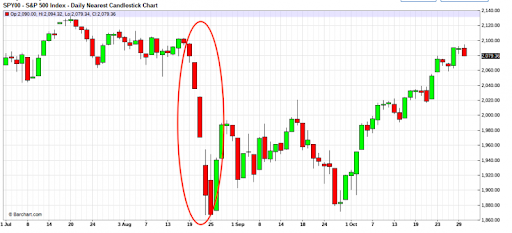
Below is a chart of the S&P 500 from June 1, 2018, through December 4, 2018. Be sure to notice a few things that you'll see again on the present day chart we'll review later in this post:
- The gradual incline and bullish move above the key moving averages through September
- The initial 10% drop that presented a warning signal
- The floor of support above 2600
- The technical breakdown in early December
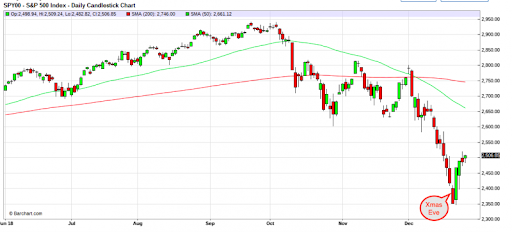
What happened next shook the Fed to its core. It led to an emergency Christmas Eve meeting of The President's Working Group on Financial Markets and the Powell Pivot. And what was the event that drove all of this? Once that 2600 floor was broken, the S&P quickly fell another 10%.
So now here we are in 2022. Again the Fed is promising to hike the fed funds rate as high as 3%, and Wall Street economists expect longer rates to continue surging higher as well. But the stock market is once again staggering under the loss of liquidity and rate hike expectations. So now take a look at the current chart. It's not a precise mirror image of late 2018...but it's pretty close!
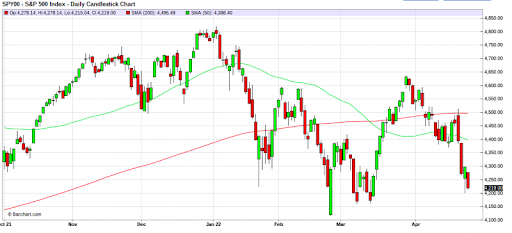
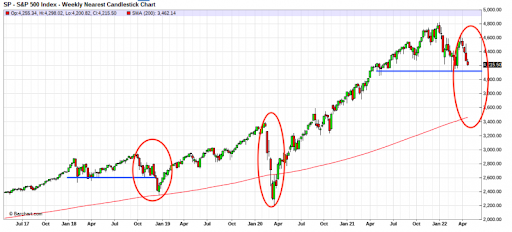
Once again, back in 2018 the break of support near 2600 led to a drop to 2300 or about 10%. A similar situation is likely in 2022, where a break of support near 4100 would lead to a targeting of 3800 at a minimum...but maybe even 3500! Why? As mentioned in that post two weeks ago, the last two selloffs in the S&P (late 2018 included) led to a drop to the 200-week moving average. The chart below provides all the further explanation you need.
What might trigger this type of drop in stonks? Continued higher interest rates and loss of liquidity will do it. But there are plenty of other reasons, too. The economic impact of the war in Ukraine, of course, but here's something that should be on your radar, too. Have you seen the recent plunge in the Japanese yen? This is some pretty historic stuff, as the Bank of Japan is forced to defend their Yield Curve Control policy and, in doing so, is killing their currency.
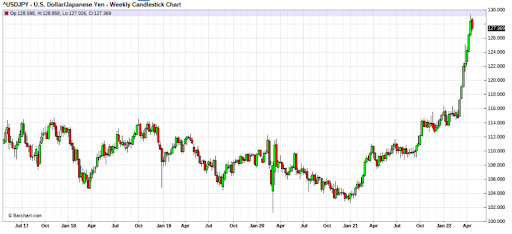
This weakness in the yen is putting extreme pressure on the Chinese yuan. With little room remaining to cut rates, the People's Bank of China may be left with no other option but to devalue the yuan versus the dollar. They've done this before, most recently in August of 2015. And what was the impact on the S&P after this occurred? See below.
So now let's bring this back to the precious metals and attempt to explain why this should matter to you as a gold investor. If stonks do crash and if the Fed responds by altering course, the gold price is likely to sniff it out first. Again, the analogy is to 2018.
Below is a chart of just Q4 2018. What you see plotted is COMEX gold in candlesticks and the S&P 500 as a blue line. Be sure to note that as soon as the S&P broke below 2600, COMEX gold began to rally. Some of this was likely a "safe haven" bid, but what you see here is also gold "sniffing out" that crashing stocks are soon going to force a Fed pivot.
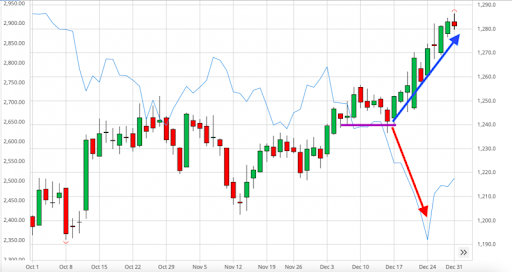
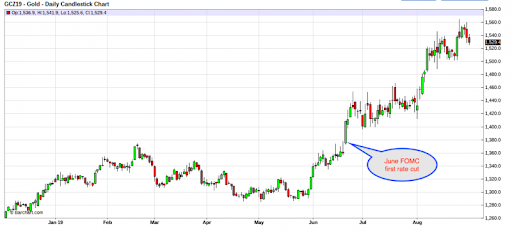
Next, as the Fed paused in early 2019 and then moved to their first fed funds cut in June of that year, check how COMEX gold performed. It was steady through the pause and then sharply higher as the cuts began.
Here's one last thing to consider and the reason for the urgency of this post. The May FOMC is one week away. The consensus view is that the Fed may hike the fed funds rate as much as 75 basis points at the conclusion of the meeting and that the general tone of the press release and Powell press conference will be "hawkish". And maybe it will.
However, as I type this on April 26, the S&P is falling again and currently stands at 4230. What if, later this week, support between 4100 and 4200 gives way and stonks begin to fall sharply into the meeting? How might that impact what the Fed will do and say? What if this leads the Fed to hike just 50 basis points and Powell's press conference is deemed "surprisingly dovish"? How might COMEX gold respond? After the beating they've taken, how might the mining shares?
The point is...the first signs of "Powell Pivot 2" may appear as soon as next week, but if not next week, the change back toward easing and QE is inevitable regardless. When this happens, COMEX gold, silver, and the mining shares are going to soar. So keep a close eye on the stonk market in the days ahead. Just as in 2018 and again in 2020, it will very likely hold the key to this eventual Fed policy reversal.
About the author


Our Ask The Expert interviewer Craig Hemke began his career in financial services in 1990 but retired in 2008 to focus on family and entrepreneurial opportunities. Since 2010, he has been the editor and publisher of the TF Metals Report found at TFMetalsReport.com, an online community for precious metal investors.