
Copper/Gold ratio teases cyclical inflation bulls and bears alike, but…
…it’s going to break one way or the other soon enough.
If you value gold’s standing in relation to industrial metals as a key market/financial/economic indicator as I do, then you view the ongoing consolidation in the copper price to the gold price as a key indicator (among several NFTRH tools) going forward.
I cannot make the macro do what I want it to do, but I sure can be super interested in an indicator that has made several false moves to the positive and negative sides in 2021 as we head into a year of changes to come (one way or another) in 2022. Cu/Au is making less and less volatile spikes and drops as it is currently pinched between the converging daily SMA 50 and 200.
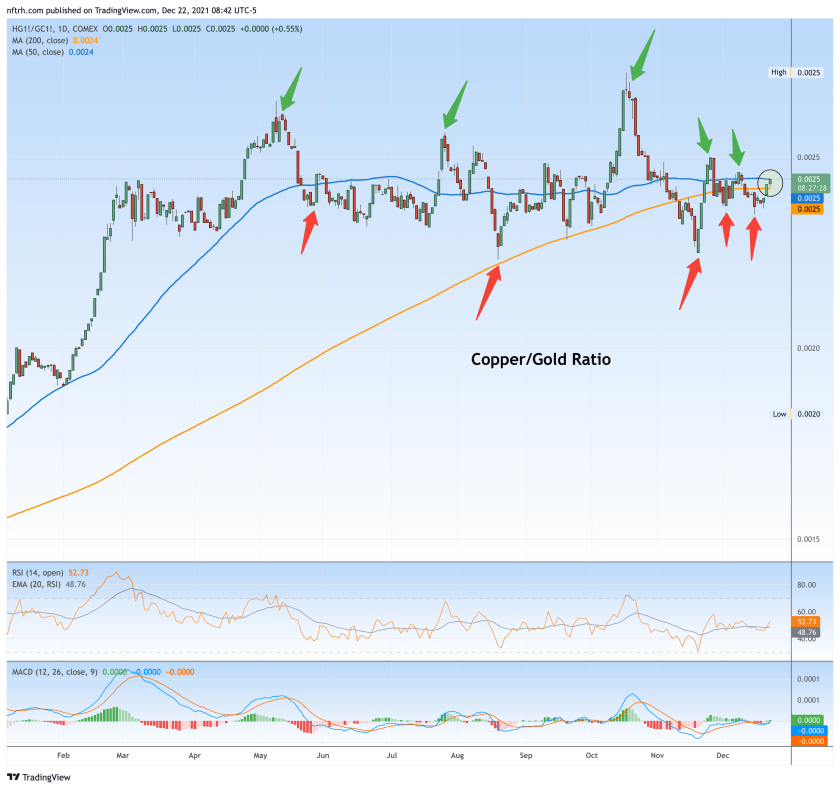
They call him Doctor Copper because in the post-2000 world of Inflation onDemand © :-) (as originally concocted by the Maestro himself, Alan Greenspan and expanded ever so maniacally by Ben Bernanke on through the current Fed regime), the cyclical economic doctor metal is a key foil to the counter-cyclical monetary historian metal.
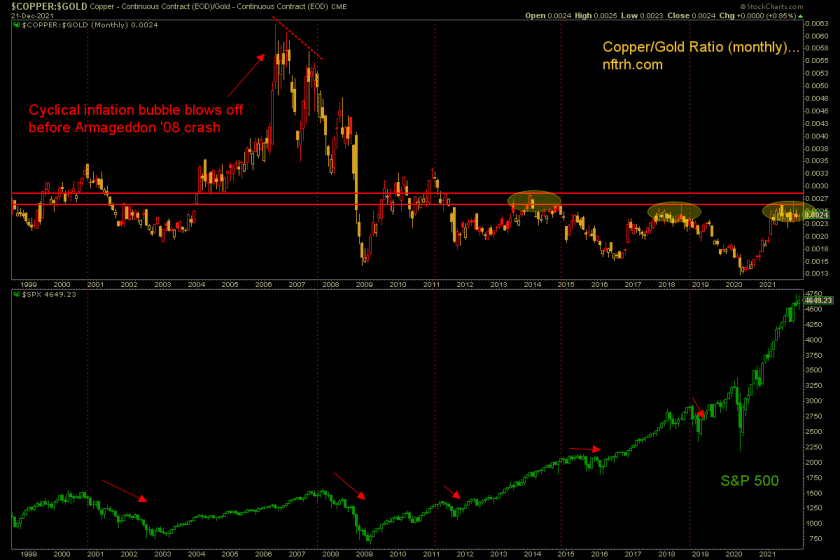
Thus far the Copper/Gold ratio is dwelling below a key area of delineation (between a new cyclical inflationary phase or a failure of the original one manufactured by the Fed during the 2020 COVID hysteria).
While of course commodities and ‘inflation trades’ in general hang in the balance at the decision point so too would the S&P 500. As shown on the long-term chart, a topping situation in Cu/Au (or most any other cyclical inflation indicator) spells a top of some kind of some kind for the broad stock market once the ratio breaks down to the point where the average market participant starts to notice that something’s rotten in Denmark (or we’re not in Kansas anymore, or any other old saying you may insert).
The current NFTRH stance is for a short-term seasonally firm phase with a distinct end point, at least when going by the quant of the average of 30 years of history. I am deployed into the markets with appropriate risk management and in alignment with the macro views of the moment. But dialing out to a bit bigger picture, as the moment rolls into a new phase we can anticipate inflationary (as in Stagflation) or disinflationary (as in deflation to the point where you’d see the supposedly hawkish Fed flip so hard it would make your head spin) clarity.
For “best of breed” top down analysis of all major markets, subscribe to NFTRH Premium, which includes an in-depth weekly market report, detailed market updates and NFTRH+ dynamic updates and chart/trade setup ideas. Subscribe by PayPal or credit card using a button on the right sidebar (if using a mobile device you may need to scroll down). Keep up to date with actionable public content at NFTRH.com by using the email form on the right sidebar. Follow via Twitter @NFTRHgt.
About the author
