
- The Flip Side of Inflation
- Components to Watch
- Something for Everyone
- Eavesdropping on Millionaires
- Dallas, Paris, and Europe
The market, and maybe all of us, would like to believe the latest 3% annual CPI number was a harbinger of ever-lower inflation, and we are on the road to 2% inflation by year end. I would argue, “Not so fast.” Inflation is far from dead, and CPI will likely go slightly up between now and the end of the year. The Fed has multiple problems we will examine over the next few weeks.
The genesis for this letter came from an analysis of future inflation by my friend Ed Easterling of Crestmont Research. It wasn’t that long, and so we talked about collaborating on a letter, which we have done many times in the past. He would undertake the first draft. Since we were looking at under 1,000 words (I thought), I asked my friend Barry Habib to demonstrate why home prices are biased to rise, complicating the Fed’s work fighting inflation. “Give me 300 words tops.” So on Friday morning here in Memphis, as I started to work on the letter, I got well over 4,500 words between the two of them. Both are important, so we’ll hear from Ed today and Barry next week.
Bottom line up front? Inflation is not dead, the Fed is facing a very difficult battle against inflation for the next six months, and the rehab cycle may not be over, with one very important caveat. We’ll get to that and more over the next two weeks, but this is important to understand what monetary policy is going to be for the next 6–9–12 months. It’s complicated, and it’s not what you think.
I will have a new book out that will be in the bookstores October 3. I know I have been promising a book, so I haven’t talked about this until it’s actually finished and in the final edits. I’ll write more in the personal section, but I need your help on one final thing. Thanks.
A little background on Ed. He ran a successful fund of hedge funds in Dallas for a very long time and then transitioned to become a tree farmer and now a cattle rancher in Oregon. He has been named his county and state Tree Farmer of the Year and nationally ranked as Western Regional Tree Farmer of the Year, all while maintaining his incredible website with some of the best big-picture macroeconomic charts and graphs you’ll find anywhere.
The following discussion is based on the analysis “Inflation: Not Done Yet?” posted on CrestmontResearch.com. Any mistakes or faulty thinking are solely the responsibility of John Mauldin for interrupting Ed (Full disclosure: Ed wrote most of this.)
|
Page 12 of today's newspaper can quickly become tomorrow’s trending theme. Putting readers ahead of those shifts is exactly what Over My Shoulder seeks to do. Click for details on how to get on the mailing list for John Mauldin's weekly insights. Monthly subscriptions available. |
The Flip Side of Inflation
By John Mauldin and Ed Easterling
So here we are… Fifteen years ago, the Fed initiated a pair of aggressive monetary policies they have repeated multiple times since. There’s no need to rehash whether the Fed should have or shouldn’t have used ZIRP and QE medicine when they did. Instead, the focus now should be anticipating the environment ahead.
We’re now experiencing the consequences on the other side of the coin. There was always going to be a tradeoff period; ZIRP and QE distorted markets and led to malinvestments. In the Fed’s opinion, the monetary policy duo may have been necessary at the time. But, as they say, the chickens have come home to roost.
Interest rates are a knob for the Fed. But rate changes operate with a variable lag, and they leave land mines along the way. These uncertain breaking points represent the final grain of sand that causes part or all of the pile to slide.
We’ve already seen early signs of ZIRP’s consequences. Rising rates took out a pair of large banks with mismanaged portfolios. The Fed’s moral hazard response to cover depositors stopped the slide, but similar vulnerabilities may remain. Further, the Fed may have added other vulnerabilities by using the Damocles Sword of moral hazard.
Fast forward to the past few weeks. Fed Chair Jerome Powell intentionally avoided words like “pause” or “skip” when he said the Fed would “make our decisions meeting by meeting, based on the totality of incoming data.” No wonder he’s careful with his words. “Transitory” didn’t age well.
The underlying inflation data reflects a slight downward trend, partly due to the structure of the data; however, the same structural element will also influence the upcoming inflation data to the upside.
The Fed doesn’t operate behind the scenes. It is watched and second-guessed from all sides. With a 24-hour news cycle and several analyst cycles in between, each month’s inflation report seems to come in slow motion. Rising inflation can feel like torture to monetary decision-makers wishing for better results. The rest of 2023 may challenge the patience of even the most ardent inflation fighters.
June’s Consumer Price Index (CPI) was released this week. Inflation is now running at 3.0%. It continued this year’s underlying trend of lower inflation. Hurrah! But mid-year is likely to be the inflection point toward higher inflation reports into year-end. This call is far from certain, yet recent history significantly drives the future.
CPI inflation is reported year-over-year as an annual percentage increase or decrease. Thus, the annual inflation rate for each month is the percentage increase of this month’s CPI Index over the CPI Index for the same month last year. As a result, the index value last year is just as important as the value for this year.
Figure 1
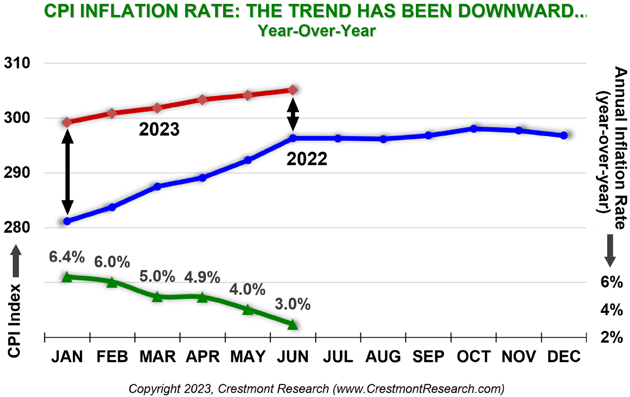
Source: Crestmont Research
The blue line in Figure 1 reflects the index value for each month of 2022. The solid red line reflects the six reports thus far in 2023 (through June 2023). As the gap between the lines narrowed over the past six months, the rate of increase narrowed (i.e., decreased), providing the declining annual inflation rate reflected by the solid green line (i.e., from 6.4% to 3.0%).
However, the second half of 2022 experienced a stall for the CPI Index. As shown in Figure 2, inflation as a percentage remained high across 2022 because of the relatively low CPI Index for each respective month of 2021. The “Stall” in 2022 set the stage for a late 2023 increase in the CPI inflation rate.
Figure 2
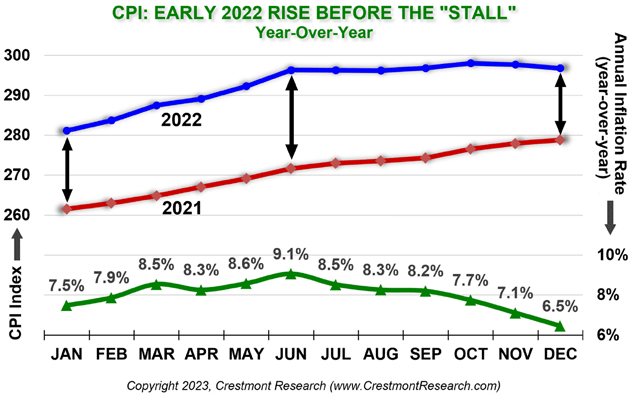
Source: Crestmont Research
Yet the 2022 Stall for the index did not cause inflation to stall near 0%. The annual year-over-year rate started to decline but remained elevated. The downward-sloping trend for inflation was likely reassuring for the Fed. At this point, it appears to have been enough hope to justify a pause or skip.
But Chairman Powell’s upcoming data may not be so hopeful. The Stall in the last half of 2022 has been waiting to pair with the same period in 2023 to provide year-over-year inflation reports. The two periods are now ready to challenge the Fed with a disturbing trend.
The last six CPI reports in 2022 provide a fairly flat base for the next six CPI reports. Any increases in the CPI index over the rest of this year won’t have the offset of dropping off elevated inflation from last year. As a result, inflation is structurally biased to increase through the rest of 2023. Each month will bring more press reports and analyst speculation that challenge the Fed to act before the inflation fire gets out of control again. The constant negative message could weigh on the financial markets.
For example, if each month’s inflation rate through year-end 2023 proceeds at an annualized 3% rate (as reflected by the dashed red line in Figure 3), the resulting increase in each month’s index will drive an increasing annual inflation rate over last year’s stalled level (i.e., the green dashed line). Note the widening of the expected gap for the next six months between this year’s and last year’s CPI Index.
Figure 3
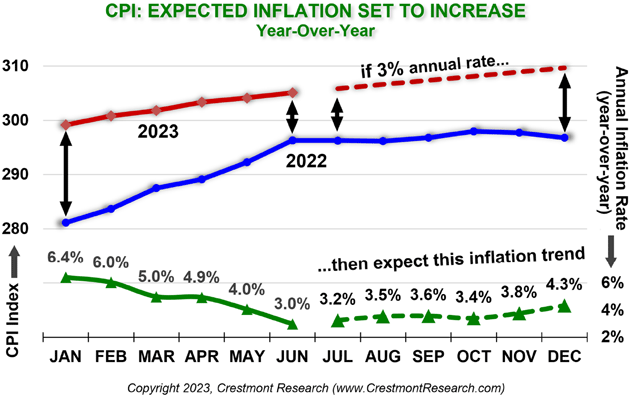
Source: Crestmont Research
A constant 0.247% monthly inflation rate (i.e., the 3% annualized rate) for the rest of 2023 is very unlikely. Instead, this analysis aims to identify key factors impacting the CPI inflation reports through year-end.
Figure 2 reflects a peak annual inflation rate of 9.1% in June 2022, with a steady rise up to and down from the peak. The percentage is the change between the current month and the CPI index twelve months prior. As a result, the year-over-year approach to reporting inflation aggregates twelve months of actual data.
Figure 4
Source: Crestmont Research
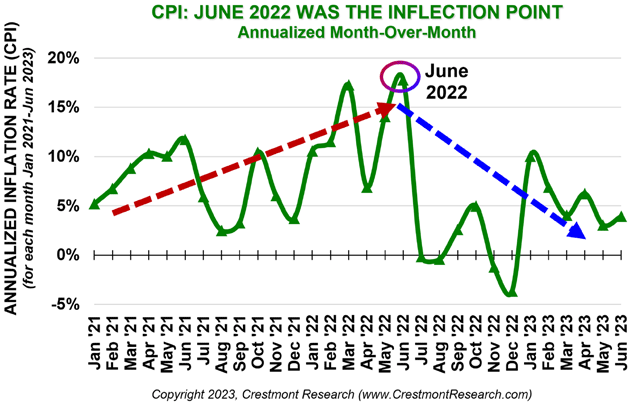
Alternatively, when each month’s CPI index is compared to its prior month and annualized, the chart is highly volatile. Figure 4 shows that annualized monthly inflation was scary out of control in the first half of 2022. Two months were above 15%, and several more were above 10%. Did Fed policy kick in after June 2022?
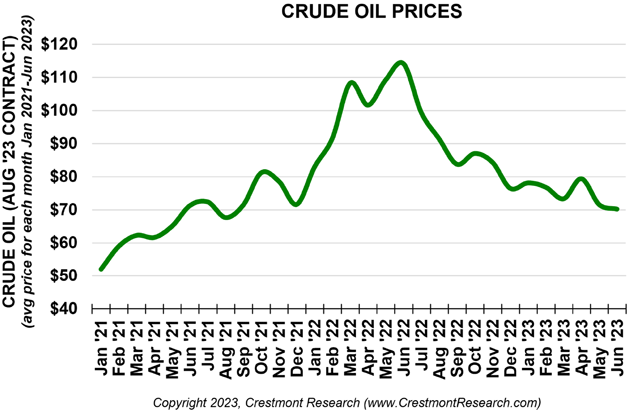
A deep dive into the data quickly shows that crude oil was the culprit and fix to the inflation trend. The reversal was not the product of the Fed’s hand. As reflected in Figure 5, oil prices surged as Russia invaded Ukraine. Global supply issues and other factors climaxed oil prices in June 2022, leading to a plunge over the subsequent few months and further tailing since then.
Figure 5
Source: Crestmont Research
Housing costs for both owners and renters also had a significant effect on CPI. The category has averaged 33% of the CPI index over the past three years. In CPI reports, housing is referred to as “shelter.” The category significantly increased inflation during 2022 and much of 2023. Three of the months annualized at 10%, and several more were near 9%.
In contrast, energy (including oil prices) contributes 7% to CPI, but its swings are much more dramatic. Either way, a small effect from a big component or a big effect from a small component can wreak havoc on an index.
Beyond the dedicated energy component, which includes energy commodities and energy services (e.g., electricity), energy-related costs have echo effects within other CPI categories. Food costs are affected by energy costs, as are transportation services (e.g., airline fares). For example, Ed’s timber and cattle operations experience and pass through fuel inflation through higher prices. Even further, some truckers and other service providers have implemented fuel service charges over the past couple of years that vary from month to month based on the price of diesel. Although the price of oil and other energy categories have pulled back from the 2022 peaks, the magnitude and speed of change over the past few years show the risk energy poses to CPI.
Figure 6
Source: Crestmont Research
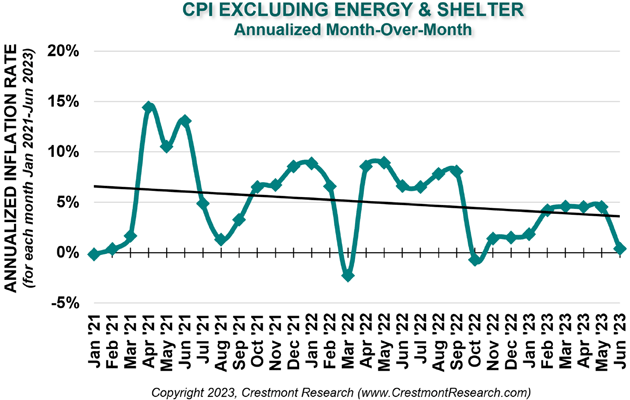
Figure 6 presents the CPI index without the energy or shelter components. The chart reflects the month-over-month change on an annualized basis. Figure 6 is comparable to Figure 4. Adjusted CPI has been elevated yet on a slight downward trek over the past two and a half years. The Fed’s slow braking appears to be working as intended. Powell seemingly knows that the Fed’s Job One is to provide a constructive environment of price stability with low inflation.
Inflation is devastating for people and the economy. It’s not a disease of wealthy portfolios. Inflation is a gremlin on the backs of working families. This is why John argues that even 2% inflation is too high. Powell has been working hard to recover from his era of “transitory.” The Fed’s systematic approach to raising interest rates has focused on restoring the Fed’s credibility without harming the economy.
Nonetheless, the Fed’s credibility will be challenged again over the rest of 2023. The 2022 Stall will drive apparent inflation higher. Powell can’t change the denominator that history is now delivering.
The twin elephants in the room are oil and housing. Each and both have been forces outside Powell’s seeming control. Housing is indeed an anomaly, as we will see next week. Yet, as the past few years have shown, the one-two punch of housing and energy can elevate and exaggerate the underlying inflation trends.
Further looming on the horizon is the risk of a recession. Given the depressing effects of recessions on employment levels, oil demand, and housing costs, Powell is likely thinking intensely about every grain of sand he adds to the monetary policy sand pile. Will his next move be the deposit that slides a gap in the face of the economy?
The June CPI report had something for everyone. The bulls are cheering one or none for further interest rate increases. Inflation came in under expectations. Within the report, CPI without energy and shelter was nearly zero (see Figure 6).
Some analysts found the report supported their outlooks about disinflation, apartment rent declines, and core inflation softness. The plunge in CPI from May’s 4.0% to June’s 3.0% is thought to be enough for the Fed to find comfort in continuing its wait-and-see approach, either before or after one more rate hike.
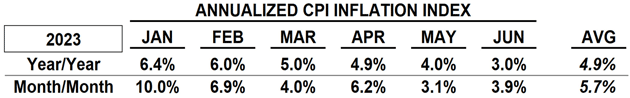
For the bears, however, June’s 3.0% benefited from its starting point last June 2022. The bears note more recent data. Month-over-month annualized, June’s inflation was up 3.94% versus May, which compares to May’s increase of only 3.06% compared to April. The bears see a back-to-back inflation increase from 3% to 4%, whereas the bulls tout the reverse using year-over-year data (see Figure 7).
Figure 7
Source: Crestmont Research
Further, the bulls cheer the drop of non-energy and shelter CPI to near zero. However, the bears recall March and October of 2022 when the same measure went negative before bouncing back over the subsequent six months (see Figure 6).
Will annual year-over-year inflation be lower or higher than 3% at year-end 2023?
Ed is optimistic by nature, yet he can only get to the level of hope this time. The 2022 Stall will be hard to overcome for the next six CPI reports. If month-to-month annualized CPI averages June’s 3.94%, December’s Y/Y inflation will be 4.8%. At 3%, it’ll be 4.3%.
Even at 0.50% annualized, the year-end CPI will be higher at 3.1%. With no monthly inflation for the next six months, annual CPI barely tweaks lower to 2.8% at year-end. CPI for the first half of 2023 was 5.7% annualized. Averaging 0.0% for the second half of 2023 mathematically delivers half of 5.7% (i.e., 2.8%) for the full year in December 2023’s CPI inflation report.
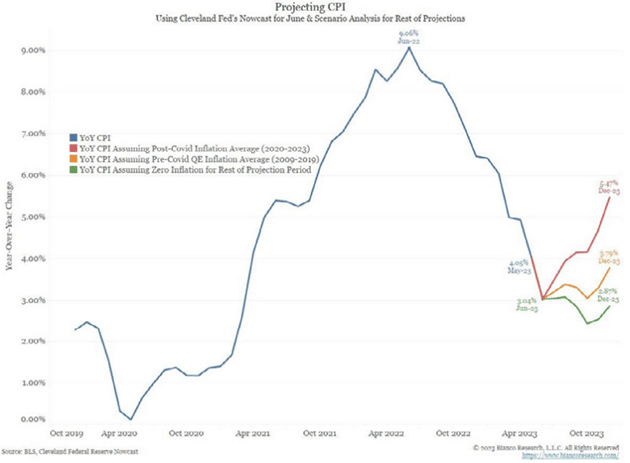
My friend Jim Bianco has this chart that shows the problem (seen in Over My Shoulder a week ago, by the way). If you can’t see the tiny numbers, those three colored lines represent what annual CPI will be assuming inflation returns to the 2020–2023 average (red line at 5.5%) or the pre-COVID 2009–2019 (yellow line at 3.9%!), or if it stays at 0% for the rest of the year (green line at 2.8%).
Source: Wayne Kozun
Under those assumptions, by year-end, CPI will be somewhere between 2.87% and 5.47%.
We can speculate all we want, but the data suggests we will be a lot closer to 4% at the end of the year than 3% (forget about 2%), absent a real recession, which would, of course, bring down inflation. But we have been waiting for the recession for a long time.
Oil will need to stay near $70/barrel to avoid adding to inflation during the second half of 2023. It is already at $75. Absent a recession, it could easily go higher. That’s outside the Fed’s control. Shelter needs a quick reversal of its strongly upward trend. Next week, Barry will show that housing may be a challenge, price-wise. Shelter may not positively affect annual CPI without realized declines in rents and owner equivalent rents (which is challenging since both rents adjust over time, not all month to month).
Next week, we’ll do a deep dive into housing and mortgages. Fed success in bringing down mortgage rates could actually boost home prices. Ugh. Lots to unpack.
Preview? We will have to see the next dot plots, but I would not be surprised to see another rate hike after July. Two more are not off the table without a recession. Not what we want to hear. The Fed can choose several paths, but for the next six months, the data is not going to play into the market’s desired pause, let alone a rate cut.
In 2006, we did an extensive survey of my readers and especially accredited investors about their lives. It was rather lengthy, but we had 16,000 people complete it. Many attached great stories.
My daughter Tiffani persuaded me to do a book based on interviews that we called Eavesdropping on Millionaires. We did over 125 hour+ of interviews talking to people about how they grew up, how they made their money, what they were doing with it, and how they were approaching it with their families. We transcribed those interviews and were getting ready to finish the writing when Wiley (our publisher) pointed out that nobody wanted to hear a book about millionaires in the middle of the Great Recession. Project postponed.
Around 2015, Tiffani said we should go back and interview those millionaires and see what happened during the Great Recession. It was just like catching up with old friends. We were making progress, and then life happened.
Fast forward to earlier this year, Tiffani got passionate about finishing the book. We did yet another series of interviews to see how “our millionaires” came through COVID. Wow, what fascinating stories. We have literally followed these people now for 15+ years, through ups and downs. We learned so much.
Now, the book is literally in final edits, and Wiley tells us that we will be in the bookstores in October. There is one thing we have left to do. Tiffany and I want to ask you to fill out a much-shortened version of the original survey so that we can compare attitudes and times. We have the placeholders for those charts and can generate them in a week.
Would you be so kind as to click the link below and fill out the survey? It will take a few minutes. Your name will not ever be associated with the data. There is a place to add your e-mail address if you have a specific question for me, but it will be in a separate data file. We truly understand the need for privacy here.
But we, especially me, would consider it a great favor if you could take a few minutes and take the survey. Thanks ever so much! Here is the link: Eavesdropping on Millionaires, 2023.
We truly appreciate it, and here is the book cover:
If you’re interested in Ed Easterling’s tree farming, watch this fascinating video on YouTube. It’s quite amazing to see what he’s done.
Shane and I are in Memphis, staying at the legendary Peabody Hotel, along with the ducks. Freedom Fest has been fun, with seeing so many old friends. Steve Forbes has not aged a day! I want to thank Rodney Baber for hosting Shane and I and George and Nini Gilder last night. We had to leave George and Nini at BB King’s as they were having too much fun and George had talked the band into doing BB King covers. They were still dancing as we left. I want to be George when I am 82. Heck, I wish I was in his shape TODAY.
Next month, we will be in Dallas for a week, where I will spend most of my time working with my partners at King Operating. Then, in early September, Shane and I will travel to Europe and end up in Paris to have an 80th birthday evening with Charles Gave and their whole team.
It is time to hit the send button. I have a speech in 90 minutes. You have a great week! And don’t forget to follow me on Twitter!
Your concerned for free speech analyst,

|
|
John Mauldin |

P.S. If you like my letters, you’ll love reading Over My Shoulder with serious economic analysis from my global network, at a surprisingly affordable price.
Click here to learn more.
About the author
