Vancouver, May 15, 2023:Fortuna Silver Mines Inc. (NYSE: FSM) (TSX: FVI) (“Fortuna” or the “Company”) today reported its financial and operating results for the first quarter of 2023.
First Quarter 2023 highlights
Financial
- Adjusted net income of $13.2 million or $0.05 per share
- Net income of $11.9 million or $0.04 per share
- Adjusted EBITDA1 of $65.3 million
- Net cash provided by operating activities $41.8 million and free cash flow from ongoing operations of $8.5 million
- Liquidity as of March 31, 2023 was $129.7 million
Return to Shareholders
- NCIB share repurchase program renewed for up to 5% of outstanding common shares (refer to Fortuna news release dated April 28, 2023)
Operational
- Gold production of 60,092 ounces
- Silver production of 1,586,378 ounces
- Gold equivalent production of 94,110 ounces
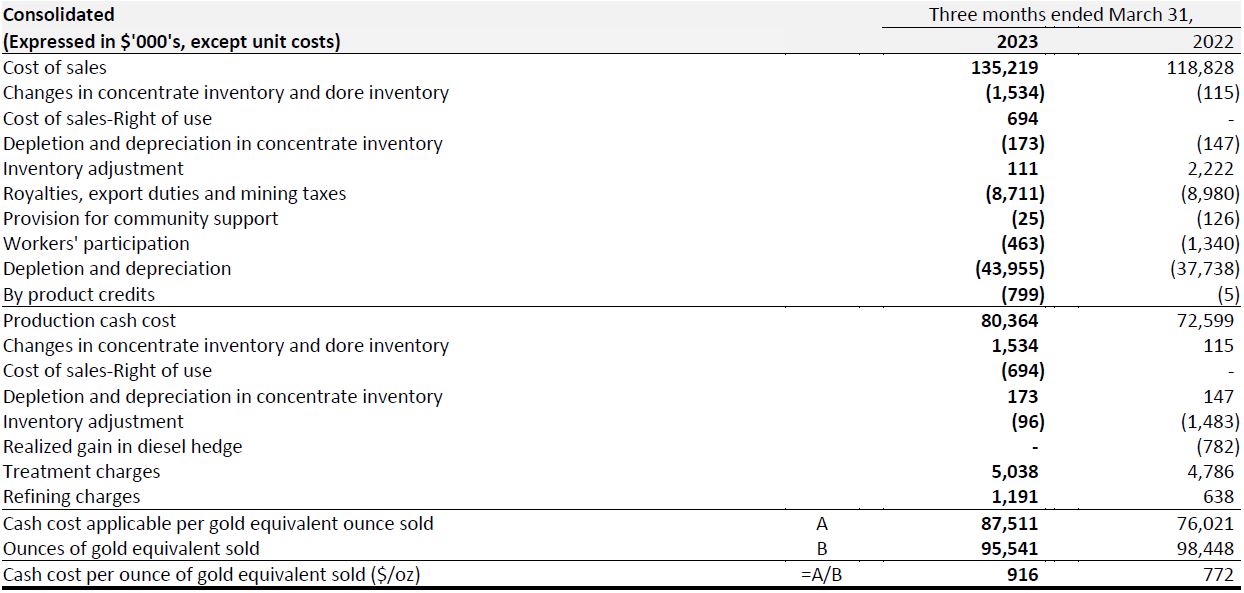
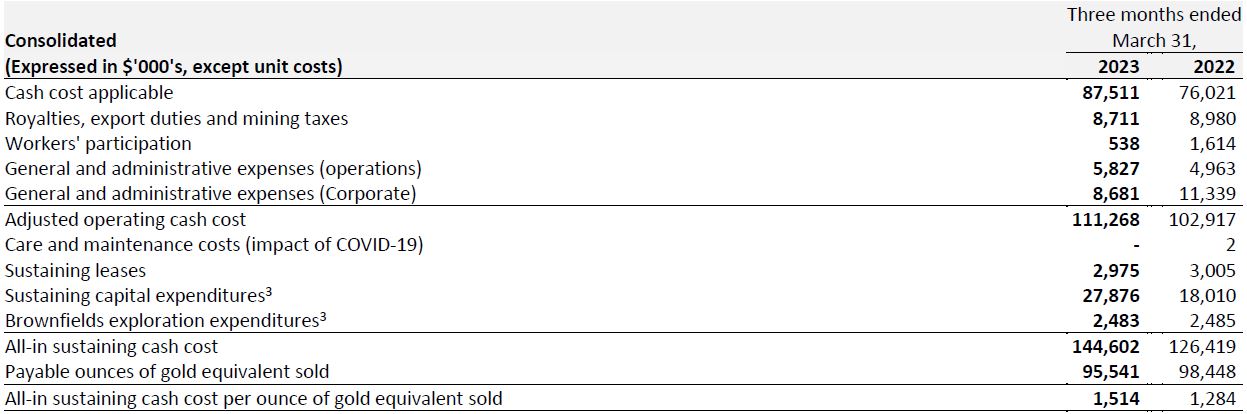
- Consolidated cash costs1 per ounce of gold equivalent sold of $916
- Consolidated AISC1 per ounce of gold equivalent sold of $1,514
- Lost Time Injury Frequency Rate (LTIFR) of 0.56 and Total Recordable Injury Frequency Rate (TRIFR) of 1.39
Growth and Development
- On May 8, 2023 Fortuna announced a definitive agreement to acquire Chesser Resources Ltd. by way of an all share transaction for a total consideration of A$89.0 million (CAD$80.6). Upon completion, the former shareholders of Chesser will own approximately 5.1% of the shares of Fortuna on an undiluted basis. Chesser Resources’ Diamba Sud Project in Senegal expands Fortuna’s advanced exploration pipeline in West Africa.
- First gold pour at the Séguéla mine in Cote d’Ivoire is planned for May 2023
Jorge A. Ganoza, President and CEO, commented, “Production and total cost per ounce for the first quarter were overall on plan, resulting in net earnings per share of $0.04 and free cash flow from operations of $8.5 million. Commissioning activities at Séguéla are well advanced and tracking according to plan for first gold pour in May, giving us a higher level of confidence in a smooth ramp-up process towards design capacity.” Mr. Ganoza continued, “The announced Chesser transaction meets our strategic objective of expanding our asset portfolio of high value opportunities in countries where we operate or near neighbours.” Mr. Ganoza concluded, “The Chesser acquisition provides for an exciting advanced exploration opportunity, expanding our West African presence to Senegal, a mining friendly jurisdiction, and into the heart of the Senegal-Mali shear zone, one of the most prolific gold belts in the West African region.”
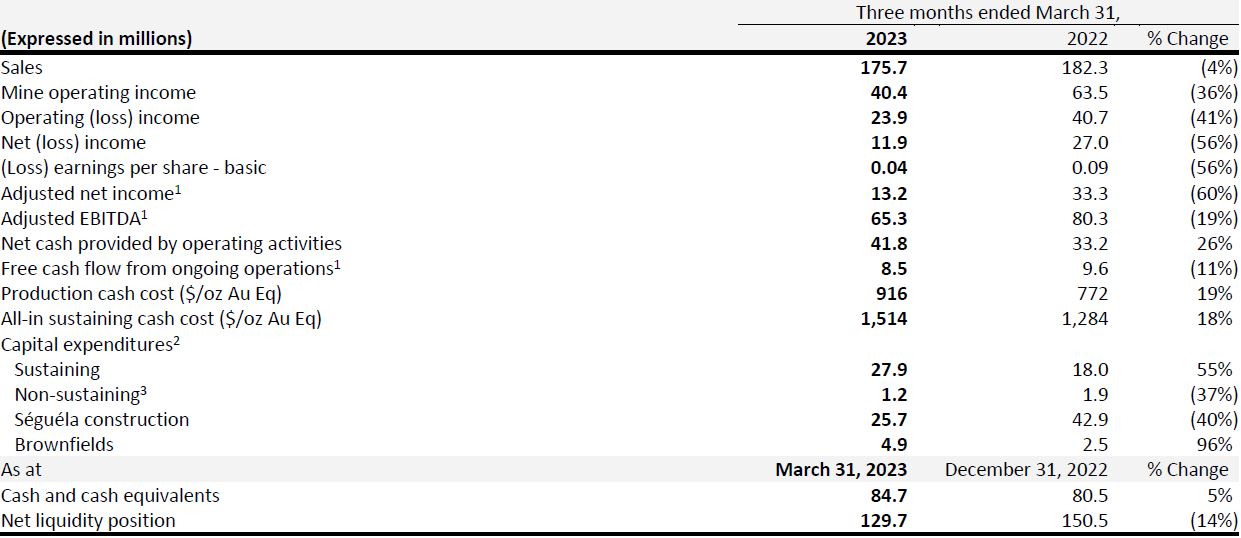
First Quarter 2023 Consolidated Results
1 Refer to Non-IFRS Financial Measures section at the end of this news release and to the MD&A accompanying the Company’s financial statements filed on SEDAR at www.sedar.com for a description of the calculation of these measures.
2 Capital expenditures are presented on a cash basis
3 Non-sustaining expenditures include greenfields exploration
Figures may not add due to rounding
First Quarter 2023 Results
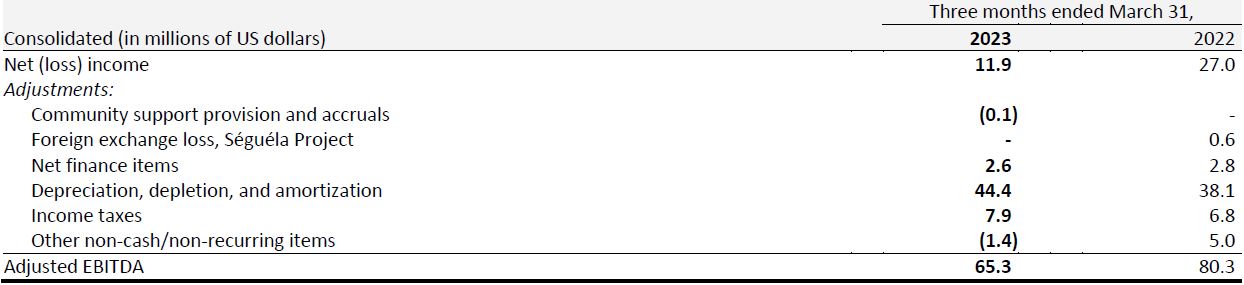
Net income for the quarter was $11.9 million compared to $27.0 million in Q1 2022. After adjusting for non-cash and non-recurring items, adjusted net income of $13.2 million for Q1 2023 was $20.1 million lower than Q1 2022. The decrease in adjusted net income was primarily due to higher operating expenses related mainly to higher input costs across our operations and lower operating margins at Yaramoko and Lindero related to lower head grades. This impact was combined with slightly lower sales of $6.7 million, mostly explained by lower silver prices of $22.52 per ounce in Q1 2023 compared to $24.18 per ounce in Q1 2022. These effects were partially offset by lower general and administrative expenses of $2.0 million compared to Q1 2022.
Adjusted EBITDA for the quarter was $65.3 million, a 36% margin over sales, compared to $80.3 million reported in Q1 2022, representing a 44% margin over sales. The main driver for the decrease in EBITDA were higher operating costs and slightly lower sales as described above.
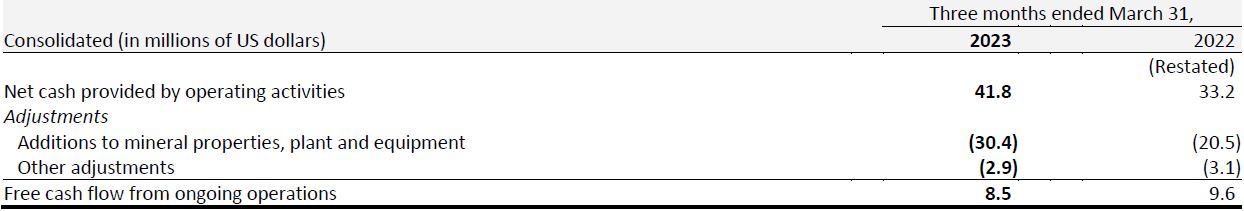
Net cash generated by operations for the quarter was $41.8 million or $0.14 per share compared to $33.2 million or $0.11 per share in Q1 2022. The increase reflects lower EBITDA of $15.0 million offset by negative changes in working capital in the current quarter of $10.8 million versus negative changes of $27.9 million in Q1 2022, and lower-income taxes paid of $7.1 million.
Free cash flow from ongoing operations for the quarter was $8.5 million, compared to $9.6 million in Q1 2022. The decrease is the result of higher net cash generated by operations of $8.6 million compared to the Q1 2022, offset by higher sustaining capex and brownfields exploration at our operating mines of $12.3 million in Q1 2023.
Liquidity
The Company’s total liquidity available as of March 31, 2023 was $129.7 million, comprised of $84.7 million in cash and cash equivalents, and $45.0 million undrawn on the $250.0 million revolving credit facility.
Séguéla Gold Project Construction Update
As of March 31, 2023, the Séguéla Gold Project had approximately $22.5 million in remaining spend of the project’s $173.5 million total initial capital, and the project remains on-time and on-budget. The Company’s cash and cash equivalents balance, free cash flow from ongoing operations and undrawn amounts of the revolving credit facility are expected to fund the remaining construction spend of the Séguéla Gold Project.
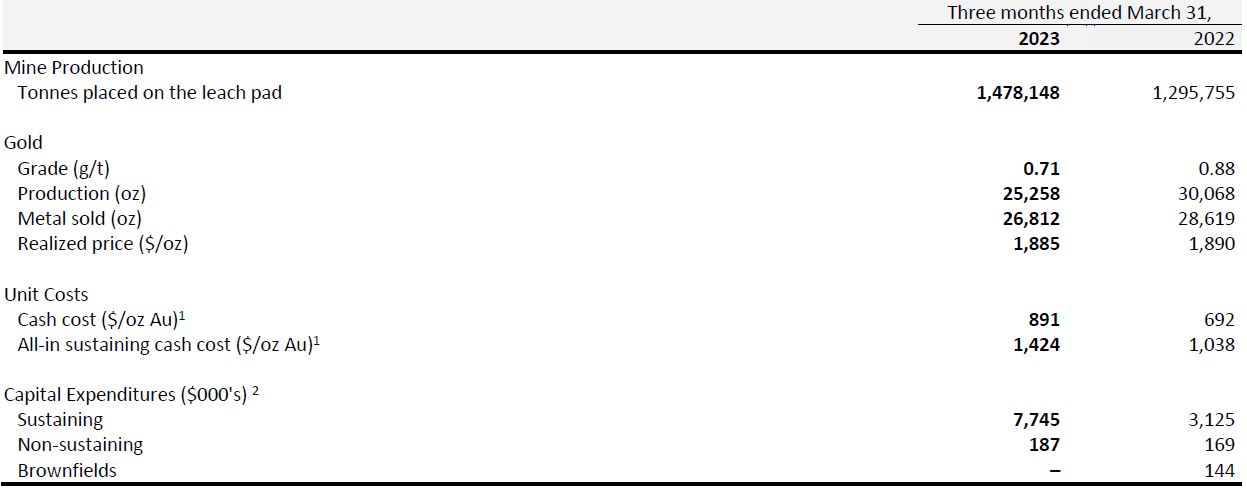
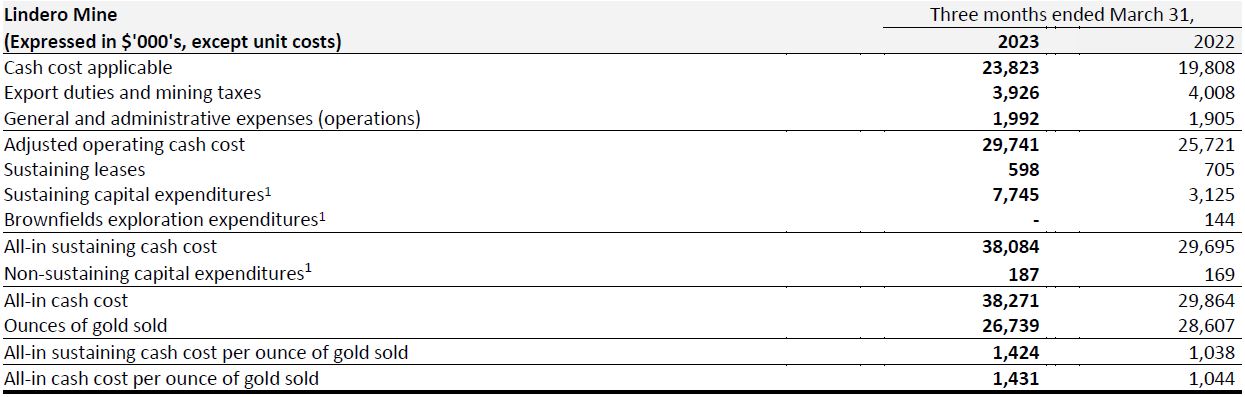
Lindero Mine, Argentina
1 Cash cost and AISC are non-IFRS financial measures; refer to non-IFRS financial measures section at the end of this news release and to the MD&A accompanying the Company’s financial statements filed on SEDAR at www.sedar.com for a description of the calculation of these measures.
2 Capital expenditures are presented on a cash basis.
Quarterly Operating and Financial Highlights
In the first quarter of 2023, a total of 1,478,148 tonnes of ore were placed on the heap leach pad, with an average gold grade of 0.71 g/t, containing and estimated 33,510 ounces of gold. Gold production for Q1 2023 totaled 25,258 ounces, representing a 16% decrease year-over-year. The decline in gold production can primarily be attributed to a decrease in the head grade of mineralized material placed on the leach pad, which is aligned with the planned mining sequence. Mine production was 1.6 million tonnes of mineralized material, with a strip ratio of 1.07:1. This stripping ratio is consistent with the operation's plan for the year, which anticipates a ratio of 1.17:1.
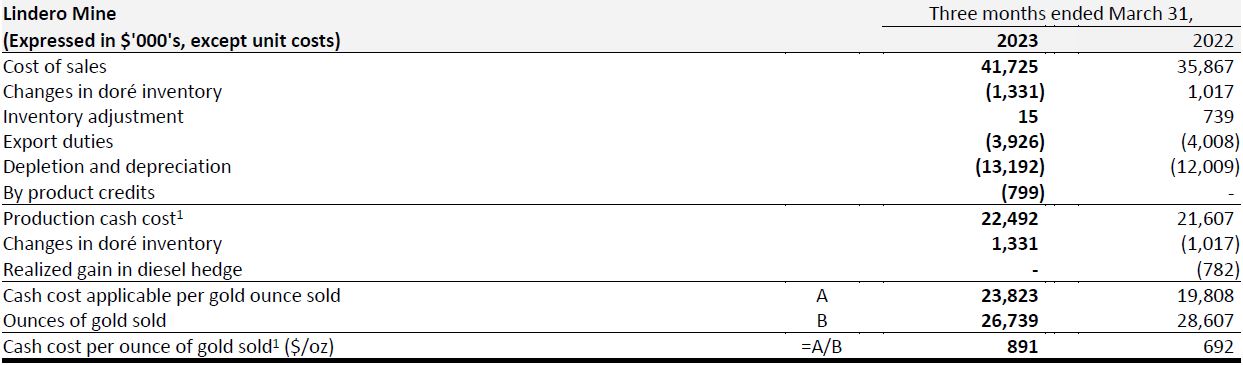
Cash cost per ounce of gold for Q1 2023, was $891 compared to $692 in the Q1 2022. Cash cost per ounce of gold was higher due to lower production, higher prices of key consumables due to inflation, higher equipment rental costs due to lower fleet availability, and timing of plant maintenance. This was partially offset by higher stripping capitalization.
All-in sustaining cash cost per gold ounce sold was $1,424 during Q1 2023 compared with $1,038 in Q1 2022. All-in sustaining cash cost for Q1 2023 was impacted by the cost issues described above, compounded by lower ounces sold and higher sustaining capital spend, partially offset by a positive by-product effect from copper.
During the quarter, sustaining capital expenditures were primarily a result of Phase II expansion of the leach pad, routine maintenance, and several minor projects. There were no brownfields exploration capital investments made within this period.
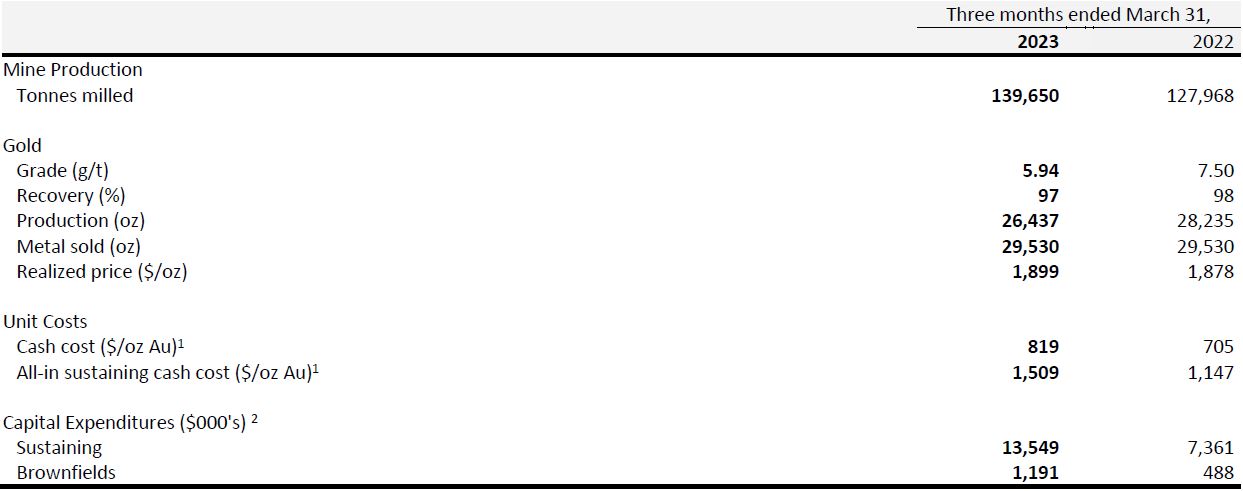
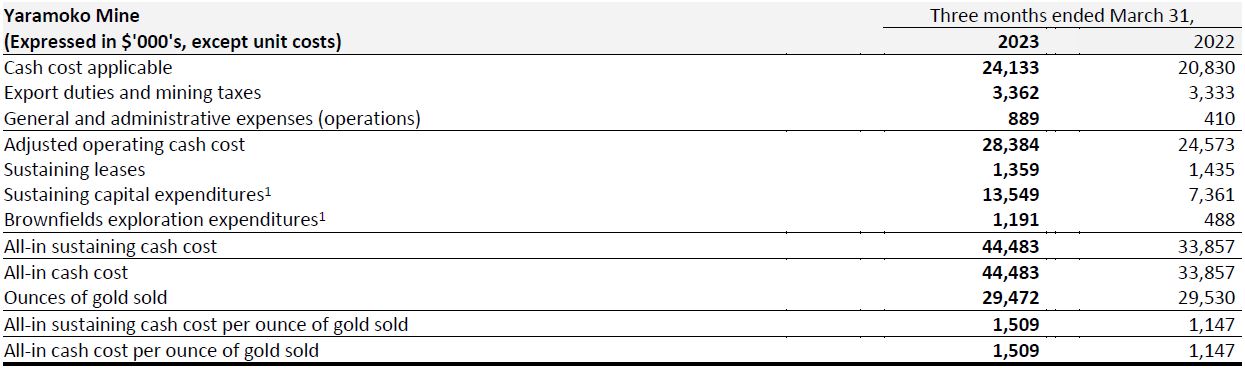
Yaramoko Mine Complex, Burkina Faso
1 Cash cost and AISC are non-IFRS financial measures; refer to non-IFRS financial measures section at the end of this news release and to the MD&A accompanying the Company’s financial statements filed on SEDAR at www.sedar.com for a description of the calculation of these measures.
2 Capital expenditures are presented on a cash basis.
The Yaramoko Mine produced 26,437 ounces of gold in the Q1 2023 with an average gold head grade of 5.94g/t, a 6% decrease, respectively, when compared to Q1 2022. Higher mill throughput contributed positively to the operation, offset by reduced operating time due to planned maintenance and lower head grades. Production for the quarter was in line with the mining sequence and Mineral Reserves estimate.
Underground mineralized material was sourced from the 55 Zone, with development also contributing from outside of the current resource boundary on the western side of the deposit.
Cash cost per ounce of gold sold in Q1 2023, was $819, compared to $705 in Q1 2022. Cash cost per ounce increased due to higher processing costs resulting from increased maintenance costs and the impact of inflation on key consumables and mining costs. Processing costs were also higher as a result of processing of increased tonnes at lower grades.
All-in sustaining cash cost per gold ounce sold was $1,509 for Q1 2023, compared to $1,147 in Q1 2022. This increase was as a result of a decrease in production, increased cash cost, and higher capital expenditures.
Sustaining capital in Q1 2023 increased due to higher mine development. Brownfields expenditure was primarily higher due to an increase in diamond drilling meters.
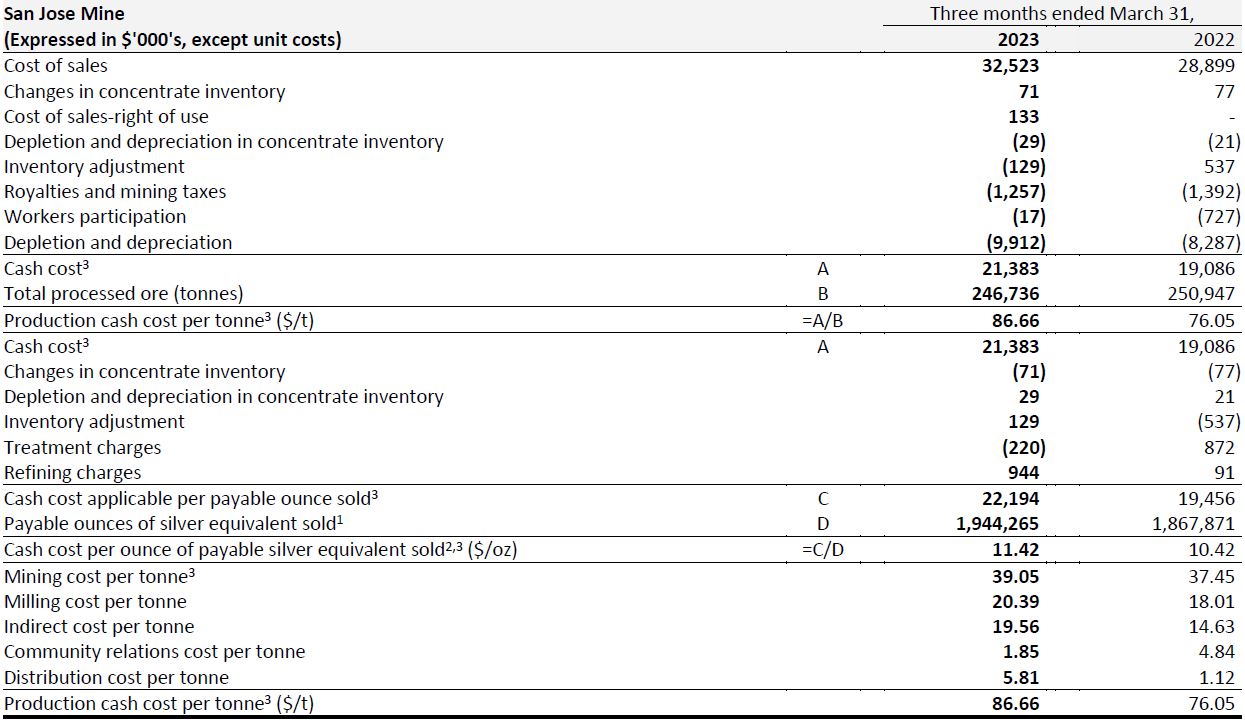
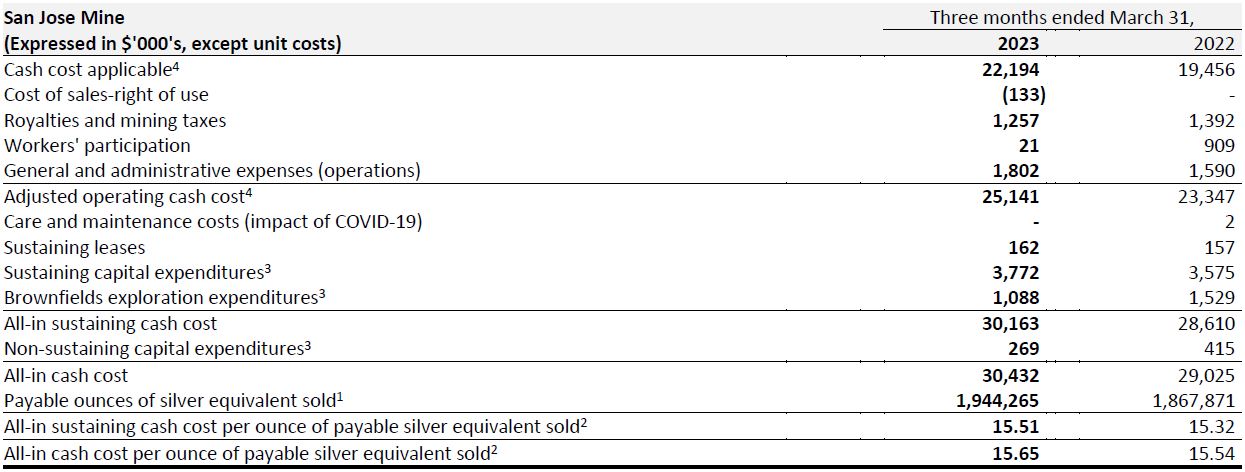
San Jose Mine, Mexico

1 Production cash cost per ounce of silver equivalent and all-in sustaining cash cost per ounce of silver equivalent are calculated using realized metal prices for each period respectively.
2 Production cash cost per tonne, production cash cost per ounce of silver equivalent, and all-in sustaining cash cost per ounce of silver equivalent are non-IFRS financial measures, refer to non-IFRS financial measures section at the end of this news release and to the MD&A accompanying the Company’s financial statements filed on SEDAR at www.sedar.com for a description of the calculation of these measures.
3 Capital expenditures are presented on a cash basis.
In the first quarter of 2023, the San Jose Mine produced 1,303,312 ounces of silver and 8,231 ounces of gold, 4% and unchanged, respectively, when compared to Q1 2022. Production for the quarter was aligned with the mining sequence and Mineral Reserves estimate.
The cash cost per tonne for Q1 2023, was $86.66 compared to $76.05 in Q1 2022. The increase was primarily due to inflation and the appreciation of the Mexican Peso, affecting consumables, labor costs and other services paid in local currency.
All-in sustaining cash costs of payable per ounce of silver equivalent for Q1 2023, increased 2% to $15.58 per ounce, compared to $15.32 in Q1 2022. The increase was due to higher cash costs partially offset by lower sustaining capital expenditures and increased silver equivalent production, mainly due to lower silver prices.
In the first quarter of 2023, sustaining capital expenditures were lower than expected, primarily due to delays in executing purchases related to components and overhauls. This contrasts with Q1 2022, when significant planned mine acquisitions had been carried over from the previous quarter. The decrease in Q1 2023 was partially offset by an increase in expenditures related to development and infill drilling meters. Brownfields exploration expenditures faced challenges from geological and operational delays, but accelerated spending is anticipated in Q2 2023.
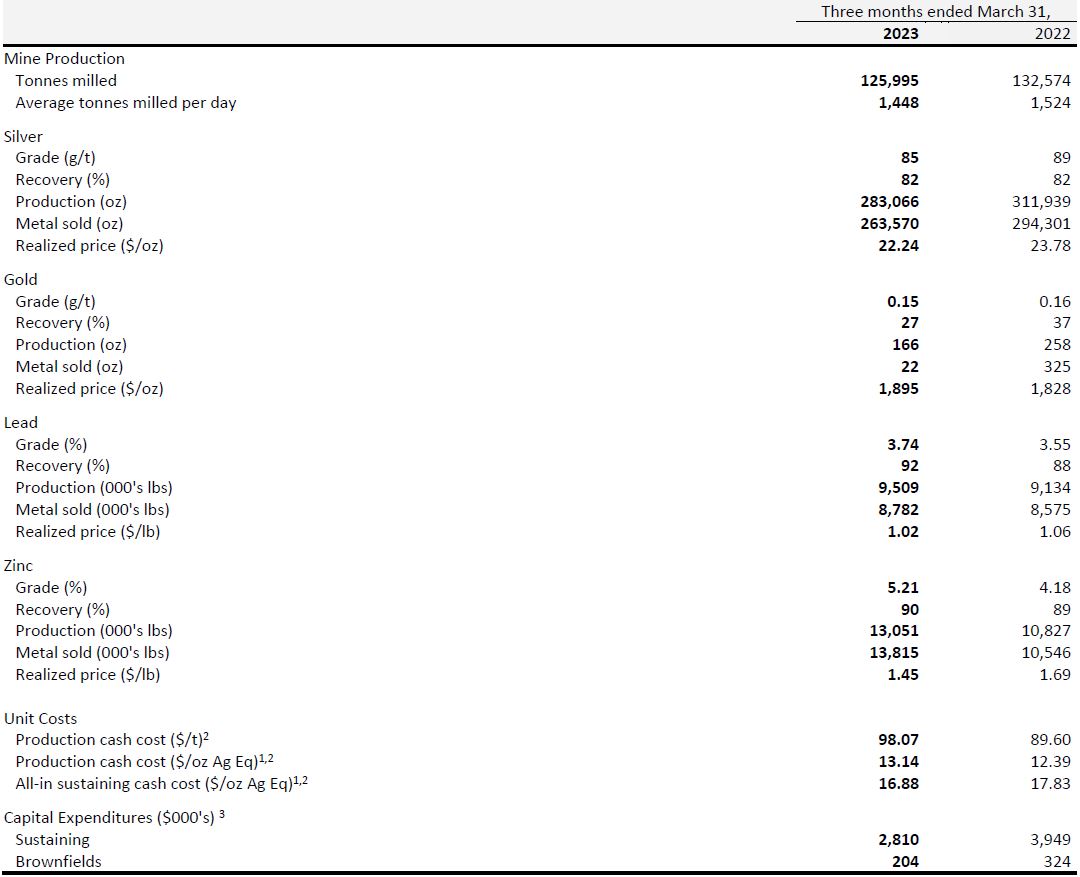
Caylloma Mine, Peru
1 Production cash cost per ounce of silver equivalent and all-in sustaining cash cost per ounce of silver equivalent are calculated using realized metal prices for each period respectively.
2 Production cash cost per tonne, production cash cost per ounce of silver equivalent, and all-in sustaining cash cost per ounce of silver equivalent are non-IFRS financial measures, refer to non-IFRS financial measures section at the end of this news release and to the MD&A accompanying the Company’s financial statements filed on SEDAR at www.sedar.com for a description of the calculation of these measures.
3 Capital expenditures are presented on a cash basis.
In the first quarter of 2023, the Caylloma Mine produced 283,066 ounces of silver, 9.5 million pounds of lead, and 13.1 million pounds of zinc. Silver production was 9% lower compared to Q1 2022, but was in line with the mining sequence and Mineral Reserves estimate. Lead and zinc production rose by 4% and 21% respectively, compared to Q1 2022, due to higher head grades from levels 16 and 17 within the Animas vein, and higher tonnes. Gold production totaled 166 ounces with an average head grade of 0.15 g/t.
The cash cost per tonne of processed ore in Q1 2023 increased 9% to $98.07 compared to $89.60 in Q1 2022. The increase was mainly due to higher mining costs driven by inflation and its direct impact on the price of materials, compounded by lower tonnes processed.
The all-in sustaining cash cost per payable silver equivalent ounce in Q1 2023, decreased 3% to $17.29 per ounce, compared to $17.83 per ounce in Q1 2022. The decrease was mainly increased silver equivalent production, mainly due to lower silver prices.
Sustaining capital expenditures in Q1 2023 decreased primarily due to blockades limiting project executions. Spending on execution of the developments located on levels 15 and level 18 at the Animas vein was offset by decreased expenditure on other levels. The decrease in brownfields exploration capital expenditures was primarily due to a decrease in diamond drilling meters.
Qualified Person
Eric Chapman, Senior Vice President of Technical Services, is a Professional Geoscientist of the Association of Professional Engineers and Geoscientists of the Province of British Columbia (Registration Number 36328), and is the Company’s Qualified Person (as defined by National Instrument 43-101). Mr. Chapman has reviewed and approved the scientific and technical information contained in this news release and has verified the underlying data.
Non-IFRS Financial Measures
The Company has disclosed certain financial measures and ratios in this news release which are not defined under the International Financial Reporting Standards (“IFRS”), as issued by the International Accounting Standards Board, and are not disclosed in the Company's financial statements, including but not limited to: cash cost per ounce of gold sold; all-in sustaining cash cost per ounce of gold sold; all-in cash cost per ounce of gold sold; total production cash cost per tonne; cash cost per payable ounce of silver equivalent sold; all-in sustaining cash cost per payable ounce of silver equivalent sold; all-in cash cost per payable ounce of silver equivalent sold; free cash flow from ongoing operations; adjusted net income; adjusted EBITDA and working capital.
These non-IFRS financial measures and non-IFRS ratios are widely reported in the mining industry as benchmarks for performance and are used by management to monitor and evaluate the Company's operating performance and ability to generate cash. The Company believes that, in addition to financial measures and ratios prepared in accordance with IFRS, certain investors use these non-IFRS financial measures and ratios to evaluate the Company’s performance. However, the measures do not have a standardized meaning under IFRS and may not be comparable to similar financial measures disclosed by other companies. Accordingly, non-IFRS financial measures and non-IFRS ratios should not be considered in isolation or as a substitute for measures and ratios of the Company’s performance prepared in accordance with IFRS. The Company has calculated these measures consistently for all periods presented.
To facilitate a better understanding of these measures and ratios as calculated by the Company, descriptions are provided below. In addition see “Non-IFRS Financial Measures” in the Company’s management’s discussion and analysis for the three months ended March 31, 2023 (“Q1 2023 MDA”), which section is incorporated by reference in this news release, for additional information regarding each non-IFRS financial measure and non-IFRS ratio disclosed in this news release, including an explanation of their composition; an explanation of how such measures and ratios provide useful information to an investor and the additional purposes, if any, for which management of the Company uses such measures and ratio. The Q1 2023 MD&A may be accessed on SEDAR at www.sedar.com under the Company’s profile.
Except as otherwise described in the Q1 2023 MD&A, the Company has calculated these measures consistently for all periods presented.
Reconciliation to adjusted net income for the three months ended March 31, 2023 and 2022

1 Amounts are recorded in Cost of sales
2 Amounts are recorded in General and Administration
Figures may not add due to rounding
Reconciliation to adjusted EBITDA for the three months ended March 31, 2023 and 2022
Figures may not add due to rounding
Reconciliation of free cash flow from ongoing operations for the three months ended March 31, 2023 and 2022
In 2022, the Company changed the method for calculating free cash flow from ongoing operations. The calculation now uses taxes paid as opposed to the previous method which used current income taxes. While this may create larger quarter over quarter fluctuations due to the timing of income tax payments, management believes the revised method is a better representation of the free cash flow generated by the Company’s ongoing operations. Comparative values from 2021 have been restated using the change in the methodology.
Figures may not add due to rounding
Reconciliation of cash cost per ounce of gold sold for the three months ended March 31, 2023 and 2022

Reconciliation of cash cost per ounce of gold equivalent sold for the three months ended March 31, 2023 and 2022
Reconciliation of all-in sustaining cash cost per ounce of gold sold for the three months ended March 31, 2023 and 2022
1 Presented on a cash basis
1 Presented on a cash basis
Reconciliation of all-in sustaining cash cost per ounce of gold equivalent sold for the three months ended March 31, 2023 and 2022
Gold equivalent was calculated using the realized prices for gold of $1,893/oz Au, $22.5/oz Ag, $2,256/t Pb, and $3,197/t Zn for Q1 2023 and using the realized prices for gold of $1,884/oz Au, $24.2/oz Ag, $2,331/t Pb, and $3,736/t Zn for Q1 2022
Reconciliation of production cash cost per tonne and cash cost per payable ounce of silver equivalent sold for the three months ended March 31, 2023 and 2022
1 Silver equivalent sold for Q1 2023 is calculated using a silver to gold ratio of 81.2:1 (Q1 2022: 77.9:1).
2 Silver equivalent is calculated using the realized prices for gold and silver. Refer to Financial Results – Sales and Realized Prices

1 Silver equivalent sold for Q1 2023 is calculated using a silver to gold ratio of 0.0:1 (Q1 2022: 76.9:1), silver to lead ratio of 1:22.3 pounds (Q1 2022: 1:22.5), and silver to zinc ratio of 1:15.7 pounds (Q1 2022: 1:14.0).
2 Silver equivalent is calculated using the realized prices for gold, silver, lead, and zinc. Refer to Financial Results - Sales and Realized Prices
Reconciliation of all-in sustaining cash cost and all-in cash cost per payable ounce of silver equivalent sold for the three months ended March 31, 2023 and 2022
1 Silver equivalent sold for Q1 2023 is calculated using a silver to gold ratio of 81.2:1 (Q1 2022: 77.9:1).
2 Silver equivalent is calculated using the realized prices for gold and silver. Refer to Financial Results - Sales and Realized Prices
3 Presented on a cash basis

1 Silver equivalent sold for Q1 2023 is calculated using a silver to gold ratio of 0.0:1 (Q1 2022: 76.9:1), silver to lead ratio of 1:22.3 pounds (Q1 2022: 1:22.5), and silver to zinc ratio of 1:15.7 pounds (Q1 2022: 1:14.0).
2 Silver equivalent is calculated using the realized prices for gold, silver, lead, and zinc. Refer to Financial Results - Sales and Realized Prices
3 Presented on a cash basis
Additional information regarding the Company’s financial results and activities underway are available in the Company’s audited consolidated financial statements for the three months ended March 31, 2023 and accompanying Q1 2023 MD&A, which are available for download on the Company’s website, www.fortunasilver.com, on SEDAR at www.sedar.com and on EDGAR at www.sec.gov/edgar.
Conference Call and Webcast
A conference call to discuss the financial and operational results will be held on Tuesday, May 16, 2023 at 9:00 a.m. Pacific time | 12:00 p.m. Eastern time. Hosting the call will be Jorge A. Ganoza, President and CEO; Luis D. Ganoza, Chief Financial Officer; Cesar Velasco, Chief Operating Officer - Latin America; David Whittle, Chief Operating Officer - West Africa; and Paul Weedon, Senior Vice President Exploration.
Shareholders, analysts, media and interested investors are invited to listen to the live conference call by logging onto the webcast at https://www.webcaster4.com/Webcast/Page/1696/48290or over the phone by dialing in just prior to the starting time.
Conference call details:
Date: Tuesday, May 16, 2023
Time: 9:00 a.m. Pacific time | 12:00 p.m. Eastern time
Dial in number (Toll Free): +1.888.506.0062
Dial in number (International): +1.973.528.0011
Access code: 256829
Replay number (Toll Free): +1.877.481.4010
Replay number (International): +1.919.882.2331
Replay passcode: 48290
Playback of the earnings call will be available until Tuesday, May 30, 2023. Playback of the webcast will be available until Thursday, May 16, 2024.
About Fortuna Silver Mines Inc.
Fortuna Silver Mines Inc. is a Canadian precious metals mining company with four operating mines in Argentina, Burkina Faso, Mexico, and Peru, and our fifth mine under construction in Côte d’Ivoire. Sustainability is integral to all our operations and relationships. We produce gold and silver and generate shared value over the long-term for our stakeholders through efficient production, environmental protection, and social responsibility. For more information, please visit our website.
ON BEHALF OF THE BOARD
Jorge A. Ganoza
President, CEO, and Director
Fortuna Silver Mines Inc.
Investor Relations:
Carlos Baca | info@fortunasilver.com | www.fortunasilver.com | Twitter | LinkedIn | YouTube
Forward-looking Statements
This news release contains forward-looking statements which constitute "forward-looking information" within the meaning of applicable Canadian securities legislation and "forward-looking statements" within the meaning of the "safe harbor" provisions of the Private Securities Litigation Reform Act of 1995 (collectively, "Forward-looking Statements"). All statements included herein, other than statements of historical fact, are Forward-looking Statements and are subject to a variety of known and unknown risks and uncertainties which could cause actual events or results to differ materially from those reflected in the Forward-looking Statements. The Forward-looking Statements in this news release include, without limitation, statements about the Company's plans for its mines and mineral properties; the Company’s anticipated financial and operational performance in 2023; estimated production and costs of production for 2023, including grade and volume of metal produced and sales, revenues and cashflows, and capital costs (sustaining and non-sustaining), and operating costs, including projected production cash costs and all-in sustaining costs; the ability of the Company to mitigate the inflationary pressures on supplies used in its operations; estimated capital expenditures and estimated exploration spending in 2023, including amounts for exploration activities at its properties; the Company’s plans for the transition from construction to operations of a mine at the Séguéla project in Cote d’Ivoire; the economics for the construction of the mine at the Séguéla project, including the estimated construction capital expenditures for the project, the timelines and schedules for the construction and production of gold at the Séguéla project; statements regarding the Company's liquidity, access to capital; the impact of high inflation on the costs of production and the supply chain; the impact of COVID-19 on the Company’s operations; the Company's business strategy, plans and outlook; the merit of the Company's mines and mineral properties; mineral resource and reserve estimates, metal recovery rates, concentrate grade and quality; changes in tax rates and tax laws, requirements for permits, anticipated approvals and other matters. Often, but not always, these Forward-looking Statements can be identified by the use of words such as "estimated", “expected”, “anticipated”, "potential", "open", "future", "assumed", "projected", "used", "detailed", "has been", "gain", "planned", "reflecting", "will", "containing", "remaining", "to be", or statements that events, "could" or "should" occur or be achieved and similar expressions, including negative variations.
Forward-looking Statements involve known and unknown risks, uncertainties and other factors which may cause the actual results, performance or achievements of the Company to be materially different from any results, performance or achievements expressed or implied by the Forward-looking Statements. Such uncertainties and factors include, among others, changes in general economic conditions and financial markets; the risks relating to a global pandemic, including the COVID-19 pandemic, as well as risks associated with war or other geo-political hostilities, such as the Ukrainian – Russian conflict, any of which could continue to cause a disruption in global economic activity; fluctuation in currencies and foreign exchange rates; increases in the rate of inflation; the imposition or any extension of capital controls in countries in which the Company operates; any changes in tax laws in Argentina and the other countries in which we operate; changes in the prices of key supplies; technological and operational hazards in Fortuna’s mining and mine development activities; risks inherent in mineral exploration; uncertainties inherent in the estimation of mineral reserves, mineral resources, and metal recoveries; changes to current estimates of mineral reserves and resources; changes to production and cost estimates; the ability of Minera Cuzcatlan to successfully contest and revoke the resolution of SEMARNAT which revoked the environmental impact authorization at the San Jose mine; changes in the position of regulatory authorities with respect to the granting of approvals or permits; governmental and other approvals; changes in government, political unrest or instability in countries where Fortuna is active; labor relations issues; as well as those factors discussed under “Risk Factors” in the Company's Annual Information Form. Although the Company has attempted to identify important factors that could cause actual actions, events or results to differ materially from those described in Forward-looking Statements, there may be other factors that cause actions, events or results to differ from those anticipated, estimated or intended.
Forward-looking Statements contained herein are based on the assumptions, beliefs, expectations and opinions of management, including but not limited to the accuracy of the Company’s current mineral resource and reserve estimates; that the Company’s activities will be conducted in accordance with the Company’s public statements and stated goals; that there will be no material adverse change affecting the Company, its properties or changes to production estimates (which assume accuracy of projected ore grade, mining rates, recovery timing, and recovery rate estimates and may be impacted by unscheduled maintenance, labour and contractor availability and other operating or technical difficulties); the construction at the Séguéla gold Project will continue on the time line and in accordance with the budget as planned; the duration and impacts of COVID-19; geo-political uncertainties that may affect the Company’s production, workforce, business, operations and financial condition; tthe expected trends in mineral prices and currency exchange rates; that the Company will be successful in mitigating the impact of inflation on its business and operations; that Minera Cuzcatlan will be successful in the legal proceedings to reinstate the environmental impact authorization at the San Jose mine; that all required approvals and permits will be obtained for the Company’s business and operations on acceptable terms; that there will be no significant disruptions affecting the Company's operations, the ability to meet current and future obligations and such other assumptions as set out herein. Forward-looking Statements are made as of the date hereof and the Company disclaims any obligation to update any Forward-looking Statements, whether as a result of new information, future events or results or otherwise, except as required by law. There can be no assurance that these Forward-looking Statements will prove to be accurate, as actual results and future events could differ materially from those anticipated in such statements. Accordingly, investors should not place undue reliance on Forward-looking Statements.
Cautionary Note to United States Investors Concerning Estimates of Reserves and Resources
Reserve and resource estimates included in this news release have been prepared in accordance with National Instrument 43-101 Standards of Disclosure for Mineral Projects ("NI 43-101") and the Canadian Institute of Mining, Metallurgy, and Petroleum Definition Standards on Mineral Resources and Mineral Reserves. NI 43-101 is a rule developed by the Canadian Securities Administrators that establishes standards for public disclosure by a Canadian company of scientific and technical information concerning mineral projects. Unless otherwise indicated, all mineral reserve and mineral resource estimates contained in the technical disclosure have been prepared in accordance with NI 43-101 and the Canadian Institute of Mining, Metallurgy and Petroleum Definition Standards on Mineral Resources and Reserves. Canadian standards, including NI 43-101, differ significantly from the requirements of the Securities and Exchange Commission, and mineral reserve and resource information included in this news release may not be comparable to similar information disclosed by U.S. companies.
About the author