Gold’s sharp selloff this month has been driven by a confluence of factors. Entering February short-term overbought, a couple surprise events ignited big gold-futures selling. Then the US futures regulator failed to report speculators’ positioning, breaking the feedback mechanism limiting excessive selling. But the main reason those futures guys have been able to run amok is gold investors are still missing in action.
Major gold uplegs are fueled by three sequential stages, with the first two igniting the subsequent two. Uplegs are born in deep lows as speculators rush to buy to cover gold-futures short contracts. That burns out fast, lasting a couple months at best. But that legally-required buying forces gold high enough for long enough to attract back other long-side gold-futures speculators. Their voluntary buying is much larger.
On average over the past year, total spec longs have exceeded total spec shorts by 2.4x. Thus they are proportionally more important for fueling major gold uplegs. Stage-one gold-futures short covering soon gives way to stage-two gold-futures long buying, which can run three to six months. That drives gold higher still, eventually attracting back investors with their vast pools of capital dwarfing gold-futures specs’.
Those early-gold-upleg dynamics were working normally into early February. Gold had powered 20.2% higher over 4.2 months since late September, formally entering a bull market. Between late September to early December, stage-one gold-futures short covering drove big initial 8.8% gold gains! Specs bought to cover 66.2k gold-futures short contracts during that span, the equivalent of 205.8 metric tons of gold.
Spec long buying was all but nonexistent then, totaling only 1.8k contracts. That stage-two buying started ramping up in mid-December, propelling gold another 9.3% higher into late January. Specs added 51.9k gold-futures longs during that early stage-two buying, the equivalent of 161.5t of gold. But their short-covering buying petered out then, shorts actually grew 1.5k contracts. Gold’s upleg was advancing like usual.
Eventually all that stage-one gold-futures short covering and stage-two gold-futures long buying drives gold high enough for long enough to ignite far-bigger stage-three investment buying. That lags major gold bottomings, because investors love chasing upside momentum and wait until uplegs are well-established before piling in. While getting closer, that essential stage-three ignition hasn’t happened yet in today’s upleg.
Heading into gold’s latest interim high on February 1st, stage-two gold-futures long buying was ramping up nicely. But gold was getting short-term overbought, stretched 1.096x above its key 200-day moving average. That remained well below upleg-slaying levels of exuberance exceeding 1.16x, but a healthy pullback to rebalance sentiment was increasingly likely. A violent one erupted on February 2nd and 3rd.
A couple weeks ago I wrote a whole essay analyzing gold’s sharp pullback, but in a nutshell two events triggered it. On the first day where gold dropped 2.0%, the European Central Bank’s latest monetary-policy decision implied one more rate hike then a pause. That unexpected dovishness hit the euro, which unleashed a parallel US dollar rally. Gold-futures speculators watch the dollar closely and do the opposite.
On the second day gold plunged another 2.4% after the latest US monthly jobs report. A record seasonal adjustment exceeding 3m jobs transformed terrible raw data into a statistically-impossible eight-standard-deviation upside surprise! Despite being fabricated, that headline jobs number implied the US economy was overheating which was very Fed-hawkish for more rate hikes. So more gold-futures selling erupted.
Despite plunging 4.4% from $1,951 to $1,866 in only two days, gold’s upleg still looked great technically after that violent pullback. Gold remained well above its $1,840 50dma, which are the strongest support zones in ongoing bull-market uplegs. Gold indeed stabilized and drifted sideways over the subsequent week, with that big gold-futures selling mostly spent. That sharp pullback had quickly eradicated greed.
Gold probably wouldn’t have drifted much lower if not for an exceedingly-anomalous event overlaying all of this. Gold-futures specs’ capital firepower is very limited, but they run extreme leverage around 25x. Way up there, a mere 4% gold move against their bets will wipe out 100% of their capital risked! And at 25x, every dollar they deploy in gold futures has 25x the price impact on gold as a dollar invested outright!
So these guys’ hyper-leveraged trading utterly dominates short-term gold price action. Since they can’t afford to be wrong for long, they have to closely follow weekly reports detailing their collective positioning as a herd. This essential Commitments of Traders data alerts the gold-futures specs when their bets are getting too lopsided to be sustainable. That naturally moderates and reverses excessive buying or selling!
Unbelievably on January 31st these CoTs went dark. The Commodity Futures Trading Commission that regulates US futures trading and collates positioning data stopped releasing CoTs due to a ransomware cyberattack on a major futures-clearing and data firm. This week is now the fourth in a row without any CoT data, which is shocking. The CFTC has issued press releases saying it hasn’t received the data yet!
I wrote another whole essay last week analyzing this troubling CoT-report outage. Without CoTs, these leveraged gold-futures speculators have no idea how much selling they have collectively done. Normally that crucial data naturally checks their selling, warning them to slow their shorting and long dumping when their overall downside bets grow unsustainably excessive. But they have been flying blind since January 24th!
After stabilizing for a week following that sharp early-February pullback, gold started drifting lower during the last couple weeks. While that was comparatively moderate, gold’s slump under its 50dma may not have happened had that CoT data been published normally. With that essential feedback mechanism for the gold-futures specs broken, the magnitude of their herd selling has been cloaked enabling it to grow bigger.
Before all this craziness, neither specs’ stage-one short covering nor stage-two long buying was done yet. Secular support for total spec shorts is running near 112k contracts, another 9k below the last-reported levels in late January. And secular resistance for total spec longs is way up near 413k contracts, a huge 112k higher than late-January levels! That implies another 26.9t and 347.8t of gold-equivalent buying coming!
Considered another way, it is useful to look at total spec shorts and longs as percentages up into their past-year trading ranges. As of that last January 24th CoT, total spec shorts were running 32% up into their range and total spec longs were 33% up into their own. That implies about a third of stage-one short-covering buying remained, and two-thirds of the more-important 2.4x-larger stage-two long buying!
So gold’s upleg was still young in early February, far from fully running its course. The majority of gold-futures buying was still coming, and the vast stage-three investment buying hadn’t even started yet! The best-available data on global gold investment demand is low-resolution, only released once a quarter by the World Gold Council in its excellent Gold Demand Trends reports. That’s too infrequent to time gold uplegs.
Thankfully some high-resolution daily data often accounts for the majority and sometimes all of quarterly global gold investment demand changes. That’s the combined bullion holdings of the mighty American GLD SPDR Gold Shares and IAU iShares Gold Trust gold ETFs. According to the WGC’s latest Q4’22 GDT, together GLD and IAU commanded 39.3% of all the gold held by all the world’s physically-backed ETFs!
A UK gold ETF in third place only weighed in at 7.3%. In Q3’22 and Q4’22, the quarterly changes in GLD+IAU holdings alone were responsible for 106% and 90% of the overall changes in total global gold investment demand per the WGC! These ETFs act as conduits for the vast pools of American stock-market capital to slosh into and out of gold. When that is happening, it dominates gold capital flows and pricing.
This chart superimposes GLD+IAU holdings over gold and its key technicals during the last several years or so. When GLD+IAU holdings are rising, stock-market capital is flowing into gold. These ETF shares are being bid up faster than gold, forcing these ETFs to issue more shares to prevent their prices from decoupling from gold to the upside. The proceeds from those share sales are then plowed into more gold bullion.
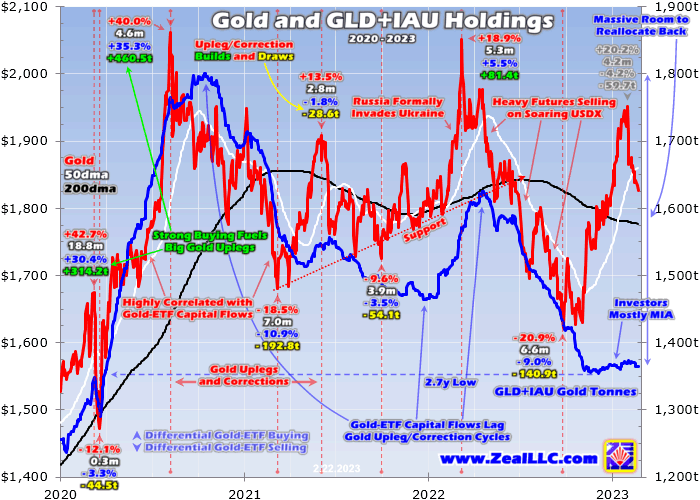
Strategically note that major gold uplegs are fueled by huge stage-three investment buying as evident in GLD+IAU holdings. A couple massive 42.7% and 40.0% gold uplegs peaked during 2020, which saw these mighty American gold ETFs’ holdings soar 30.4% or 314.2t and 35.3% or 460.5t! And the major corrections between uplegs are driven by differential GLD+IAU-share selling, as seen during mid-2022.
Gold plunged 20.9% in 6.6 months, partially driven by a 9.0% or 140.9t GLD+IAU-holdings draw. Huge gold-futures selling played a bigger role, as speculators aggressively short sold and dumped longs on the most-extreme Fed tightening cycle ever. Resulting giant yield differentials catapulted the US dollar parabolic, its benchmark US Dollar Index skyrocketing 16.7% in 6.0 months to an extreme 20.4-year secular peak!
So specs fled gold futures with reckless abandon, crushing gold. But their capital firepower available for selling is very finite, and once it exhausted gold V-bounced into today’s strong young upleg. The Fed’s extreme dollar-gold anomaly was starting to unwind. Gold was again initially driven higher by stage-one gold-futures short-covering buying, then the baton was taken by other specs doing stage-two long buying.
While that drove gold a strong 20.2% higher in 4.2 months into early February, the majority still had yet to be done. And that gold-futures buying apparently hadn’t forced gold high enough for long enough to start enticing back investors. They love chasing upside momentum and had started nibbling, but that was it. As this chart shows, those GLD+IAU holdings have barely budged as gold shot higher in recent months!
Again investors aren’t leveraged so they don’t have to closely watch gold. It takes some time after major bottomings before they realize decisive sustainable uptrends are forming. So the troughs in GLD+IAU holdings and global investment demand occur after futures-driven terminal gold lows. While the last one came at $1,623 in late September, GLD+IAU holdings would fall another 5.3% or 75.5t lower into early December.
They finally bottomed at just 1,354.5 metric tons, a deep 2.7-year low not seen since just emerging from March 2020’s brutal pandemic-lockdown stock panic! American stock investors had virtually no portfolio exposure to gold. That day GLD+IAU holdings were worth $77.0b, merely 0.2% of the total $34,588.8b market capitalization of all 500 American stocks in the flagship S&P 500 index! Gold had been left for dead.
And despite it powering over 20% higher in recent months, investors are still missing in action per this GLD+IAU-holdings proxy for global investment demand. At best in early February the day after gold’s $1,951 interim high, GLD+IAU holdings climbed to 1,373.4t. That makes for a trivial 1.4% or 18.9t build at best, which is nothing. Gold’s stage-three investment buying hasn’t even started yet, which is super-bullish.
Make no mistake, it is still coming! We are suffering in the worst inflation super-spike since the 1970s, thanks to the Fed’s extreme money printing in recent years. In just 25.5 months into mid-April 2022, this central bank recklessly ballooned its balance sheet an absurd 115.6% or $4,806.9b! Effectively the monetary base underlying the entire global US dollar supply, that more than doubled in just a couple years.
And even though the Fed has started reversing some of those epic bond monetizations, its balance sheet is still 101.6% higher than just before March 2020’s stock panic! Inflation is simply relatively-more money competing for and bidding up the prices on relatively-less goods and services. Regardless of how much the Fed hikes rates, inflation is going to continue raging until prices soar to reflect a doubled money supply.
Inflation ravages stock markets, eroding corporate earnings as companies can’t fully pass along their own higher input costs to customers without seriously damaging revenues. Indeed the S&P 500 plunged 25.4% from early January to mid-October last year, formally entering a new bear market! Its mauling isn’t done yet despite the recent strong bear-market rally, as stock-market valuations remain dangerously high.
Entering February, those elite S&P 500 stocks still averaged 28.3x trailing-twelve-month price-to-earnings ratios. That’s still in bubble territory over 28x! Bears don’t tend to hibernate until they smash valuations back down to and often well under the 14x fair value over the past century-and-a-half. So more big stock-market losses are coming, making gold way more appealing for prudently diversifying stock-heavy portfolios.
Gold skyrocketed during the last two inflation super-spikes in the 1970s. In monthly-average-price terms from trough to peak CPI-reported inflation, gold soared 196.6% over 30 months during the first before another 322.4% moonshot over 40 months during the second! After nearly tripling then more than quadrupling during those last inflation super-spikes, gold ought to at least double during today’s latest one.
At some point American stock investors will figure all this out. They’ll get tired of the mounting losses in stocks as this bear’s predations continue, and they’ll realize raging inflation isn’t being vanquished by extreme Fed rate hikes. They’ll see gold powering higher, and realize they are woefully underinvested in this ultimate portfolio diversifier. Then they will flood into GLD and IAU shares, and gold will be off to the races.
So this young gold upleg’s stage-three investment buying is still coming. The rest of the stage-one gold-futures short covering and stage-two gold-futures long buying might be necessary to bring back investors. They will start chasing gold again once its powers high enough for long enough to fuel sufficient upside momentum to get it back on their radars. That will probably begin fairly soon, likely in the next couple months.
Sooner or later those hyper-leveraged speculators will exhaust their capital firepower available for selling. That could rapidly reverse into buying anytime on some downside surprise in major economic data, such as jobs or inflation, that is Fed-dovish. The bouncing US dollar would sell off sharply on that, igniting big gold-futures buying. Fed officials will start talking more dovish too as the bear-market losses in stocks mount.
The CFTC is finally starting to restore those crucial CoTs as well, beginning with back data this week. It is now forecasting being fully caught up and resuming normal weekly publishing by late March. So even if there’s no big Fed-dovish data, the gold-futures specs are soon facing a reckoning revealing just how much collective selling they’ve recently done. Restoring that feedback mechanism should limit further selling.
The more gold-futures selling speculators have done in recent weeks, the less they have left to do. Their finite capital firepower available for selling is exhausting! Uncloaking their collective trading may prove a shock, as these guys realize their likely selling has run its course so they rush to buy. That could catapult both gold and its miners’ stocks sharply higher, ending this anomalous selloff exacerbated by no CoT data.
Like usual the biggest beneficiaries of a sharp gold reversal higher will be the gold stocks. They were hit far harder than they should’ve been in recent weeks as gold’s anomalous plunge gutted bullish sector sentiment. Thus they are poised to roar back up in a V-bounce mean reversion as gold’s selloff ends. So this outsized gold plunge is a great mid-upleg opportunity to buy into gold stocks at relatively-low prices!
If you regularly enjoy my essays, please support our hard work! For decades we’ve published popular weekly and monthly newsletters focused on contrarian speculation and investment. These essays wouldn’t exist without that revenue. Our newsletters draw on my vast experience, knowledge, wisdom, and ongoing research to explain what’s going on in the markets, why, and how to trade them with specific stocks.
That holistic integrated contrarian approach has proven very successful, yielding massive realized gains during gold uplegs like this underway next major one. We extensively research gold and silver miners to find cheap fundamentally-superior mid-tiers and juniors with outsized upside potential as gold powers higher. Our trading books are full of them already starting to soar. Subscribe today and get smarter and richer!
The bottom line is gold investors are still missing in action. Their massive stage-three buying hasn’t even started yet, according to the best proxy for global gold investment demand. Gold’s young upleg blasted 20%+ higher into early February on gold-futures speculators covering shorts and starting to buy longs. With the majority of that stage-one and stage-two buying remaining, gold’s upleg is still alive and well.
While gold’s recent pullback started violently, mid-upleg selloffs are perfectly normal. They are essential periodically to rebalance sentiment which keeps uplegs healthy, extending their gains. Spec gold-futures buying will return soon, eventually driving gold high enough for long enough to start attracting back investors. They love chasing upside momentum, which their big buying accelerates fueling virtuous circles.
Adam Hamilton, CPA
February 24, 2023
Copyright 2000 - 2023 Zeal LLC (www.ZealLLC.com)
About the author