
After a well deserved correction of nearly 3 months the gold stock sector is still flashing positive signs beneath the surface, as the correction matures
The correction that began in August amid the ‘Buffett Buys a Gold Stock!‘ tout has now ground on for nearly 3 months. As noted in the NFTRH 626 Opening Notes segment:
“Thus far the correction in gold, silver and the miners is perfect, where perfection means long, drawn out and maddeningly frustrating to bulls (and bears thus far). That’s what corrections are, remedies to excitement, confidence and of course, greed.”
We are managing the technical details (and associated strategies) of the correction in HUI and individual gold stocks each week in NFTRH, but as a gold stock investor it has not been a time for making money since August. As a trader it has been a difficult time for making money as well, because of the lack of a definitive drop that the sector’s corrections are known for. It has been a grind, and in that annoying, time consuming process, it has been perfect.
Below are some pictures that we have maintained front and center during the correction in order to disqualify or more likely, confirm the macro bull view for gold and the miners. This was so that subscribers could sell, buy or hold as they see fit, but more importantly so that we could know the status of the backdrop all along the way to make better informed decisions.
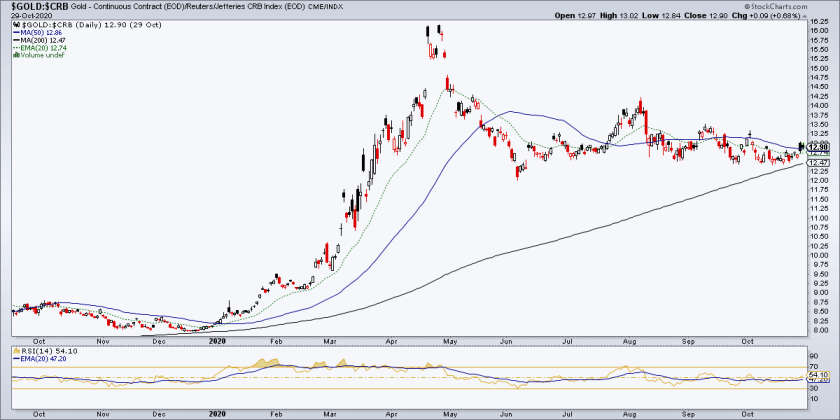
Meanwhile, the perfection has been in the cleaning of the investor base, a large portion of which thinks that inflation is good for gold miners. Often it is for the stock prices, but rarely is it good for the bedrock sector fundamentals. One of the best measures of the real price of gold is the Gold/CRB ratio, which is in part of measure of the gold mining product vs. gold mining costs, especially energy costs.
Note a perfect post-April consolidation in Au/CRB and a daily RSI ticking positive. That correction in time had value because the Q1 spike was too much, too soon. But it was impulsive and may imply more upside.
As a side note, a cyclical (pro-reflation) inflation trade – if applicable – will likely not get started until this ratio breaks down. A new leg up however, would paint the gold stock sector as uniquely positive because the gold miners leverage the performance of their product vs. their cost inputs.
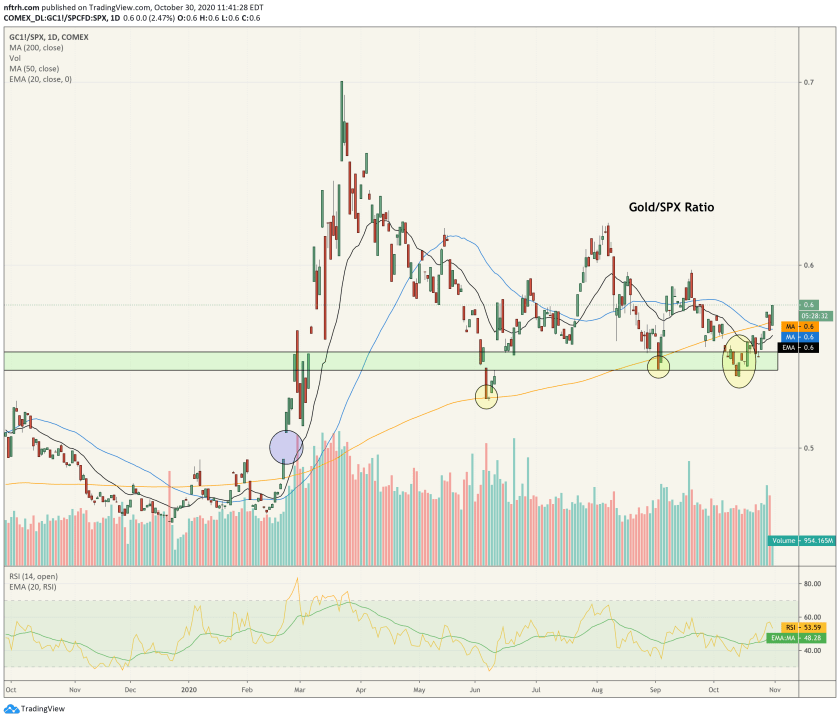
An even more important indicator is the Gold/SPX ratio (along with Gold/DJW, which is the World index). If the chart above informs gold mining fundamental operations this one informs a positive macro view of gold mining. In other words, if gold is declining vs. stocks the masses will herd with stocks, not gold or its miners.
After a recent threat of breakdown, a stock market correction came about right on cue to reverse Gold/SPX back above the moving averages. A classic mental whipsaw. This is another beautiful picture of a post-March reset in gold bug expectations after remaining intact by the hair of its chinnny chin chin.
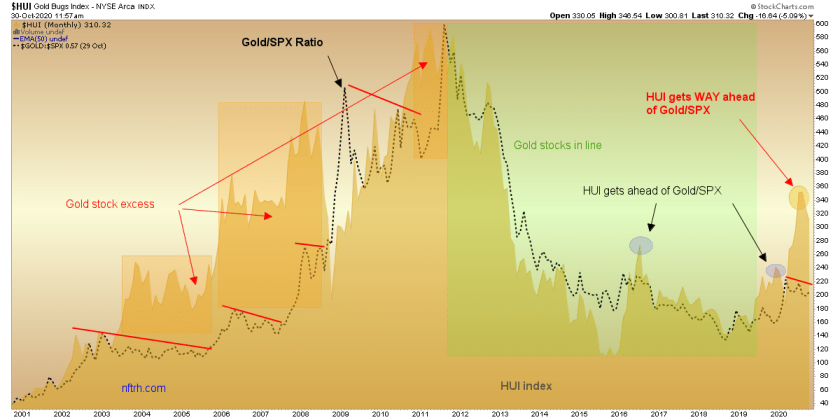
Here is the chart that first put us on alert for a coming gold stock correction. HUI had lunged too high in relation to the consolidating Gold/SPX ratio. The correction in the miners is addressing that situation and you can see here why the chart directly above is so important. As a side note and as you can see, this type of situation was all too common in the 2001-2008 bull market.
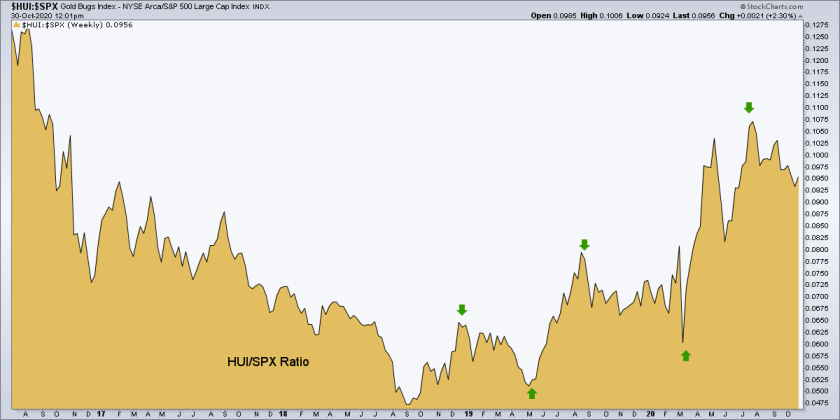
The HUI/SPX ratio has remained intact all along. We have anticipated a tap of the solidly up-trending 200 day moving average. With higher highs/lows and the moving averages trending up this is a bullish picture and is another positive from a macro perspective.
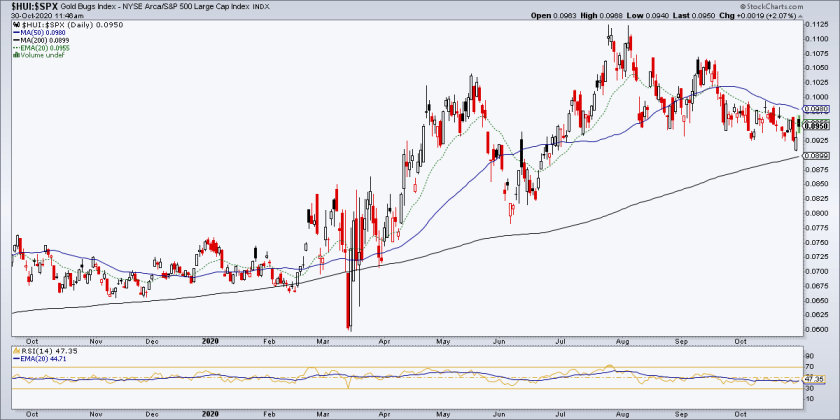
Gold stock leadership is intact and has been ongoing since HUI/SPX bottomed in 2018. The green arrows represent a series of higher highs/lows and I expect another green arrow to appear shortly.
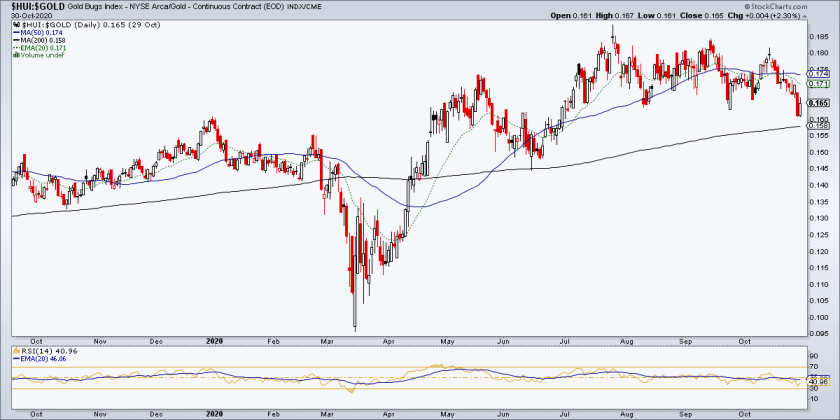
HUI/Gold ratio (HGR) is also very important. Gold stocks can rise while the HGR declines, but for the healthiest view of the sector, you want to see it rising. Note the gentle uptrend of the 200 day moving average, which HGR is easing to test.
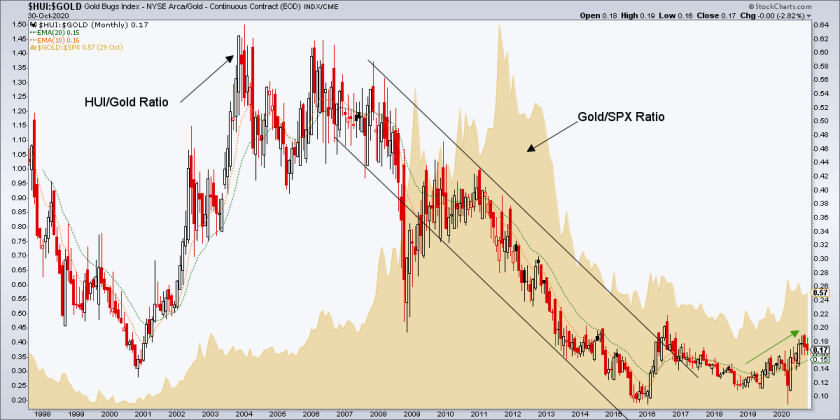
On its big picture (monthly chart) the HGR is beautiful. It is aping the Gold/SPX ratio, which means that as gold gains vs. the broad stock market, the gold miners are gaining better.
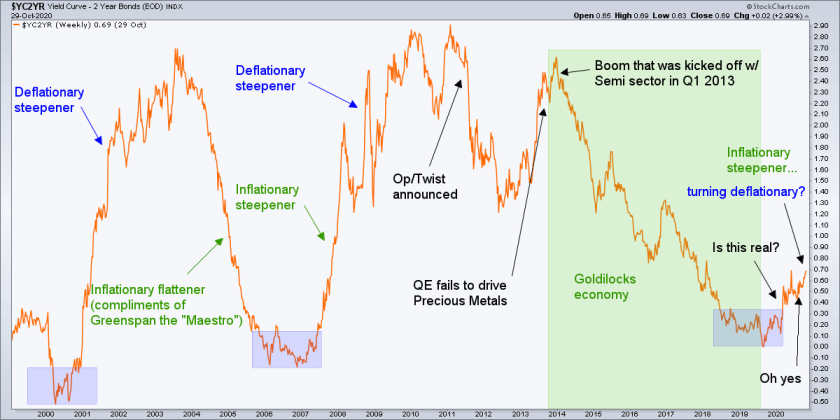
The pictures above indicate a still-intact deflationary situation in the markets despite the inflationary relief party in progress since the Government/Treasury/Fed triumvirate began full frontal monetary/fiscal panic earlier in the year. Our final beautiful picture is of the Yield Curve, which has been steepening under inflationary pressure but could just as easily do so with deflationary pressure. In either case, short-term yields would be lower relative to long-term yields, if not nominally.
The Yield Curve is on a steepener and this steepener began well before COVID-19 made the scene. It is possible if not probable that the pandemic and the policy responses it instigated have fueled relief, and put the party to the post-March relief trade (Wayne? Garth?). It was a punch bowl out of nowhere, if you will.
Inflationary or deflationary, if the curve is steepening, it tends to be gold positive. If it is a deflationary steepening it’s even more positive for the gold miners’ fundamentals, if not their prices in the short-term (multitudes of inflationist gold bugs have to finish the puking ritual, after all).
Put your thinking caps on folks and consider tuning down the cacophony of the US presidential election. That stuff is there to dissuade you from the facts of the macro whirring along beneath the surface in pictures like those above. Still pretty pictures indeed for the gold stock sector.
For “best of breed” top down analysis of all major markets, subscribe to NFTRH Premium, which includes an in-depth weekly market report, detailed interim market updates and NFTRH+ dynamic updates and chart/trade setup ideas. Follow via Twitter @NFTRHgt.
About the author
