
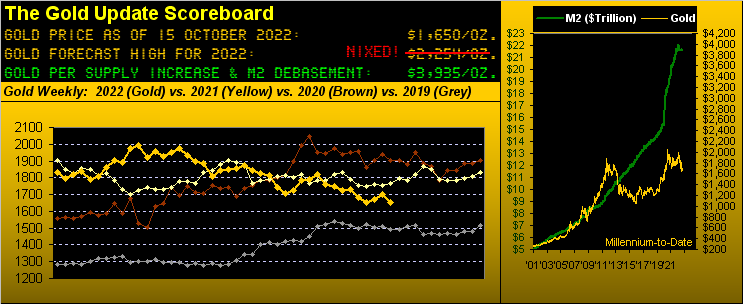
In settling out the week yesterday (Friday) at 1650, Gold recorded its lowest weekly close of the past four. And within the guise of the ongoing weekly parabolic Short trend (as we below see), let's recall what herein was penned four weeks ago upon it all starting back then:
■ "...[this] case nonetheless suggests Gold dropping to around 1599-1585..."
That's just some 50 points further down from here, which given that Gold's EWTR ("
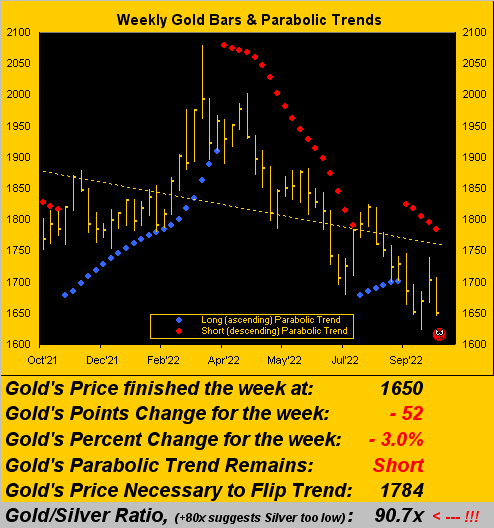
To be sure therein, the faster daily parabolics for Gold -- as well as those for Silver -- had flipped to Long, sending the yellow metal to as high as 1739 and the white metal to as high as 21.31; however, both those parabolic studies have just now flipped back to Short, down from those two highs per yesterday's settles by -5.1% and -14.6% respectively. Indeed, Silver's drop being nearly triple that by Gold, the Gold/Silver ratio has leapt back over 90x to 90.7x as stated at the foot of above graphic.
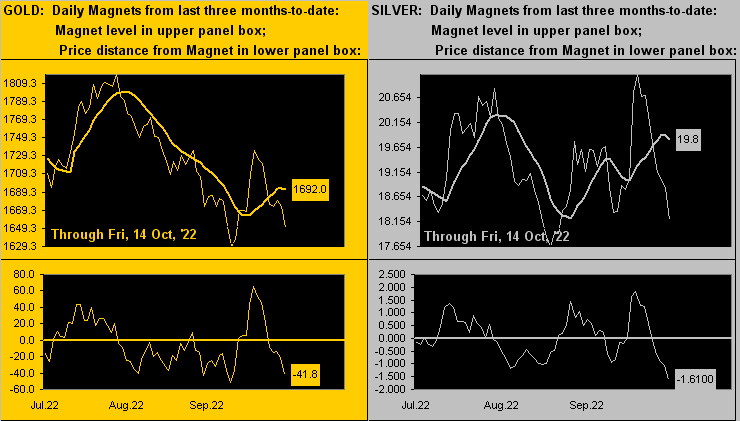
Such negativity noted, the website's Market Magnets for the precious metals are indicative of their recent selling being excessive. Here on the left for Gold we've the past three months of daily closes (thin line) along with the Magnet (thick line); the oscillator at the foot of the graphic is the distance of price from the Magnet, now notably extreme per prior troughs. Then on the right is the same analysis for Silver, her deviation also comparatively extreme:
Regardless of such colliding technicals (the parabolic Short trend vs. overdone selling per the Magnet), the Gold Story remains pretty much the same: lack of ownership interest (recall the below-average, declining volume table from two missives ago) plus the purported paper price suppression continue to keep the precious metals under wraps.
Meanwhile from the "Money is Coming Out of Everything Dept." we've the stock market and its attendant hysteria. As we've oft put forth over these many years, change is an illusion whereas price is the truth. And last Thursday's 194-point whipsaw in the S&P 500 had quite the illusionary effect on the FinMedia. As Bloomy couched it, Thursday's move was "historic". Really? So we checked: the S&P 500's percentage range between that day's low and high was 5.6%; since 1980, such range ranks 59th (hardly "historic") across those 10,812 trading days. But for the Bulls, it did sate them for some 24 hours before better than half of Thursday's gain was given back yesterday. Bear markets can be brutal.
For the S&P, regular readers well know the technical support structure runs from here at 3600 down to 3200. Therein, Morgan Stanley earlier in this bear market suggested a target of 3400. Now this past week, JPM's Jamie "Jumpin'" Dimon sees 2900 as feasible due to (deep breath) "valuation", something upon which we've been harping for years! 'Course the difference today is that interest rates are positive.
But wait, there's more: You might recall this from mid-May when the S&P was over 4000: "...we see no sense fundamentally to be in the stock market..." --[deMeadville Prescient Commentary, Tue, 17 May].
From which we segue to having just updated this:
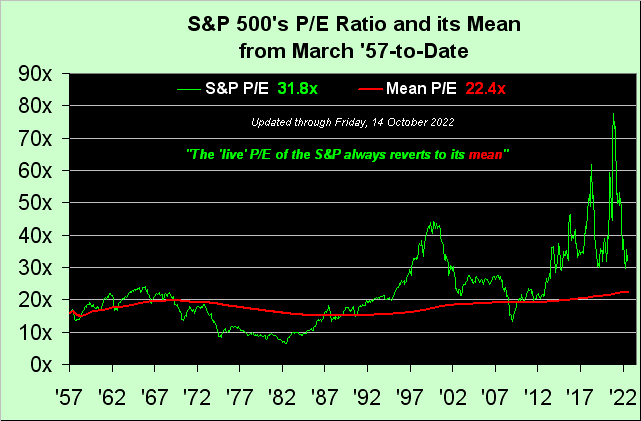
And what "this means" is that should there be no year-over-year S&P earnings growth, price at the mean is 2522, (just in case you're scoring at home). Now obviously 'tis too earlier in this fresh Q3 Earnings Season to make any reasonable judgment; however, for the 19 S&P 500 constituents having thus far reported, 11 (58%) have bettered their earnings. Yet, is the long-awaited "Look Ma! No Earnings!" crash finally underway?
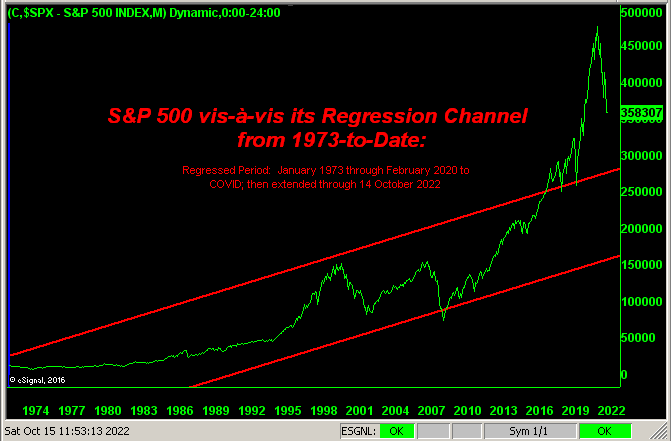
Here, too, is the S&P 500's regression channel as set from January 1973 through February 2020 (i.e. to COVID), and then extended through today. In other words: where might the S&P be had COVID not come to be? Remember: the increase in the U.S. Money Supply ("M2") on account of COVID essentially equaled the post-COVID increase in the market capitalization of the S&P. In other words: the money never ought have been printed. And now look where re-entry into the channel would be: 2900. You cannot make this stuff up:
However speaking of "up" is the rightmost track of the Economic Barometer incorporating Q3 metrics, in turn maintaining the notion that we'll see a return to growth "inflated as it may be" for StateSide Q3 Gross Domestic Product, (as we've previously noted in perfect timing for the mid-term elections):
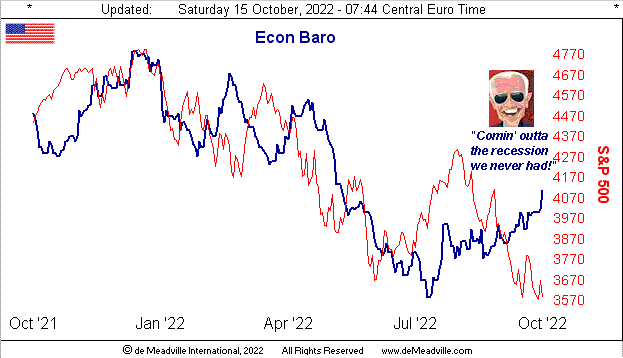
For the week just past, of the 11 incoming Baro metrics, nine were net positive (vis-à-vis expectations, improvements and revisions), of which six were direct period-over-period improvements. And as we've pointed out over the years, inflation tends to work as an Econ Baro positive as it reflects demand for goods and services: ya just gotta pay more for 'em. This even as Chicago FedPrez Charles "Ever Upwards" Evans says the Federal Reserve need keep raising rates. But from a more daunting perspective, FedViceChairWoman Lael "The Brain" Brainard noted that past and future rate hikes shall (in the words of Dow Jones Newswires) "...slow the economy in ways that can’t be observed yet..." Terrifique.
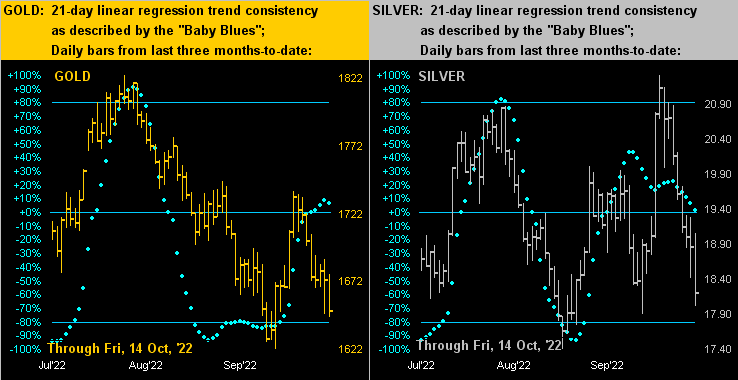
Neither terrific are the precious metals' respective price paths. Here at left we've Gold's daily bars across the past three months-to-date, the baby-blue dots of regression trend consistency running out of puff. And at right we've same for Sister Silver as it swiftly has all gone wrong for her of late:
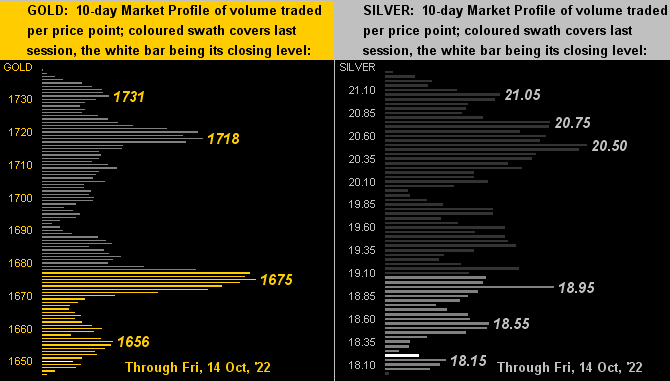
And when it ain't goin' right, 'tis deep into the Market Profiles one find price's plight, (i.e. at the bottom). Here they are for the past two weeks with Gold (below left) and for Silver (below right); neither is a pretty sight:
Again, per the aforeshown Market Magnets graphics, a bounce would rightly be in order for Gold and Silver even as the weekly parabolic trend remains Short. 'Course what's really needed today is widespread ordering to buy Gold and Silver!

...m...
About the author
