
The time is at hand for gold stocks to prove a phase change similar to 2001-2003.
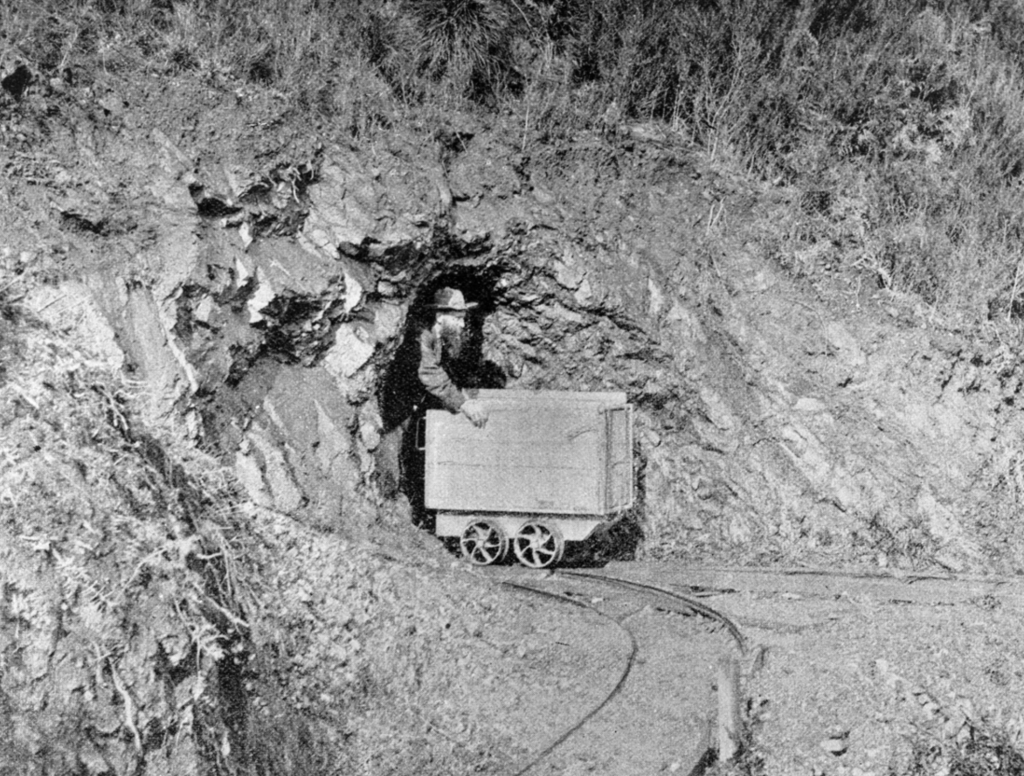
Huey lugs his cart of rocks out of a mountainside shaft
In 2000 a great stock bubble rolled over, the US dollar was soon to roll over into a bear market, commodities remained in a bear market for another year, and one unique sector rose, improbably enough to the majority. Gold and gold stocks bottomed, exited a long bear market and turned up in 2001.
What actually happened was what often happened in the great age of bubble making (by monetary and fiscal policy). Gold and the miners led a recovery that eventually included commodities and later, stock markets. The rest is history; a long and bubbling history spanning two decades.
But currently, we project an end to effective bubble making and thus, an end to the status of gold and the miners merely being leaders (and eventual failures) into new bubble phases. A fleeting phase from 2001 to 2003 saw the gold miners rise as unique equities within a global bear market. But that unique quality ended in 2003 as a global asset bubble resumed, to the denial of gold perma bulls who were unable to see that the inflation created mainly by the Fed, but also by fiscally stimulating government was unhealthy to the anti-bubble, gold, and in a leveraged fashion, the miners that dig it out of the ground.
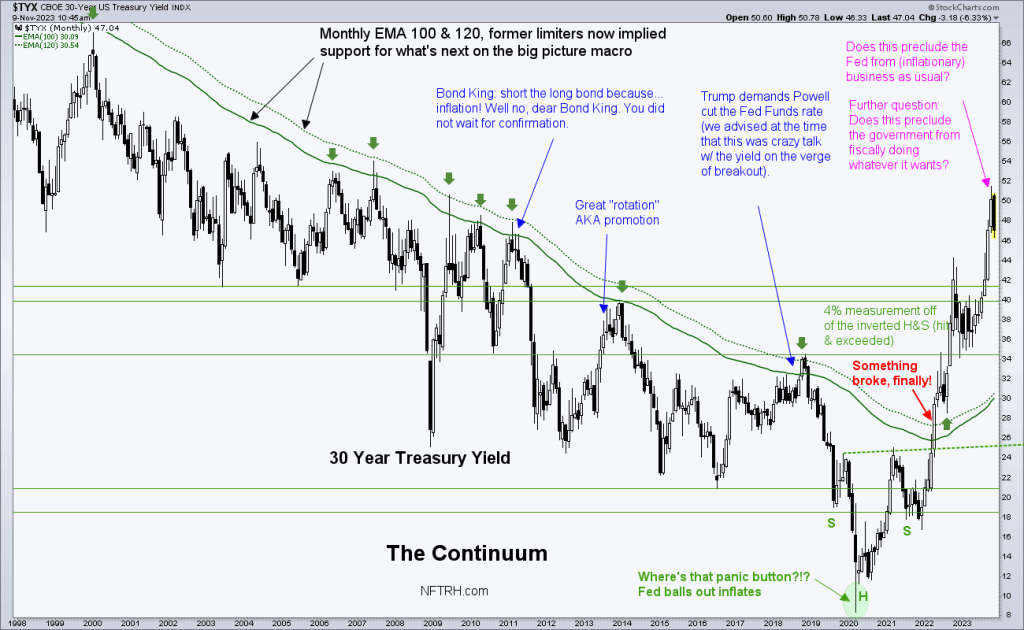
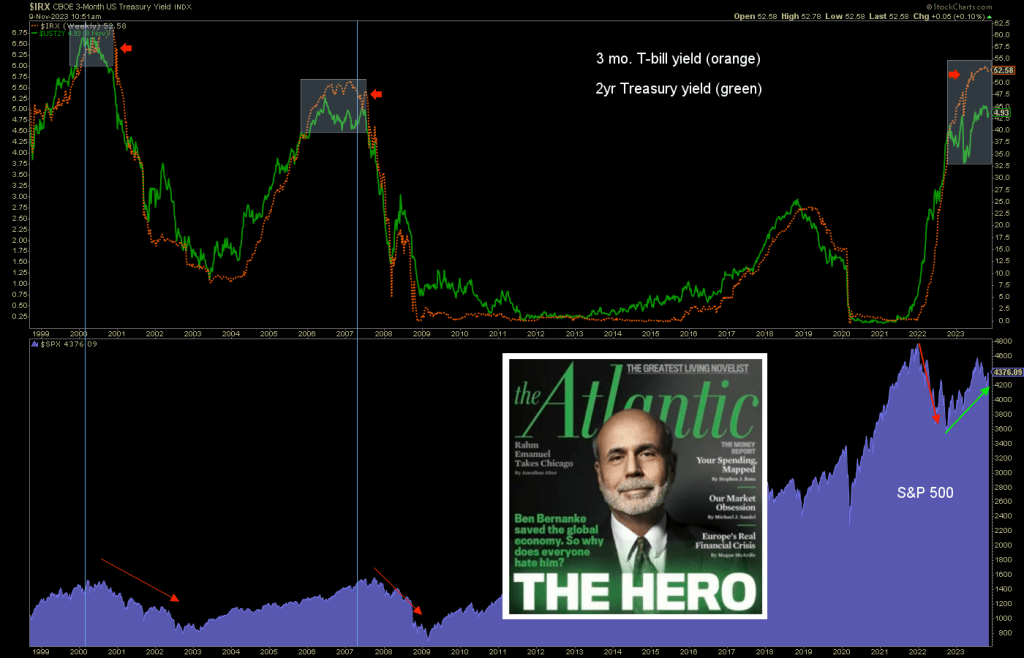
The Continuum of disinflationary signaling by the bond market, which gave license to authorities using inflation as a tool to goose the macro at will over two decades, has ended with a sharp ‘eff you’ to authorities (to put it in highly technical terms). While this is not the only indicator of a major phase change, it is the most vivid picture NFTRH has used to first illustrate the ongoing bubble phase and then mark its end in 2022. As the chart notes, something broke. And it broke but good.
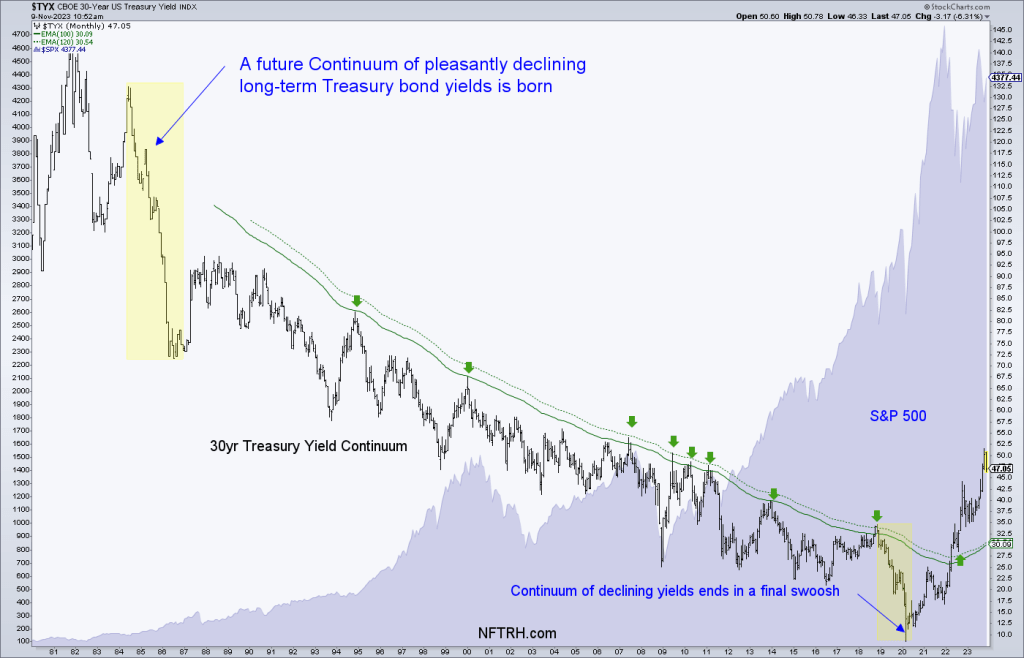
Below is the Continuum juxtaposed against the massive bubble it helped fund as it trended down for decades (bonds rose), implying no inflation problem. It was a decades long magic trick, as monetary authorities codified their increasingly ingenious manipulative processes, culminating in something called Modern Monetary Theory. As I’ve often stated, I see MMT in all its official sounding mumbo jumbo, as little more than TMM (Total Market Manipulation). It was ingenious. But it was manipulation of markets. Remote control of markets to a degree.
There was the Continuum backing it up every step of the way… until 2022. Dangerously enough, if we have changed the massive bubble phase as I believe very possible, if not likely, herds… legions of market participants (either direct or as exposed to risk by their financial advisers and/or money managers) have been trained by the previous decades to believe that the market always comes back to new highs and well beyond.
If that has changed we’re not only going to have financial revolution, but also societal discord (current) turning more virulent and chaotic. Sorry to be unvarnished about this, but it’s what the analysis says so I have to say it.
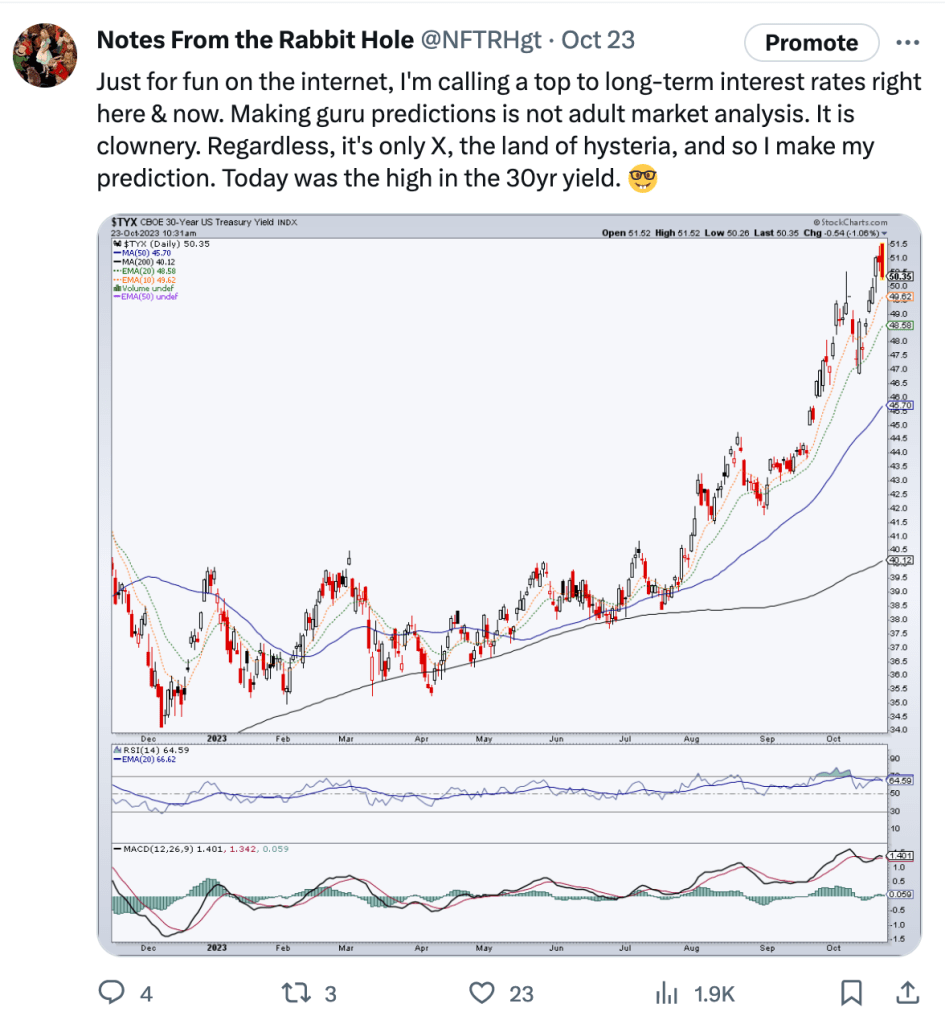
The title of this article is a little sensational in its proclamation. But we are on track to my wild-ass guess about the 30-year Treasury yield per this post on X. That high and reversal holds as the top thus far, as long-term Treasury yields have declined per expectations. This is a would-be trigger to the first phase change within the new macro. A change from disinflation to a more deflationary backdrop.
But if yields top out will that not give additional fuel to bubble participants with respect to stocks? It may. Or it may not. NFTRH anticipated the disinflationary trend of 2023, which would give a Goldilocks bid to stocks (as led by Technology). But at some point, the next part of the plan is expected to engage and that would be uncomfortably low inflation, AKA a liquidity crisis and deflation scare.
As yet, markets are in a positive seasonal period and we cannot rule out a new burst upward by broad stocks as markets perceive a softening Fed and continue to benefit from a government hell-bent on spending every last dollar in its black hole of debt.
But back on the theme of the article, a macro phase change would kill the bubble. Gold is the anti-bubble asset. What’s more, its stability would be leveraged by gold mining stocks in a favorable way, as opposed to the negative way gold’s macro under-performance was leveraged in a negative way during the long bubble phase.
The green segment of this chart shows that blessed period when most markets/assets were still in bear markets, but gold and gold stocks exited long bear markets. Gold stocks actually entered a bubble of their own in 2004 as they continued to outperform the S&P 500 while underperforming gold. Contrary to what many bugs thought and still think to this day, that was righteous signaling as gold was flat-lining against to under-performing against many cyclical markets, including gold mining cost input, crude oil.
Of course, the gold miners under-performed! It is unhealthy to believe that a cabal of evil banksters held them down. The facts were black and white. Gold mining is an industry that is impaired when inflationary policy is being used to benefit cyclical economic activity, which it was for a vast majority of the 20-year bubble. Gold miners dig the anti-bubble out of the ground. They produce the thing that stands outside the system; a system that has been corrupted by bubble making for 20 years. You see?
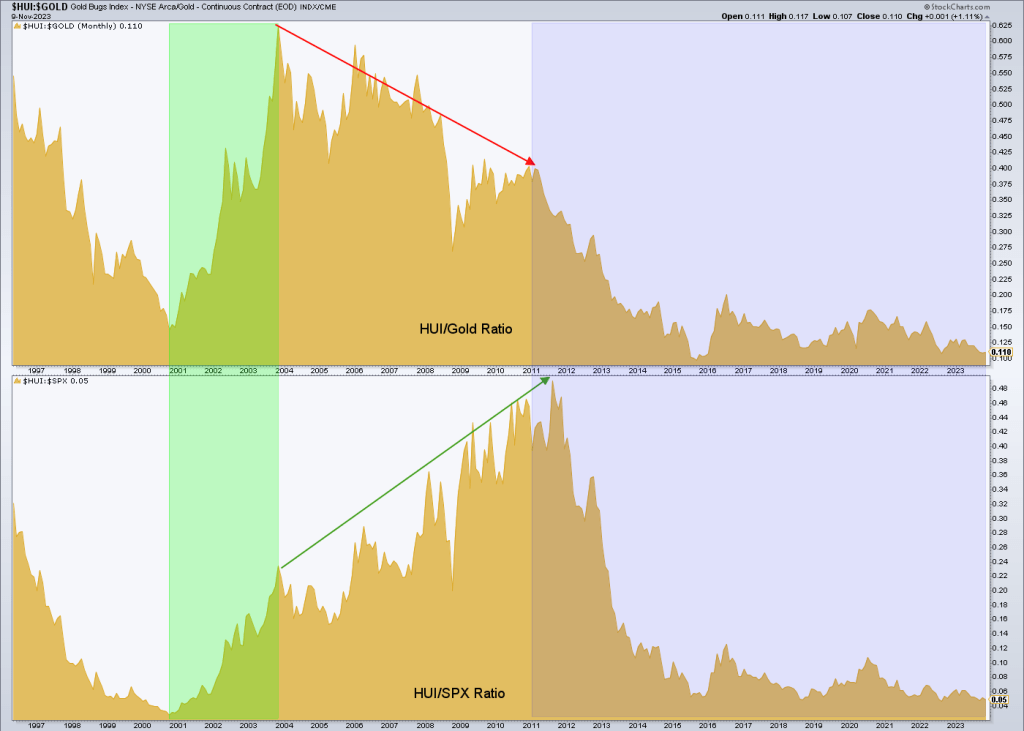
This chart implies that the stock market bull is nearing its end and with the Continuum’s signals noted above we may further extrapolate that this time there will be no bubble recovery at the hands of our inflating heroes.
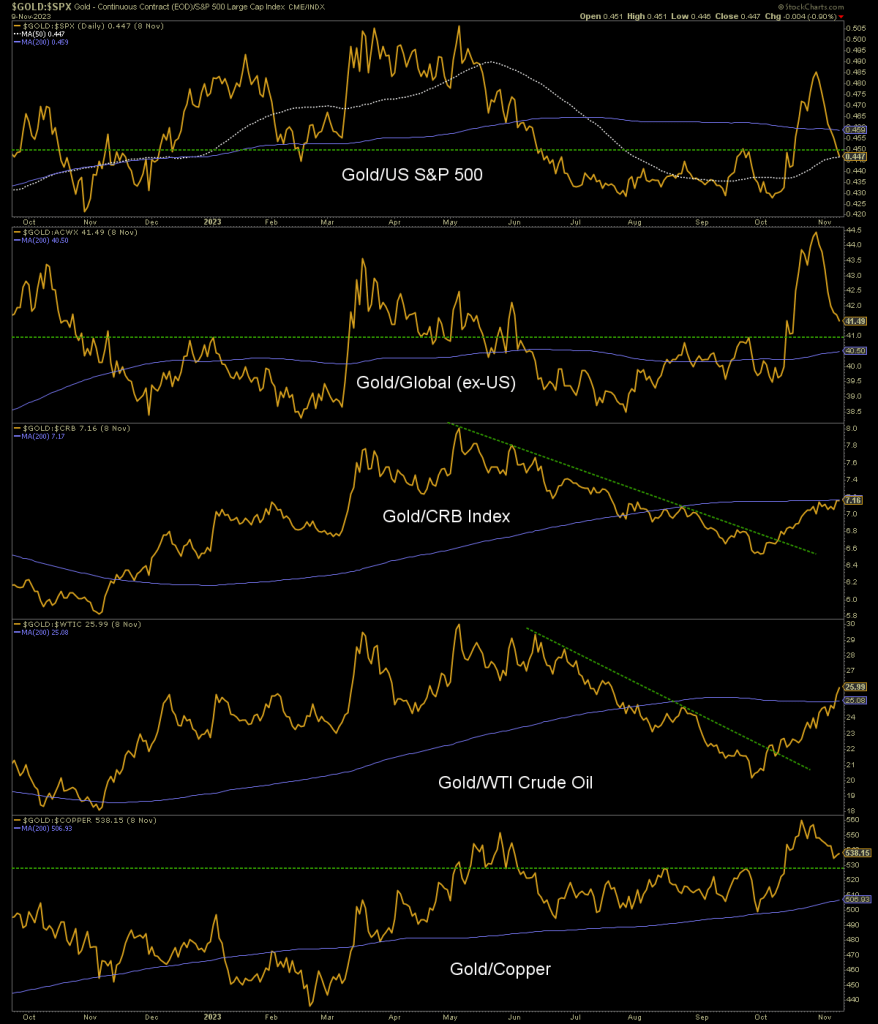
As to the here and now, we gold stock bulls will want to see gold’s ratios to stock markets stabilize and its trends vs. commodities continue to rise in order to engage a macro backdrop that will stun many with its power. Again, the macro we had for 20 years is not the macro we have today and going forward.
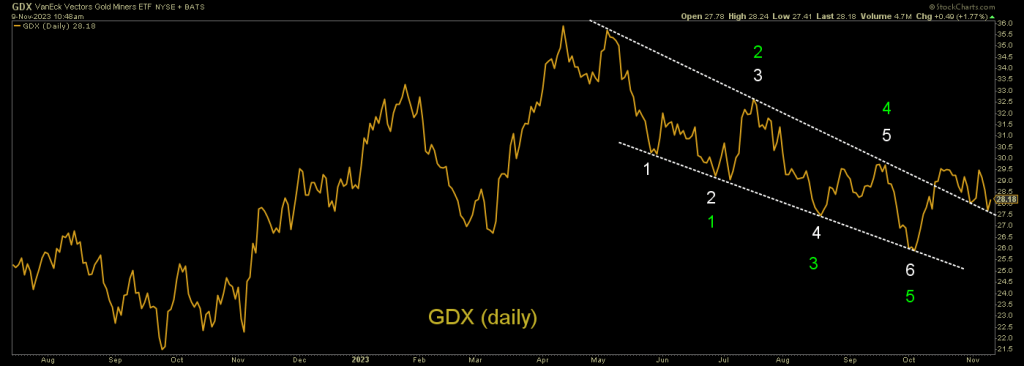
Let’s end the discussion with a simple version of the daily chart of the GDX Gold Miners ETF. A wedge with 6 touch points (TA theory says you need 5 or more) and 5 clear waves down on the correction from the May double top. We manage the sector on a weekly basis with much more detailed charts. But if this view of a potential low in place marries our preferred macro fundamental view, as is expected going forward into 2024, then the bull move in this sector, so long a hair pulling frustration of ardent supporters, is going to make heads spin.
Again, if gold’s macro leverage worked against the miners for the better part of two bubbly decades, that leverage will reverse to the upside if/as the bubble ends and gold is revalued in the public mind.
While I am being patient about the process as an analyst, I am excited as a human. Because you can wait your whole career for the type of setup that may be in play. Think about it in reverse. If you knew a 20-year bubble benefiting stocks was going to engage back in 2003 would you not have have set it and forgotten it to your eventual enrichment? The anti-bubble could work in reverse. Gold stocks are, unlike their product, speculations after all.
About the author
