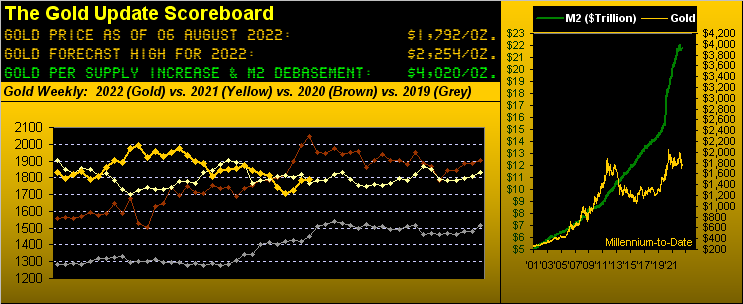
After 18 rather ingloriously agonizing weeks of Gold's "parabolic trend" being Short, it has at long last finally flipped to, well, Long. "A little drum-roll please, have a cigar, and nice to see you again sometime!"
Gold this past Monday eclipsed the week's key 1791 "flip price" toward settling yesterday (Friday) one point above that at 1792, en route achieving our sought "Hello 1800!" by reaching as high as 1812 on Thursday. Let's call that The Good News:
But you're right: with Gold nowhere remotely near our forecast high for this year of 2254, let alone the honestly-calculated currency debasement value of 4020, this remains little about which to write home. Either way, here's the graphic of Gold's weekly bars from one year ago-to-date with the rightmost blue dot heralding this new parabolic Long trend:
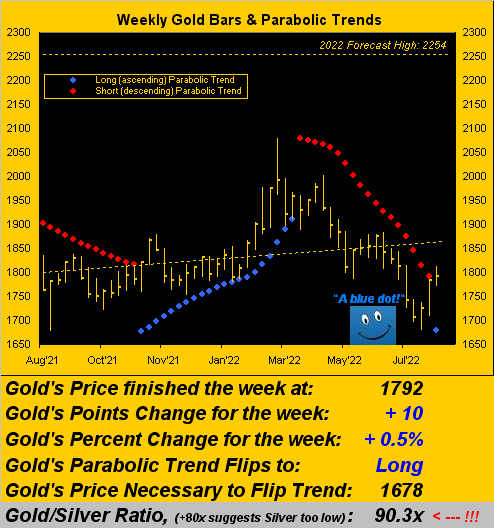
Next, let's call this The Bad News: the prior four weekly parabolic Long trends for Gold -- which extend back into the early political pre-shutdown musings over COVID -- all participated in the 1800s ... but all then succumbed back down into the 1600s. Yet is it different this time? Obviously it ought well have been different every previously darn time. As we've oft queried of late: what the heck is Gold doing down here? With purely technical disregard for Gold's fundamentals -- namely the 3Ds of Debasement, Debt and Derivatives -- here we've Gold by the day thus far in 2022:
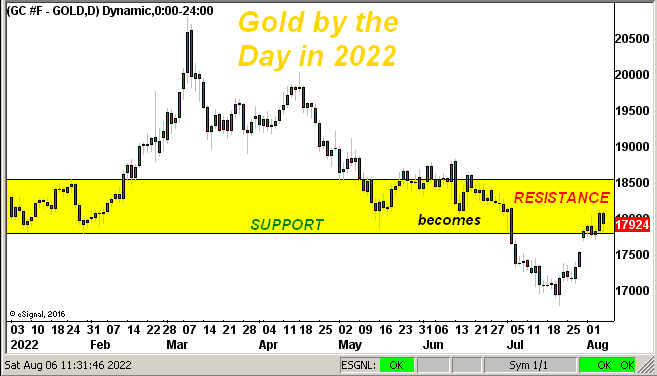
Post the UKR/RUS price spike back in March, Gold then resigned itself into the yellow 1854-1779 support zone, which upon being bust at mid-year has now become the 1779-1854 resistance zone. Clearly the "M Word" crowd keenly are aware of this, (it having become reasonably established they really do exist). And until they are bowled over by bullish participation with real price push, Gold's getting above 1854, let alone 1900, looks near-to-mid term as ![]() "The Endless Enigma"
"The Endless Enigma"![]() --[ELP, '72]. As for the above chart, why do you stare ... for we all know there's something not right about this ... 'cept that the market is never wrong.
--[ELP, '72]. As for the above chart, why do you stare ... for we all know there's something not right about this ... 'cept that the market is never wrong.
Either way, not to worry: for the recession which was declared barely a week ago has abruptly ended! Just like that! "Yeeeaaa!" Let's go right to the Economic Barometer and its rightmost blastoff:
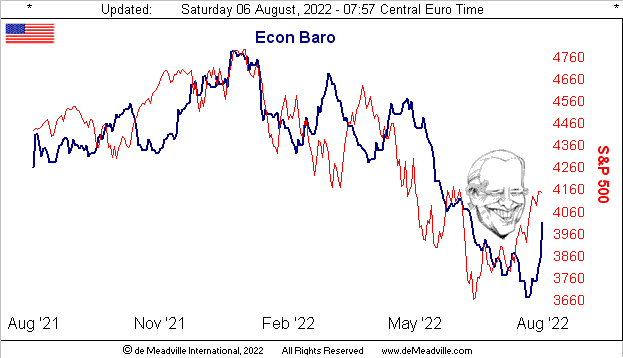
And that's one Happy Joey to be sure, right there, the StateSide President yesterday stating: "Today, we received another outstanding jobs report ... That’s the fastest job growth in history today..." Except (with all due respect to the Executive Branch) it wasn't: July's nominal growth improvement in Non-Farm Payrolls across the past 24 years (some 290 months) ranks 40th-best; or on a percentage basis (in accordance with positive nominal growth), it ranks 26th-best. Sorry Mr. Prez. However: given your arithmetically-challenged Administration along with the mathematically-vapid media, we'll allow you the benefit of the doubt.
Not to belabour (pun intended) the point, but the six-figure-salary economist crowd completely missed the boat: "consensus" sought July jobs increasing +250k, the nominal number coming in at +528k. Oops, but a good Oops. But wait, here's the uh-oh: July's Initial Jobless Claims totaled 994k, the second-highest reading year-to-date, (those in January having amounted to 1.2m). To reprise: there's something not right about this.
Still, should your political persuasion be left-of-center, the suddenly sky-rocketing Econ Baro is wonderful news. Why? Because guess what gets reported come 27 October:
"As you like to call it, mmb, the 'first peek' at Q3 GDP ..."
Exactly right, Squire. And if this robust jobs report is any indication, the "minus sign" shan't reappear in front of the Q3 number. Within seconds of the release, the "recession" shall thus formally be declared as over -- perhaps even redefined as having never existed -- and with the StateSide version of "Labour" having saved the economy, 12 days hence America goes to the polls. Or at least that's how it used to work; (hat-tip "Nobody Gets 81 Million Votes Dept.") But we digress...
Now as we've cautioned in the past, the Econ Baro is not itself an Index; rather 'tis an oscillator such that it can rise upon things getting worse more slowly. Yet absent that calculative benefit, this past week's incoming metrics mostly showed net improvements, notably in addition to July's payrolls, the month's Unemployment Rate, Hourly Earnings, Institute for Supply Management Services Index, plus for June its Factory Orders, Consumer Credit and the Trade Deficit. Only July's ISM Manufacturing Index was a mild stinker and June's Construction Spending shrank.
So in concert with the Econ Baro turning higher, Dow Jones Newswires put out that "If This Is a Recession, We Might Not Know for Months", albeit you regular readers have known it to so be these many months. In turn, (obviously a non-reader) former New York FedPrez William "Don't Be a Dud" Dudley nevertheless declared on Thursday that "almost certainly" recession is coming, (wake up, dude). More in the middle ground came Chicago FedPrez Charles "Ever Equal" Evans suggesting that FedFunds rates may increase at a more moderate pace; (although after that July Jobs data, we ought think the Fed keep its pedal to the metal. On verra...)
Meanwhile in jolly old England, its Bank warned of the United Kingdom falling into recession come Q4 such as to last throughout 2023. Fantastique foresight there!
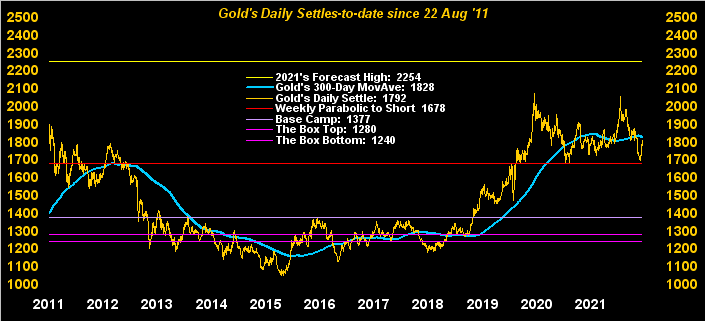
Moving on with Gold, it appears to have garnered the foresight, or better stated hindsight, of having deviated "too low" below its 300-day moving average, the bright-blue line across this next graphic of price's daily closes for the past 11 years. Note the red line (1678) as now the initial base toward protecting the new aforeshown weekly parabolic Long trend:
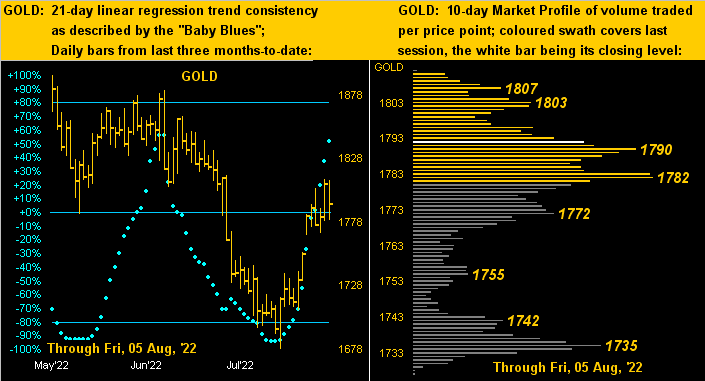
As to trend consistency, 'tis measured by the three months of blue dots on the left in the following two-panel graphic, Gold's daily bars well on the rise from the recent 1678 low; and on the right in Gold's 10-day Market Profile, price at present sits just atop the 1790-1782 volume support area:
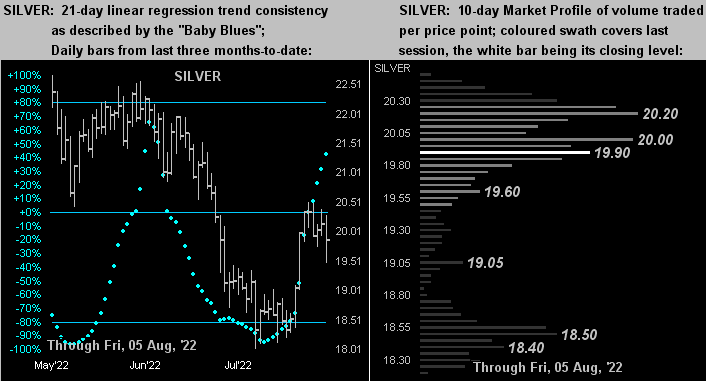
For Silver, the picture continues as nearly identical, her "Baby Blues" (below left) well on the rise, but with volume resistance (below right) above the price of 20:
Several of next week's incoming metrics have inflation implications, including July readings at both the retail and wholesale levels, along with Unit Labor Costs for Q2. Consensus suggests a slowing of inflation, and depending upon which measure one prefers, annualized results come in from 2.4% to 6.0%, (although conventional wisdom claims far higher). But are one's investments keeping pace?
■ Per the S&P 500's close for the week (4145), its yield is 1.562% and "arguably" you may never see your dough again. (Don't forget: the market capitalization of the S&P right now is $36.4 trillion, but the Stateside "M2" money supply of $21.7 trillion hardly covers that).
■ Then there's the nearly flat yield curve ranging from three-month U.S. Treasury Bills earning 2.410% up to 3.065% for the mighty 30-year U.S. Treasury Bond: at most that's a bunny slope, but at least you're supposed to receive par value at maturity.
However, neither of those really beats current inflation. Gold's compound rate of growth since Nixon nixed the Gold Standard back in '71 is 8.2%, and price today is but where it first was 11 years ago. Moreover, get out your trusty HP-12C and calculate that rate were Gold rightly priced today at its valuation of 4020. That'll get ya buyin' more Gold right now real fast!

Cheers!
...m...

