
“The inevitable never happens, it is the unexpected always.”
—John Maynard Keynes, 1st Baron Keynes, English economist whose ideas formed the basis for Keynesian economics, author of The General Theory of Employment, Interest and Money (1936); 1883–1946
“The pendulum of the mind alternates between sense and nonsense, not between right and wrong.”
—Carl Jung, Swiss psychiatrist, psychoanalyst, founded analytical psychology, collaborated with Sigmund Freud; 1875–1961
“Those who have knowledge don't predict. Those who predict don't have knowledge.”
—Lao Tzu, ancient Chinese philosopher and writer, reputed author of Tao Te Ching, the founder of philosophical Taoism, and a deity in religious Taoism and traditional Chinese religions; 6th to 4th century BCE, died late 4th century BCE
Shanghai, one of the world’s largest cities (rank #3), a major financial center (rank #4), and China’s largest city, has been in very strict lockdown since April 1 to contain the COVID Omicron variant. While there are now signs that the lockdown is easing, further lockdowns could be quickly spreading to other major Chinese cities. Westerners who feel hard done by with the lockdowns, mask mandates, and more are lucky, as objecting in China can quickly land you in prison or worse. Just getting caught outside your home can lead to quick punishment.
The lockdowns have consequences. Besides the obvious one of frustration with severe restrictions, lockdowns exacerbate the supply disruptions that have been plaguing the world for the past two years. Despite the rest of the world opening up, China takes a different tack. China has a zero-COVID strategy—meaning, any sign of increasing numbers of infections and rising visits to medical clinics results in strict lockdowns because they have worked in the past. However, the lockdowns lead to other problems such as a big drop in income for people because they are not working to difficulty getting food to people as they are not allowed to even go out to shop for food. Unsurprisingly, the result is that protests are rising. Recent easing will help but not end the problems.
China is the world’s second largest economy, representing about 14.5% of global GDP. On a purchasing power parity (PPP) basis, China is the world’s largest economy. China is also the world’s largest exporter of goods, representing almost 11% of global exports. Exports represent almost 18.5% of China’s GDP. Shanghai ranks 10th in major cities of the world by GDP and 7th on a PPP basis. China’s GDP per capita is US$14,096 where they rank 79th in the world. For the record, Russia ranks 86th. On a PPP basis, China falls to 96th while Russia rises to 77th. China ranks as one of the most unequal countries in the world with a net Gini coefficient of 51 and a wealth Gini of 79. The U.S.is not much better with a Gini of 48 and a wealth Gini of 86. Inequality reigns in the world’s two largest economies.
China stumbling on the global stage as a result of lockdowns is a problem not only for China but also for the world because of China’s importance. China also has significant natural resources. China is a world leader in gold, zinc, lead, molybdenum, iron ore, coal, tin, tungsten, rare earths (90% of the world’s resources), graphite, vanadium, and phosphate and ranks high in mine production of copper, silver, cobalt, bauxite, and manganese.
In this respect, China, like Russia, is a commodities behemoth. China just doesn’t have a lot of oil and gas as they are a large importer of both. Despite low reserves, China is the world’s 4th largest oil producer and 8th largest natural gas (NG) producer. In terms of reserves China ranks 14th in the world for oil and 10th in the world for NG. China is the world’s largest importer of oil, requiring 11.8 million BPD. The U.S. imports 9.1 million BPD. They also import 31% of their NG consumption with a heavy proportion of it coming from Russia. China also has the world’s 4th largest coal reserves. Some 56% of China’s energy needs are supplied by coal. Despite that, they still imported some 335 million tonnes in 2020. However, unofficial blockages from Australia have negatively impacted China’s coal imports and they are looking for new supplies. If anything, the COVID outbreak and lockdowns are helping to lower China’s oil consumption, which is reflected to some extent in the recent softness of oil prices.
The Russian war in Ukraine has caused some problems for China as it has for the rest of the world. China is also facing rising prices of commodities as a result of the war. Food and energy are vulnerable in China as they are everywhere else. The Russia/Ukraine war could be favourable for China. Higher prices are good for China’s commodity sector as well. China has not joined Western sanctions, but at the same time they’ve played it so that they avoid potential sanctions themselves. China expects to increase its trade with Russia. Trade between the two countries is conducted in yuan and rubles, thus avoiding U.S. sanctions against SWIFT by paying in U.S. dollars. China continues to work on its alternative to SWIFT and that appears to be nearing completion. Still, some Chinese banks are nervous about dealing with Russia for fear of U.S. sanctions. Trade between the two countries has been growing up to $26.4 billion in January/February 2022, a gain of 38.5% from a year earlier.
Trade with Russia is crucial as China needs coal that supplies some 56% of its electricity needs. The lockdowns have helped lower demand somewhat, but supplies from major coal exporting countries like Australia and Indonesia have sent China looking for replacements. Russia is a logical source for both China and Russia. The challenge is getting it there because of the lack of overland shipping routes and problems shipping by ocean.
China’s other big problem is their real estate sector. Remember Evergrande? The property giant had $300 billion in liabilities, some 2% of China’s GDP. The plan was to allow Evergrande to fail in increments to try and avoid massive contagion and a panic throughout their real estate sector. But the lockdowns are upsetting things. A financial crisis could follow if things get out of hand, impacting not only China but also spreading elsewhere in the world.
Global economic warfare is resulting in companies reexamining where they have their goods produced. China has been a go-to country. But as a result of sanctions, many are starting to think about rebuilding plants back home despite the obvious higher costs. That would be bad for China but could be a boost for the U.S.
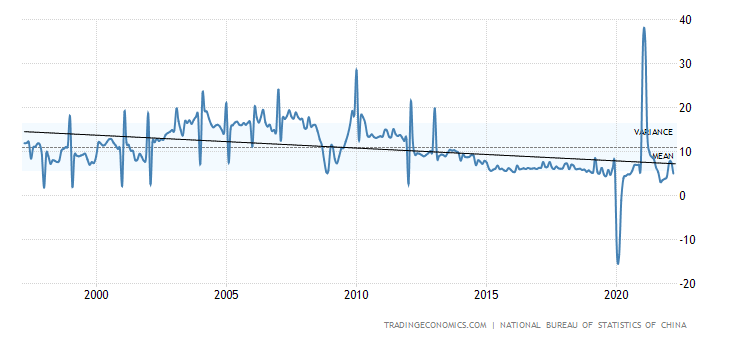
China reported Q1 growth as 4.8% year over year. This was above expectations of 4.4%. But, overall, over the past 25 years China’s GDP growth has been on a downward trend as the chart below shows. Q2 economic growth is sure to be negatively impacted by the lockdowns. Retail sales are also slipping. In March, China’s reported year-over-year growth in retail sales actually fell 3.5%.
Worse, unemployment has been rising. The latest showed that the unemployment rate for March was 5.8%, up from 5.5% the previous month. Inflation, however, remains low, up 1.5% in March from 0.9% in February. While China has continually had a rising balance of trade for the past 25 years, it has slipped of late. The latest was $47.38 billion, up from $11.8 billion in February. From 1981 to 2022 China averaged $12.43 billion in net trade. The most recent balance of trade figures improved because of falling imports. Housing prices are still rising, but the growth is slowing because of problems in the real estate sector. Industrial production is also slipping, down to 6.5% in March as COVID infections rose.
China GDP Growth - 1997–2022
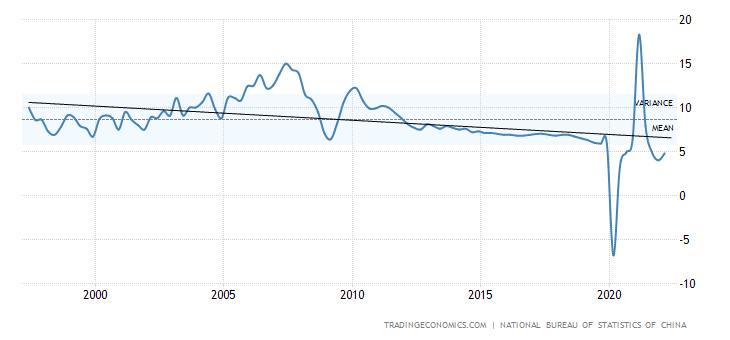
Source: www.tradingeconomics.com, www.stats.gov.cn
China Retail Sales - 1997–2022
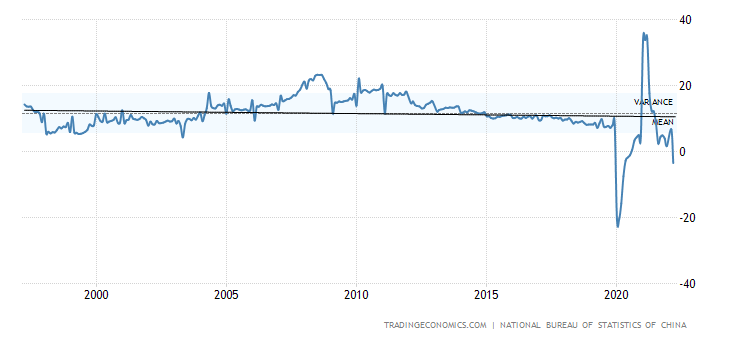
Source: www.tradingeconomics.com, www.stats.gov.cn
China Unemployment Rate – 1997–2022
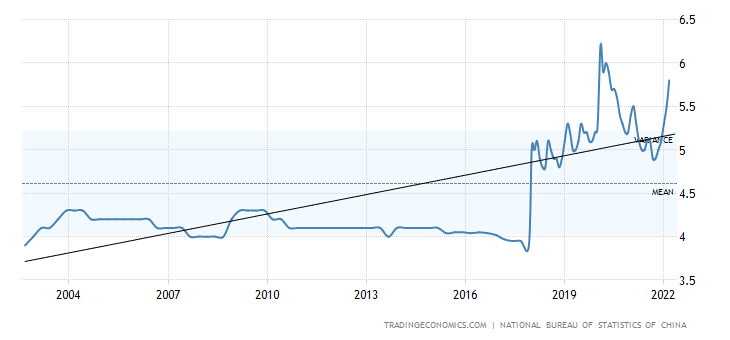
Source: www.tradingeconomics.com, www.stats.gov.cn
China Balance of Trade – 1997–2022
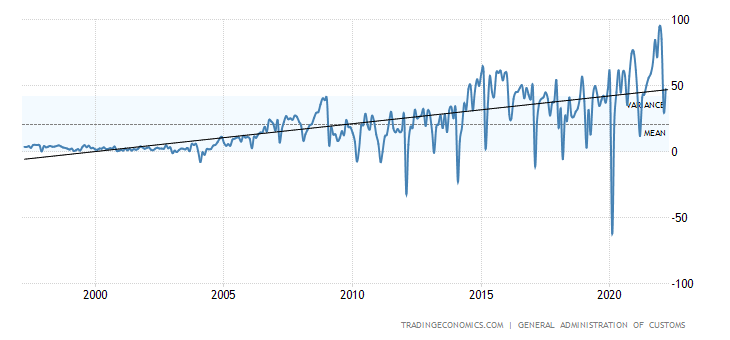
Source: www.tradingeconomics.com, www.customs.gov.cn
China Industrial Production – 1997–2022
Source: www.tradingeconomics.com, www.stats.gov.cn
The war in Ukraine has upset the global economy. Adding to the global economic woes is the slowdown in China. China remains far too important to the global economy to dismiss a slowdown as something that will only impact China. China is the largest single driver of global growth and if China slows, the rest of the world could follow. China’s brutal lockdowns are not helping matters. Other cities are also being impacted such as Shenzhen, a major electronics producer, and the port and petrochemical hub of Tianjin. Many are concerned that Beijing is next to be shut down and Beijing, like Shanghai, is too big and too important to the Chinese economy. China has had to quell protests related to the lockdowns. China is an export giant and is a major link in the global supply chain. But a shutdown of Shanghai and more is a problem as COVID cases rise, food shortages develop, factories close, and shortages of staff, particularly medical staff, rise. It doesn’t help China’s high level of censorship. A sputtering China would do the world no favours.
Our final chart below shows the sputtering Shanghai Stock Exchange (SSEC). So far, the SSEC is down 15.2% in 2022. It appears poised to move even lower. SSEC may have completed a fourth wave down. The fifth wave down could carry the SSEC down to potential targets near 2,800. The topping pattern that formed throughout 2021 has potential targets down to at least 2,900. The breakdown would be confirmed with a move to new lows below 3,023. According to the chart, Evergrande (EGRNF) is still worth 16 cents. They are probably being generous.
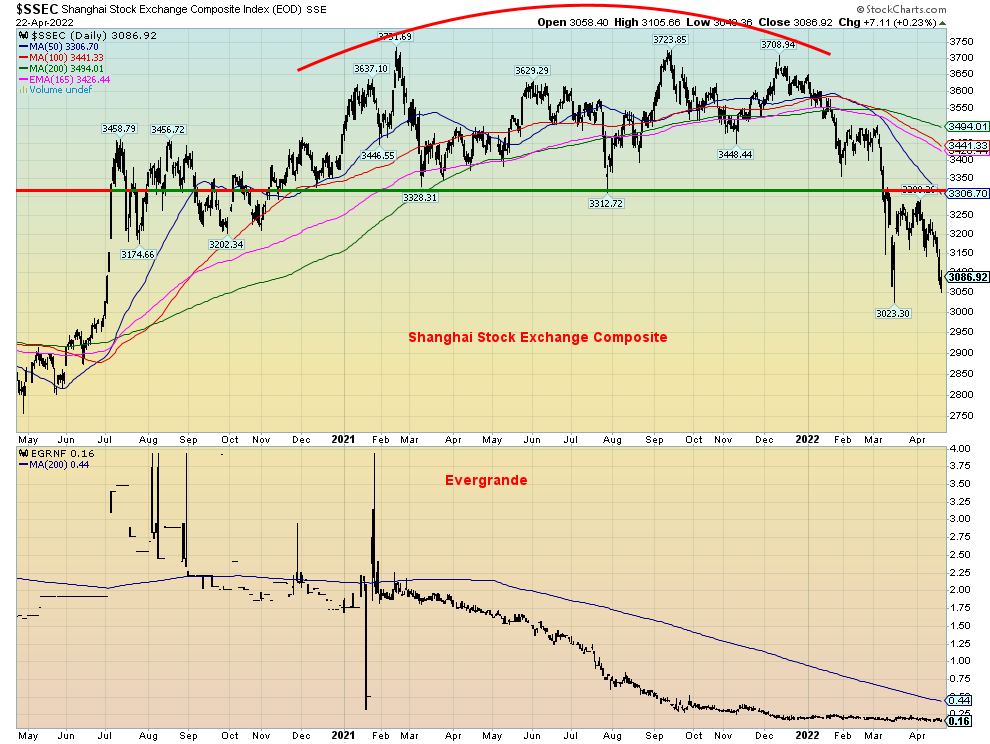
Source: www.stockcharts.com
Chart(s) of the Week
This week, rather than showing a single chart, we are showing what we consider some key money indicators. Money is what drives the economy and what drives the stock markets as well. We continue after with a few other charts and a big oopsy!
Money Aggregates M1, M2 to February 2022
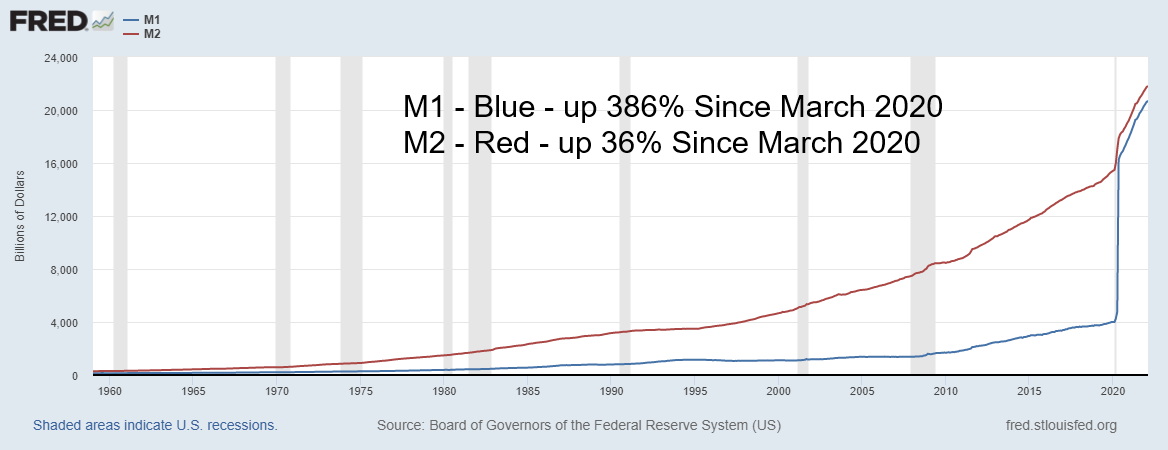
Source: www.stlouisfed.org
Since the pandemic crash of March 2020, the money aggregates have grown sharply. Although the growth pace is clearly slowing, it has not yet turned negative. Monetary growth has been a key driver of inflation. However, inflation has been exacerbated by supply disruptions and surges in demand.
Fed Balance Sheet to April 2022
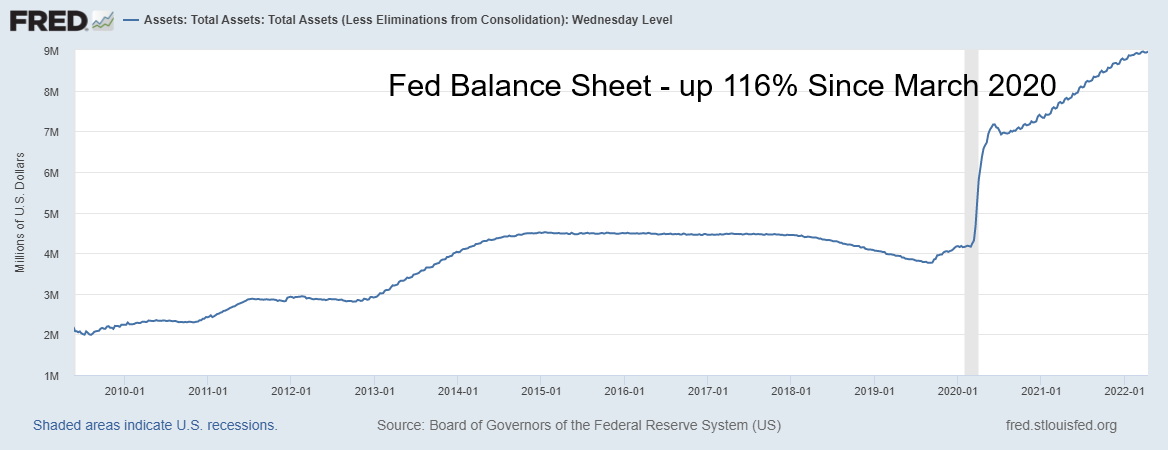
Source: www.stlouisfed.org
As with the money aggregates, the growth rate of the Fed balance sheet has slowed considerably. Little sign yet of quantitative tightening and running off $95 billion/month.
Personal Savings to February 2022
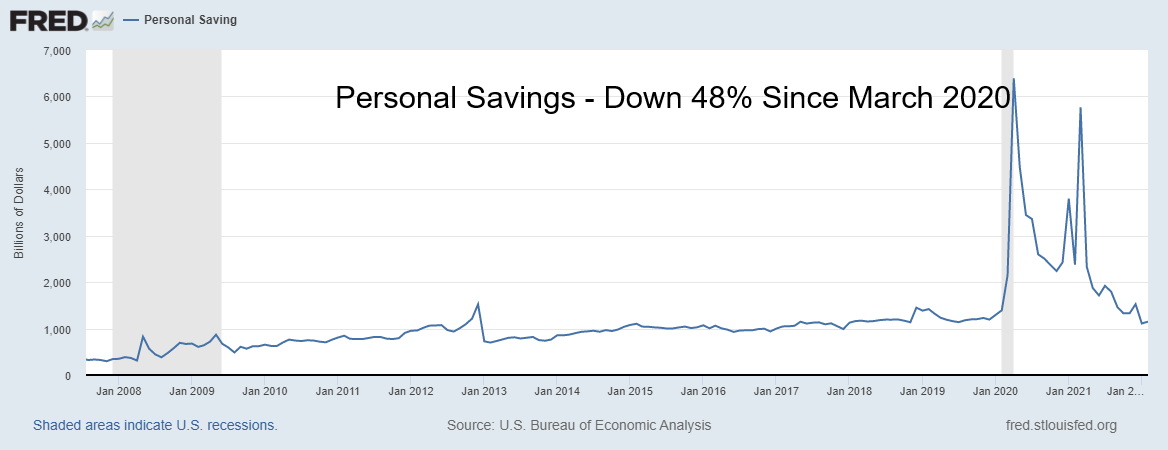
Source: www.stlouisfed.org
Personal savings soared following the March 2020 pandemic crash but have since fallen sharply. Personal savings are now sharply below where they were in March 2020. The annual rate of change has turned negative. The personal savings rate of 6.3% is more in line where it has been over the past twenty years.
S&P 500 Earnings to December 2021
Source: www.multpl.com
Corporate earnings keep on rising. This is to Q4 2021. We await Q1 2022 earnings. Indications are they should be weaker.
Debt to December 2021
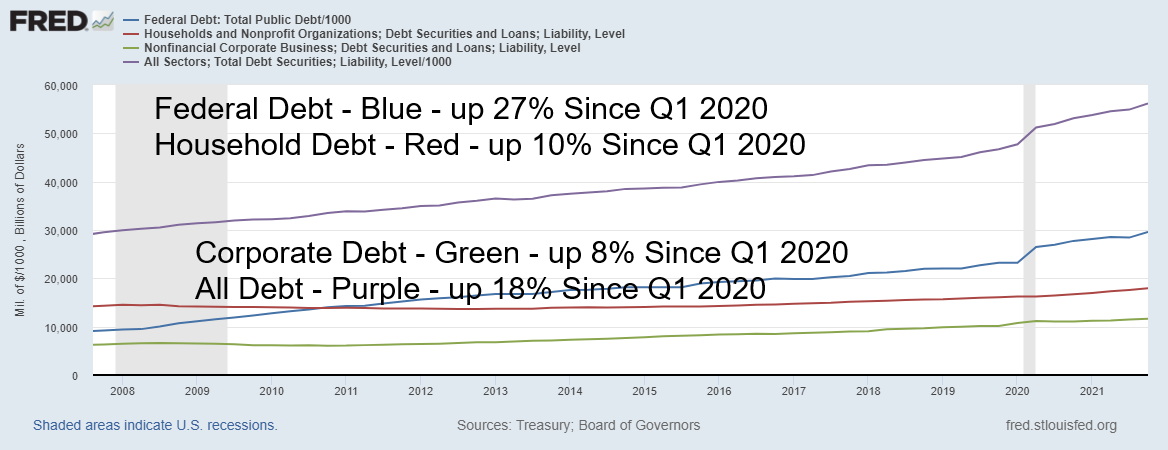
Source: www.stlouisfed.org
Debt keeps on growing; however, like the money aggregates the growth pace has slowed considerably, although it has not yet turned negative.
CPI, 10-Year, Fed Funds to April 2022
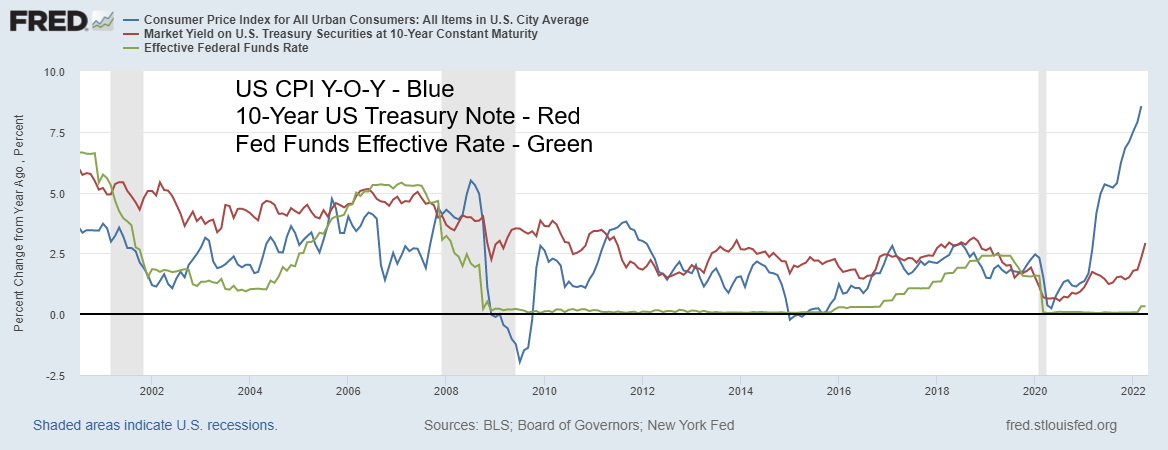
Source: www.stlouisfed.org
Some are now suggesting that the Fed will hike the Fed rate 75 bp at the May 4–5 FOMC. Despite the rumour, it’s still more likely to be 50 bp. However, the spreads are quite wide and both the 10-year Treasury note and the Fed Funds rate have considerable room to rise before they exceed the rate of inflation. The current spreads are: CPI – 10-year 5.67%; CPI – Fed Funds 8.23%. As we saw in the 1970s inflation, the Fed Funds rate will most likely have to exceed the CPI rate to bring down inflation. A recession could follow.
Canada’s Inflation Rate 1915–2022
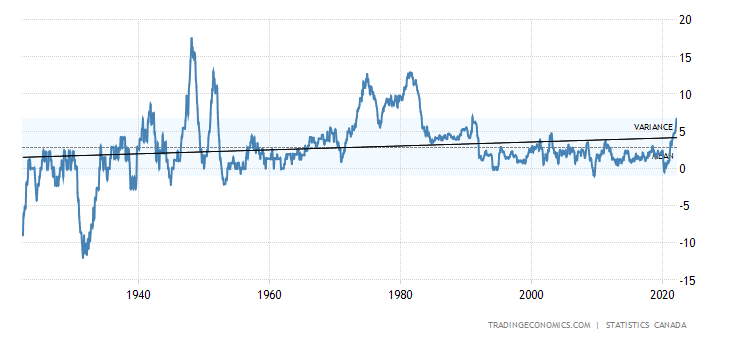
Source: www.tradingeconomics.com, www.statscan.gc.ca
Canada’s inflation rate quickened to 6.7% in March 2022, up from 5.7% the previous month and above the expected 6.1%. It was the highest rate since January 1991. Sectors that increased the fastest included transportation (+11.2%) (primarily gasoline), shelter (+6.8%), and food (+7.7%). The core inflation rate for March was 5.5% which was actually the highest on record. It was 4.8% in February. From 1915 to 2022 inflation averaged 3.1%. The all-time high was 21.6% in June 1920 and the lowest was -17.8% in June 1921. That’s interesting as inflation peaked in 1920 and then there was a short but sharp and deep depression into 1921.
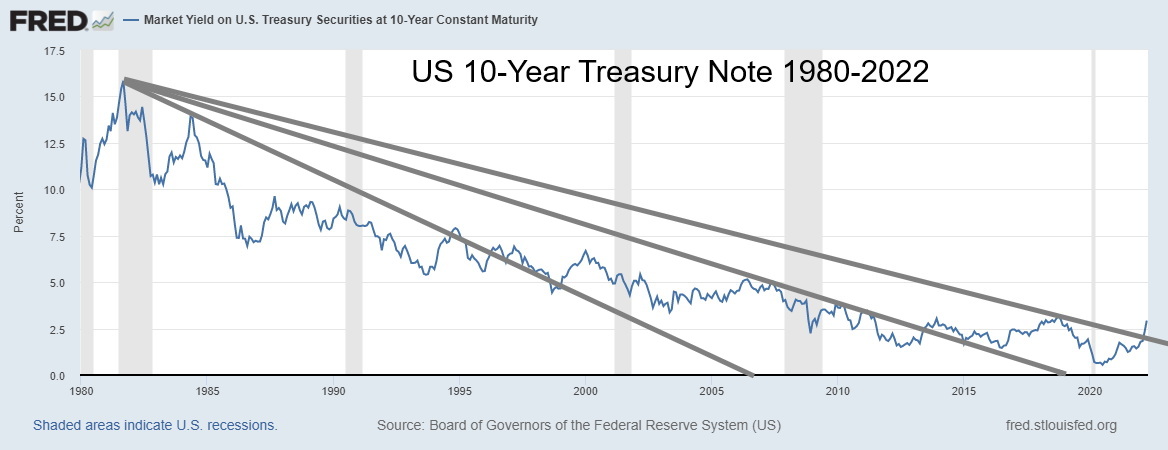
Source: www.stlouisfed.org
Are treasuries breaking out of a long downtrend? For the past 40 years yields have been on a long downward trajectory. This chart suggests those days are over. We drew what we call speedlines on the chart of the U.S. 10-year treasury note. All it does is divide the trend into thirds. Each successive break of a speedline tells us we should move to the next level. But once we break the third line it is a signal to us that the long-term downtrend is now over. We are entering a period of higher interest rates. The last time we saw that was during the 1970s. This breakout appears to be in its early stages so the trend now should be to the upside. But, like all trends, they are in stair-step formation and rises would be followed by pullbacks. The era of low interest rates, we believe, is now over. It has been a long ride.
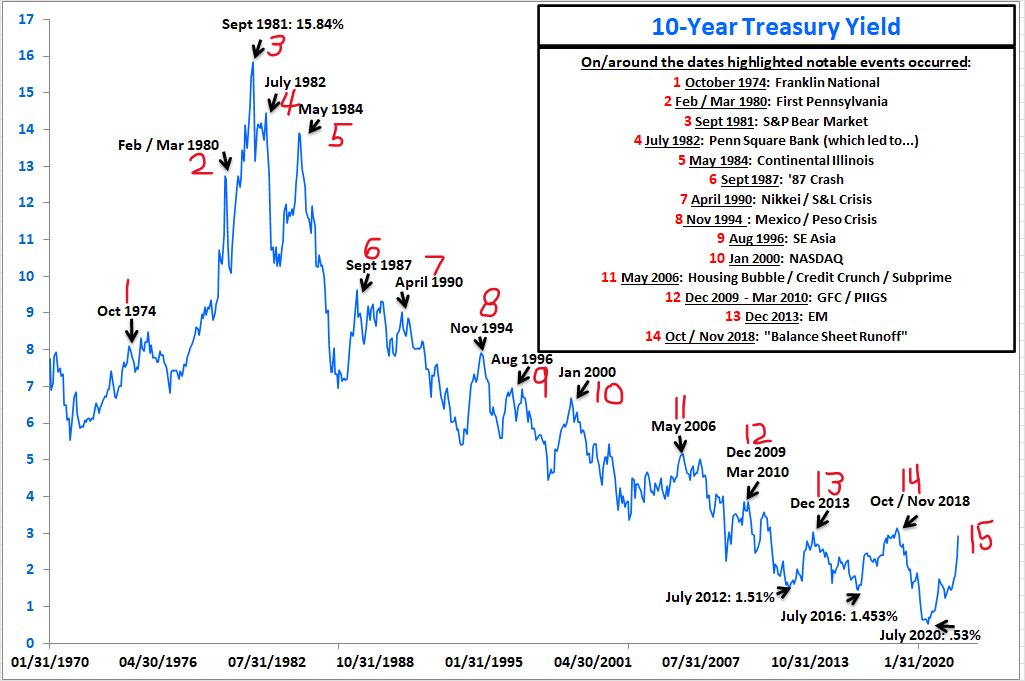
What is interesting about even the long downtrend was that every rise in treasury yields ended only when something happened to spark another drop in interest rates. Nothing has been reported, but something going amiss during a rise in yields is not unusual. Our second chart below came courtesy of Bianco Research LLC (www.biancoresearch.com). Jim Bianco has labeled what happened at each yield top. The tops yielded at least five major bankruptcies and signaled six major tops in markets, two currency crises, and the trade wars and quantitative tightening by the Fed in 2018 which was also a stock market top.
Rising interest rates have rarely ended well. We have the Fed hiking interest rates and embarking on quantitative tightening (QT). The stock market hasn’t made new highs in four months and inflation is the highest since the 1970s. What could go wrong?
Chart on next page
Source: www.biancoresearch.com
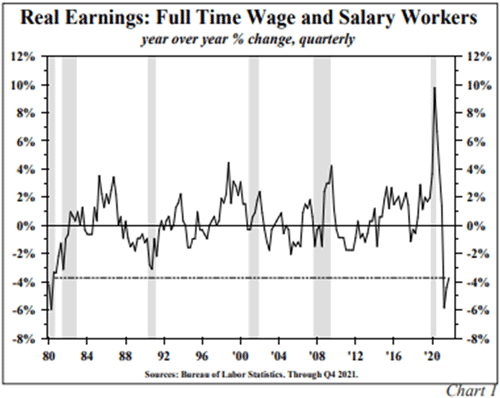
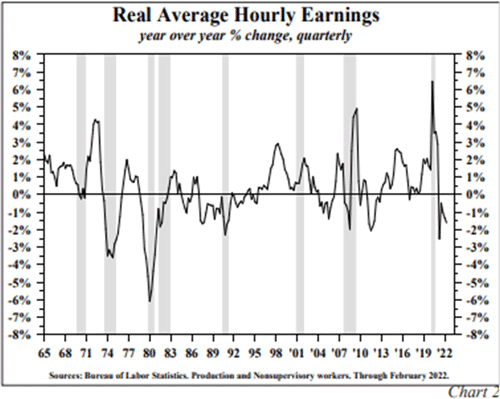
I found this too interesting to pass up. What is noted below is from Maudlin Economics (www.maudlineconomics.com) via the Hosington quarterly letter (www.hosington.com) which was recently distributed. The quotes are directly from the Hosington quarterly letter and republished in Maudlin Economics. It fits with our thoughts that salaries are starting to fall substantially behind the rate of inflation. The same would be true in Canada. Note that the drop so far is in line with what was happening in the late 1970s and into the early 1980s. It is the steepest drop since that period.
“Most Americans have suffered a substantial fall in their standard of living over the past 12 months. In the latest available 12-month change, 116.2 million American wage and salary workers suffered a 3.7% decline in their inflation-adjusted paychecks, the largest drop since 1980 (Chart 1). This alone more than offsets the gain in income going to the 6.5 million newly employed in latest 12 months. In addition, salary workers suffered a larger loss in standard of living than hourly employees (Chart 2). Inflationary damage to the 70 million retired Americans cannot be calculated in precise terms, but qualitatively the situation is not good. Those covered by Social Security received a 5.9% cost of living adjustment (COLA), however most private pensioners do not have COLAs.”
Source: www.bls.gov, www.maudlineconomics.com, www.hosington.com
“A rough estimate is that approximately 50 million or more retirees’ real income has been seriously eroded by the 40-year decade high inflation rate. Summing those whose income trailed price increases (116.2 + 50) yields a figure of approximately 170 million Americans. The sizeable adverse impact of inflation is consistent with a decline in real disposable personal income in 11 of the 13 latest months. Eighty-five percent of U.S. households make under $150,000 a year, with many living from paycheck to paycheck or on steady salaries. The imbalance between those who benefitted and those who were harmed from the monetary and fiscal policies pursued over
the last two years is abundantly clear. The 8.5% inflation rate has dramatically lowered the standard of living of over 170 million individuals.”
Source: www.bls.gov, www.maudlineconomics.com, www.hosington.com
The Big Oopsy!
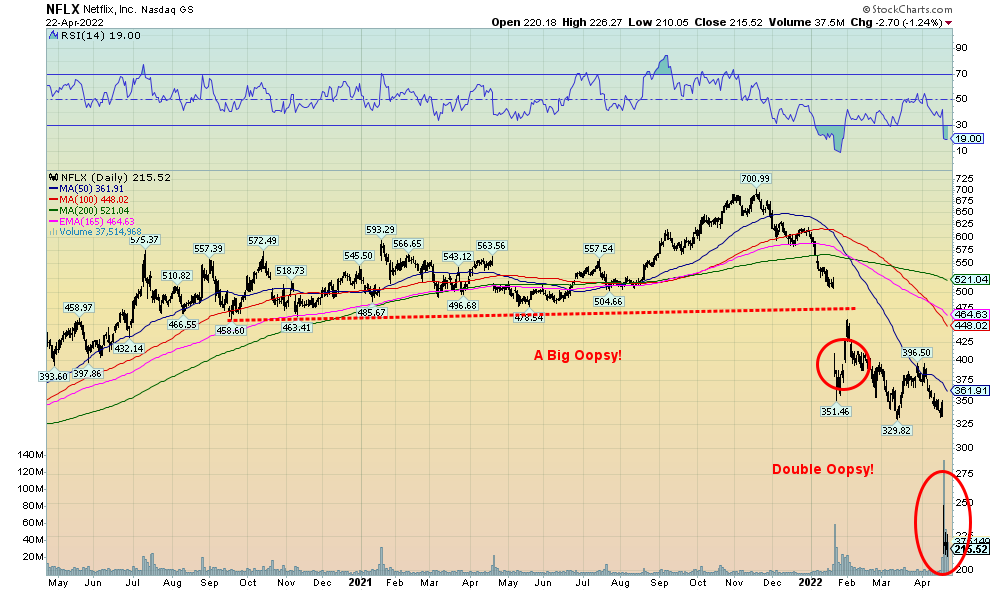
Source: www.stockcharts.com
Oops!…I did it again (with apologies to Britney Spears). Netflix (NFLX), one of the biggest stars of the FAANGs that saw it soar an incredible 60,000% from its debut in May 2002 to its peak in November 2021, has now fallen 70% from that peak. Okay, it is still up 18,250% from its humble beginnings. Not shabby. Apparently, Netflix has been losing subscribers, including some 700,000 Russians cut off. Bill Ackman, the billionaire investor and hedge fund manager of Pershing Square Capital Management, is not too happy about Netflix. He dumped his position, losing over $400 million. That’s what happens when you buy at the top. But, regardless of that, we suppose he won’t be washing dishes anywhere soon. Ackman may not have heard that Carl Icahn had made over $2 billion on Netflix in 2015. Netflix co-founder and CEO Reed Hastings also had cleaned up earlier, making over $5 billion. We can only surmise that some billionaires time their entry better.
However, there is one thing this collapse of Netflix harks us back to: the FAANGs led this market up. It has been the decade of the FAANGs. Could the FAANGs now lead it down? So far, that how it appears. It harks us back to the famous “Nifty Fifty” rally of 1972 that peaked in January 1973. After that peak the market (DJI) fell 45% over the next two years. If one wants to go back further, the period known as the Gilded Age saw the markets rise on canal and railway stocks. They peaked in 1890, then fell sharply during what was known as the Long Depression. It was long because it started in 1873 and ended in 1896. But, in between, the period known as the Gilded Age saw markets soar. Panics in 1893 and 1896 led by railways saw the markets collapse over 50%. The period known as the Roaring Twenties, led by automobiles, mass production, and radio, saw the market peak in 1929. Three years later we went from the Roaring Twenties to the Great Depression and the market (DJI) fell 89%. We’ve been through an incredible period and it was dominated by the FAANGs.
MARKETS AND TRENDS
|
|
|
|
% Gains (Losses) Trends
|
|
||||
|
|
Close Dec 31/21 |
Close Apr 22/22 |
Week |
YTD |
Daily (Short Term) |
Weekly (Intermediate) |
Monthly (Long Term) |
|
|
Stock Market Indices |
|
|
|
|
|
|
|
|
|
S&P 500 |
4,766.18 |
4,271.78 |
(2.8)% |
(10.4)% |
down |
down |
up |
|
|
Dow Jones Industrials |
36,333.30 |
33,811.40 |
(1.9)% |
(7.0)% |
neutral |
down (weak) |
up |
|
|
Dow Jones Transports |
16,478.26 |
15,067.34 |
1.5% |
(8.6)% |
down (weak) |
neutral |
up |
|
|
NASDAQ |
15,644.97 |
12,839.29 |
(3.8)% |
(17.9)% |
down |
down |
up |
|
|
S&P/TSX Composite |
21,222.84 |
21,186.38 |
(3.1)% |
(0.2)% |
down |
up |
up |
|
|
S&P/TSX Venture (CDNX) |
939.18 |
836.63 |
(6.3)% |
(10.9)% |
down |
down |
up |
|
|
S&P 600 |
1,401.71 |
1,260.43 |
(1.9)% |
(10.1)% |
down |
down |
up |
|
|
MSCI World Index |
2,354.17 |
2,175.03 |
0.6% |
(7.6)% |
neutral |
down |
up (weak) |
|
|
NYSE Bitcoin Index |
47,907.71 |
39,886.03 |
(1.4)% |
(16.7)% |
down |
down |
up |
|
|
|
|
|
|
|
|
|
|
|
|
Gold Mining Stock Indices |
|
|
|
|
|
|
|
|
|
Gold Bugs Index (HUI) |
258.87 |
300.11 (new highs) |
(9.3)% |
15.9% |
down |
up |
up |
|
|
TSX Gold Index (TGD) |
292.16 |
341.88 (new highs) |
(7.9)% |
17.0% |
down |
up |
up |
|
|
|
|
|
|
|
|
|
|
|
|
Fixed Income Yields/Spreads |
|
|
|
|
|
|
|
|
|
U.S. 10-Year Treasury Bond yield |
1.52% |
2.90% (new highs) |
2.5% |
90.8% |
|
|
|
|
|
Cdn. 10-Year Bond CGB yield |
1.43% |
2.88% (new highs) |
3.6% |
101.4% |
|
|
|
|
|
Recession Watch Spreads |
|
|
|
|
|
|
|
|
|
U.S. 2-year 10-year Treasury spread |
0.79% |
0.23% |
(37.8)% |
(70.9)% |
|
|
|
|
|
Cdn 2-year 10-year CGB spread |
0.48% |
0.24% |
(33.3)% |
(50.0)% |
|
|
|
|
|
|
|
|
|
|
|
|
|
|
|
Currencies |
|
|
|
|
|
|
|
|
|
US$ Index |
95.59 |
101.21 (new highs) |
0.9% |
5.9% |
up |
up |
up |
|
|
Canadian $ |
.7905 |
0.7858 |
(0.9)% |
(0.6)% |
down (weak) |
neutral |
up |
|
|
Euro |
113.74 |
107.96 |
(0.3)% |
(5.1)% |
down |
down |
down |
|
|
Swiss Franc |
109.77 |
104.53 (new lows) |
(1.5)% |
(4.8)% |
down |
down |
neutral |
|
|
British Pound |
135.45 |
128.35 (new lows) |
(1.9)% |
(5.2)% |
down |
down |
down (weak) |
|
|
Japanese Yen |
86.85 |
77.82 (new lows) |
(2.0)% |
(10.4)% |
down |
down |
down |
|
|
|
|
|
|
|
|
|
|
|
|
|
|
|
|
|
|
|
|
|
|
Precious Metals |
|
|
|
|
|
|
|
|
|
Gold |
1,828.60 |
1,934.30 |
(2.1)% |
5.8% |
down (weak) |
up |
up |
|
|
Silver |
23.35 |
24.26 |
(5.6)% |
3.9% |
down |
up |
up |
|
|
Platinum |
966.20 |
927.40 |
(6.7)% |
(4.0)% |
down |
down |
neutral |
|
|
|
|
|
|
|
|
|
|
|
|
Base Metals |
|
|
|
|
|
|
|
|
|
Palladium |
1,912.10 |
2,376.30 |
0.9% |
24.3% |
down (weak) |
up (weak) |
up |
|
|
Copper |
4.46 |
4.58 |
(3.0)% |
2.6% |
down |
up |
up |
|
|
|
|
|
|
|
|
|
|
|
|
Energy |
|
|
|
|
|
|
|
|
|
WTI Oil |
75.21 |
102.07 |
(4.6)% |
35.7% |
down (weak) |
up |
up |
|
|
Natural Gas |
3.73 |
6.66 |
(8.8)% |
76.6% |
up |
up |
up |
|
|
|
|
|
|
|
|
|
|
|
Source: www.stockcharts.com, David Chapman
Source: www.stockcharts.com, David Chapman
Note: For an explanation of the trends, see the glossary at the end of this article.
New highs/lows refer to new 52-week highs/lows and, in some cases, all-time highs.
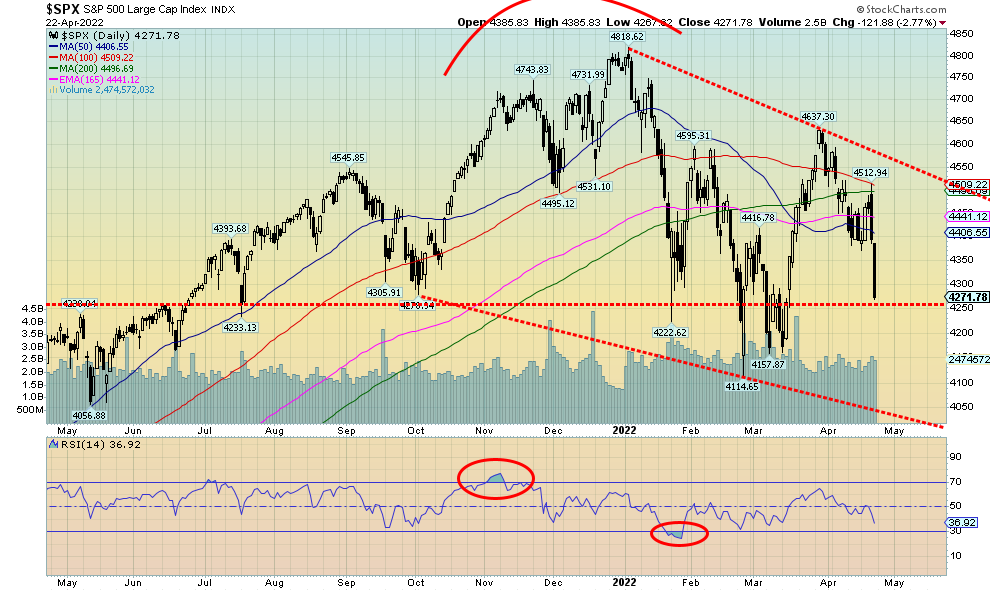
Source: www.stockcharts.com
In the early part of the week, we were reading some chatter that the stock indices could be on their way to recovering further, taking out recent highs to move and challenge the all-time highs seen in early January. Not so fast. The market had other ideas. A hawkish Fed, led by Fed Chairman Jerome Powell noting that taming inflation is absolutely essential spooked the markets. A 50 bp hike is for sure, it seems, but now there is considerable chatter of a 75 bp hike. Bonds reacted negatively and the 10-year jumped to its highest level since 2018. Weakening sentiment for oil helped push energy stocks lower and the materials led by golds and metals and mining were hammered down. On Friday the Dow Jones Industrials (DJI) suffered its worst one-day drop since the pandemic in March 2020. It was the fourth consecutive weekly decline for stocks.
On the week the S&P 500 lost 2.8%, the S&P 500 Equal Weight was down 2.0%, the DJI dropped 1.9% but the Dow Jones Transportations (DJT), buoyed by a possible oil decline coupled with increased demand with pandemic mandates dropped, jumped 1.5% for the only winner. The NASDAQ fell 3.8%, the small cap S&P 600 was off 1.9%, the mid-cap S&P 400 fell 1.7%, the TSX Composite lost 3.1%, and the TSX Venture Exchange (CDNX) fell 6.3%. In the EU, the London FTSE fell 1.7%, the Paris CAC 40 reversed but closed down only 0.1%, while the German DAX dropped just under 0.2%. There was no joy in Asia as China’s Shanghai Index (SSEC) fell 4.3% and the Tokyo Nikkei Dow (TKN) dropped about 0.3%. Bitcoin couldn’t rally either, losing 1.4% and dropping back under $40,000.
Indicators gave us little joy either as volatility rose: the S&P 500 Bullish Percent Index (BPSPX) fell to 56% but remains for the moment above its February low and the NYSE advance/decline line fell in line with the S&P 500. The number of S&P 500 stocks trading above their 200-day MA fell to 44.5%, while the number of stocks above their 50-day MA was at 43.7%. If there is a glimmer of hope it was the put/call ratio that soared to 0.87%, the highest level seen since January 2022 but really the highest level seen since the pandemic crash of March 2020. That could be encouraging, because if the market becomes too bearish, then the odds start to favour the bulls. The put/call ratio is also making new highs even as the S&P 500 has not yet made new lows, a possible divergence. So, there is some encouraging news here.
The 900-point drop for the DJI on Friday was unnerving. Friday was a 90% down day. Not one DJI component closed higher and only 3% of the S&P 500 stocks were up on the day. This appears to be the start of our third wave down or possible C wave down. We could see new lows below the February low of 4,115. A break under 4,240 (not far away) would suggest new lows ahead. Only regaining above 4,500 might suggest that a low is in at this point. A number of indices have entered bear market territory, including the NASDAQ and the Russell 2000. Surprisingly, the small cap indices are down but generally holding well, possibly diverging from the large cap indices.
Bearish sentiment is rising, some indices have dropped into official bear markets, volatility is also rising, and most indices appear poised to see new lows. However, some of these indicators also indicate we could be nearing a bottom. The RSI is at 36 so it could fall further to under 30 which gives a better entry level. April is supposed to be the best month of the year, but maybe “sell in May and go away” is coming early this year. The worst April on record was April 1970 when the S&P 500 fell 9.0%. So far this April the S&P 500 is down 5.7%. Could April 2022 be worse than April 1970? We have another week to go.
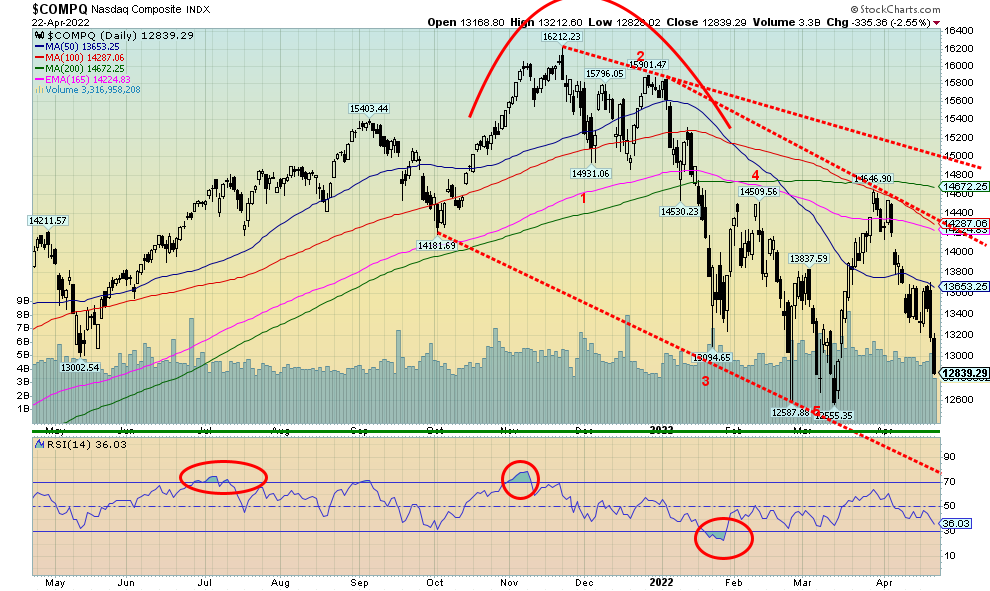
Source: www.stockcharts.com
The NASDAQ had a miserable week, losing 3.8%. The NASDAQ is now down 17.9% on the year and down 20.8% from its early January high (officially a bear market). The FAANGs are miserable. What led the market up is now leading the market down. The NY FANG Plus Index is now down 32.2% from its high last November 2021. On the year, the index is down 24.4% and sits just shy of making new 52-week lows. The FAANGs are in a bear market. This past week Facebook (Meta) hit 52-week lows, losing 12.4%, Apple lost 2.1%, Amazon was down 4.9%, Google off 6.0%, Microsoft dropped 2.1%, Baidu down 11.6%, Alibaba off 9.4%, and Nvidia dropped 8.2%. But the real dog of the week was Netflix, losing an astounding 36.8%. It wins the Dog of the Week award. Were there winners? Yes, Tesla jumped 2.0% and as Elon Musk continues to pursue Twitter, it held up and gained 8.5%. If it was any consolation for the FAANGs, the ultimate value stock Berkshire Hathaway dropped 2.1%. Berkshire is now down 7.2% from its major high at the end of March. With the drop this past week we now expect new lows for the NASDAQ. A break to new lows could suggest that the NASDAQ could fall even further with potential targets down to as low as 10,500. That would put the NASDAQ down 35% from its all-time high in early January. Regaining above 13,700 would give some hope that we could be starting a recovery.
Source: www.stockcharts.com
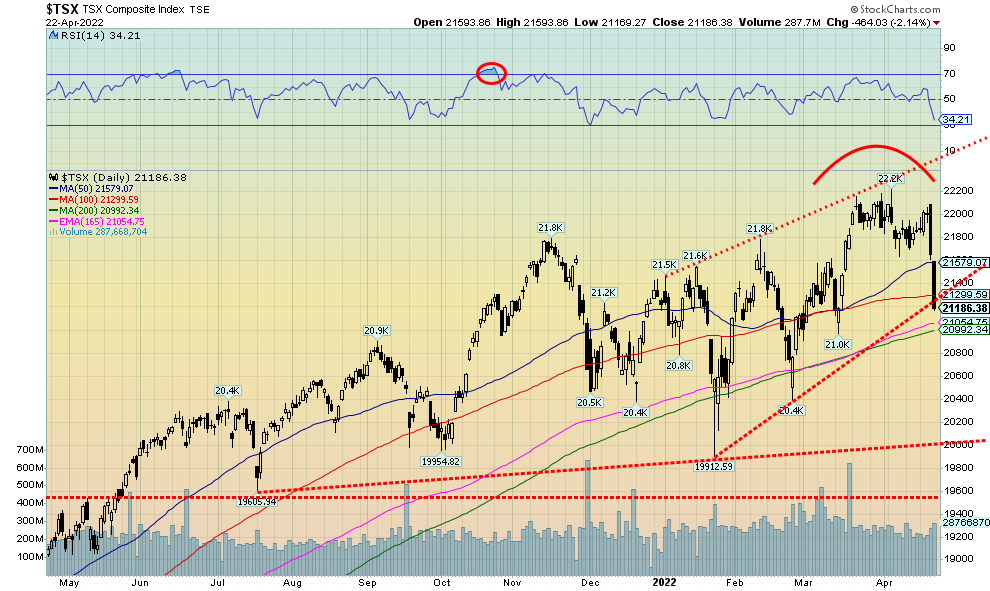
The TSX Composite was hit this past week, falling the most we’ve seen since December 2021. This past week the TSX lost 3.1%, pushing the index into negative territory, down about 0.2% on the year. The TSX Venture Exchange (CDNX) was also hit, losing 6.3%. The TSX also appears to be breaking an uptrend line from January. The 200-day MA support is just below near 21,000. A breakdown under 21,000 could prove more problematic and we could see even lower prices. Not one TSX sub-index was able to stay in the black this past week. Previous stars also gave off disturbing signals, making new highs and then reversing to close sharply lower. Energy (TEN) made new highs, reversed, and then closed down 2.7% on the week. Metals and Mining (TGM) lost a sharp 10.7% although it didn’t make new highs. Materials (TMT) did make new highs, then closed down 7.0%. Telecommunications (TTS) also made new highs and closed down 1.1%. Other big losers this past week included Gold (TGD), down 7.9%, Health Care (THC), down 7.9%, and Information Technology (TKK), which continues to get hammered, down 8.1%. Not a good week. We need to regain back above 21,600 to start to suggest that the downswing might be over. But the drop was disturbing and our expectation is lower again this coming week.
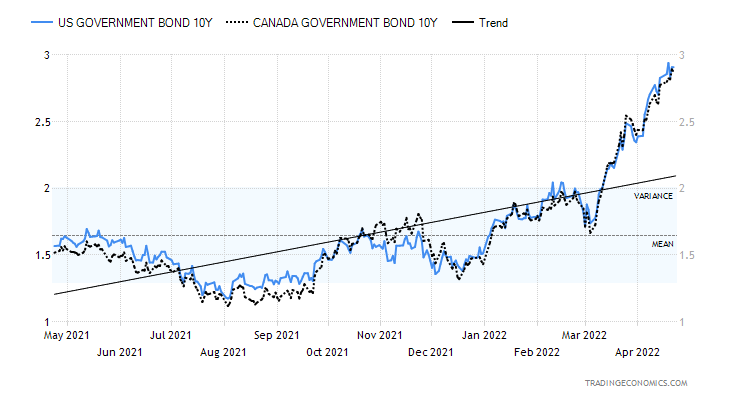
U.S. 10-year Treasury Bond/Canadian 10-year Government Bond (CGB)
Source: www.tradingeconomics.com, www.home.treasury.gov, www.bankofcanada.ca
The U.S. 10-year treasury note hit its highest level since November 2018. At the time the 10-year peaked at 3.23%. But now there is some fear in the air as a hawkish Fed is hinting that a 75 bp hike at the May 4–5 FOMC is possible. This past week economic numbers were mixed but tended to point to some weakening. Existing home sales fell 2.7% in March, the Philadelphia Fed Manufacturing Index came in at 17.6 vs an expectation of 21, while weekly jobless claims were at 184,000, slightly above the expected 180,000. But the Global Manufacturing PMI came in at a somewhat robust 59.7, above the expected 58. Definitely not flashing recession. The Canadian 10-year Government of Canada bond (CGB) also rose this past week to 2.88%. But the 2–10 spread slipped lower this week after jumping the previous week. The U.S. 2–10 spread was 0.23% vs. 0.37 the previous week and the Canadian 2–10 spread was 0.24% vs. 0.36% the previous week. Neither spread is what we would term forecasting a recession territory. We need to see the spread go negative. And in particular we need to see the 3-month–10-year spread also go negative. It remains at a robust 2.07% which is as high as it has been since 2016. Nowhere near the -0.52% seen in August 2019 that correctly forecasted the coming recession that was triggered by the pandemic. Right now, we see little stopping the 10-year from hitting 3.00% and possibly higher. We’d have to drop back under 2.70% to suggest that we may have seen the high.
Source: www.stockcharts.com
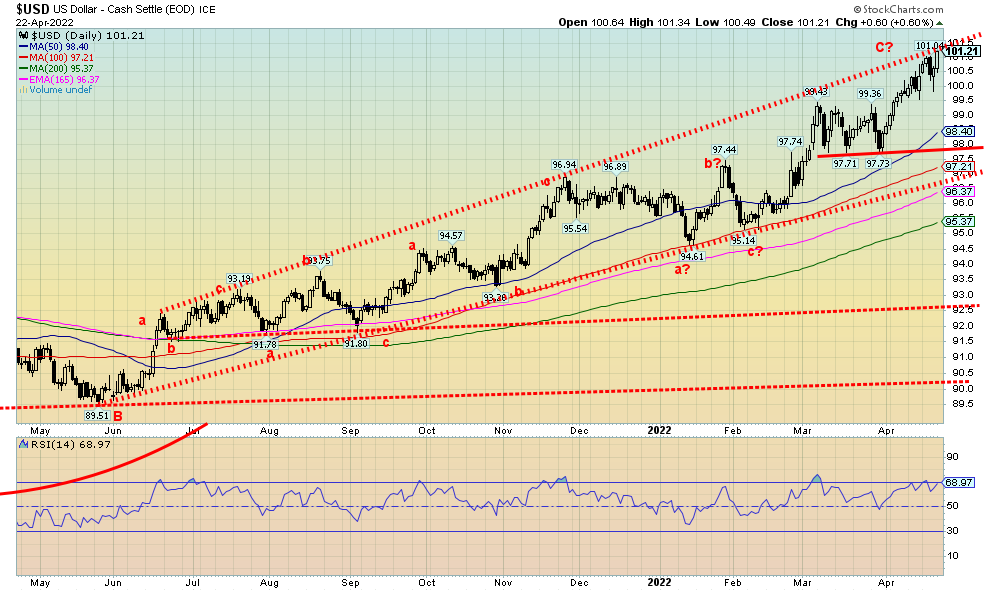
Once again, the soaring US$ Index hit fresh 52-week highs as funds continue to flee the EU, Japan, and now even the U.K. The go-to choice is the U.S. dollar and usually parked in U.S. treasury securities. U.S. treasuries continue to yield higher than what you can get in the EU and Japan in particular; hence the attractiveness of the U.S. dollar and U.S. treasury securities. Other currencies were down with the euro off 0.3%, not quite hitting fresh 52-week lows but all the other currencies did hit fresh 52-week lows. The Swiss franc lost 1.5%, the pound sterling was down 1.9%, while the Japanese yen dropped a sharp 2.0% and appears to be in a free fall. Japan has refused to budge on interest rates and their economy is start to show signs of cooling considerably. High energy prices are also hurting Japan as they are highly dependent on imported oil and gas. The Canadian dollar also fell, down 0.9% and is now down 0.6% on the year.
Despite the rise for the US$ Index this past week, we once again have hit the top of the bull channel. What we need now is a retreat from that high this coming week. We have taken highs seen way back in April/May 2020 and that could suggest we could see a rise towards the 2020 spike high of 104. To the downside, a break back under 100 would be positive, but we really need to see a break under 99 to convince us that the dollar rally is over.
Source: www.stockcharts.com
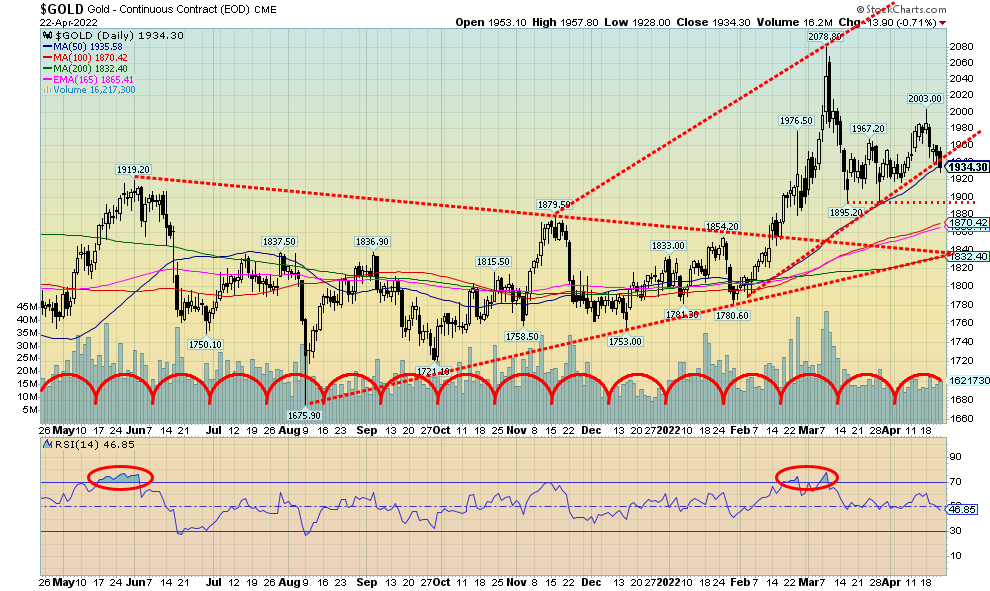
The metals did not enjoy a positive week. Gold fell 2.1% after probing above $2,000, then promptly fell 3.4% over the next four days. Silver fared worse, falling 5.6%, platinum was down 6.7%, but palladium hung on gaining 0.9%. Copper also fell down about 3.0%. But it was the gold stocks that really suffered as the Gold Bugs Index (HUI) fell 9.3% and the TSX Gold Index (TGD) was down 7.9%. While there are many positive reasons gold should be rising in this inflationary period, instead gold fell, spooked by a hawkish Fed and talk of a 75 bp hike in the Fed rate at the May 4–5 FOMC meetings. Not helping was the US$ Index once again hitting fresh 52-week highs and the U.S. 10-year treasury note also hitting fresh 52-week highs just under 3%.
While the Fed appears to be turning more hawkish, hiking interest rates further could risk triggering a slowdown in the economy and even help push the economy into a recession. Coupled with inflation, that would translate into stagflation—rising inflation and a slowing economy. Gold appears to be breaking a support line as it also tests the 50-day MA. Clear support is seen down to $1,900 but a break under that level would be negative. The next good support is not seen until $1,870 and then down to $1,830. Under $1,830 the gold rally is officially over. Many continue to give quite valid arguments that gold is going to go much higher. And longer term charts still support that view. But the short-term picture has been clouded by the weak performance this past week. The result is that the short-term trend has turned down for gold and silver although the weekly intermediate up trend remains intact.
We need to regain above and close above $2,000 to convince us that we are headed higher. A move above $2,035 would confirm a move to new highs above $2,078 the most recent high. Despite the weakness this past week, demand appears to be good with demand from gold dealers, asset managers seeking to hedge against inflation, potential lower growth, geopolitical concerns, and the now high volatility for the stock and bond markets.
Our usual source for the COT appears not to have updated this past week. But we did look at the CFTC report, which we admit can appear daunting to most users, and the commercial COT (bullion companies and banks) reported that longs rose roughly 3,500 contracts and shorts fell over 9,000 contracts. That left the commercial COT at 24%, up from 23% the previous week. Overall open interest fell over 2,400 contracts. The large speculators COT (hedge funds, managed futures, etc.) saw them shed roughly 7,400 longs and add over 7,000 shorts. This is what we would expect from the large speculators when the market falls. However, overall, we view this past week’s report as somewhat positive.
Source: www.stockcharts.com
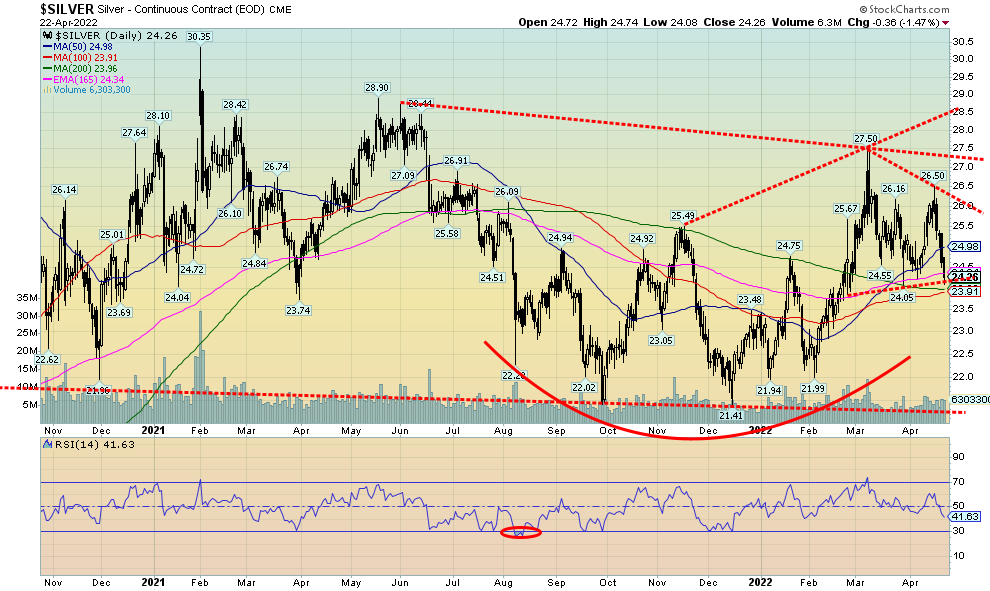
Silver, like gold, took it on the chin this past week, falling a sharp 5.6%. Overall, silver has actually fallen some 8% in just four days after touching a high early in the week at $26.50. Silver may be in the process of completing what could be an ABC correction to the up move that started at $21.99 in February and topped at $27.50 in March. If that is correct, we should terminate shortly but may briefly go under $24 support. We would then need to regain back above $25 to confirm a possible low. If instead a more severe correction is at hand, then we would likely close below $24 on multiple days and fall towards $23. A move below $23, however, would be terminal and we would expect new lows below $22. Our problem right now is while the recent action all looks corrective, we remained bothered by divergences between gold and silver. The main divergence is gold making new highs but not being confirmed by silver. Always a negative sign. As with gold, for whatever reason our usual source for the COT reports has not updated. But checking the CFTC report we note that commercial longs rose roughly 3,500 contracts this past week but shorts also were up about 3,200 contracts. That left the commercial COT at about 32% vs. 31% the previous week. We consider that mildly positive. However, open interest rose on a down week which is somewhat negative. A mixed silver COT report.
Source: www.stockcharts.com
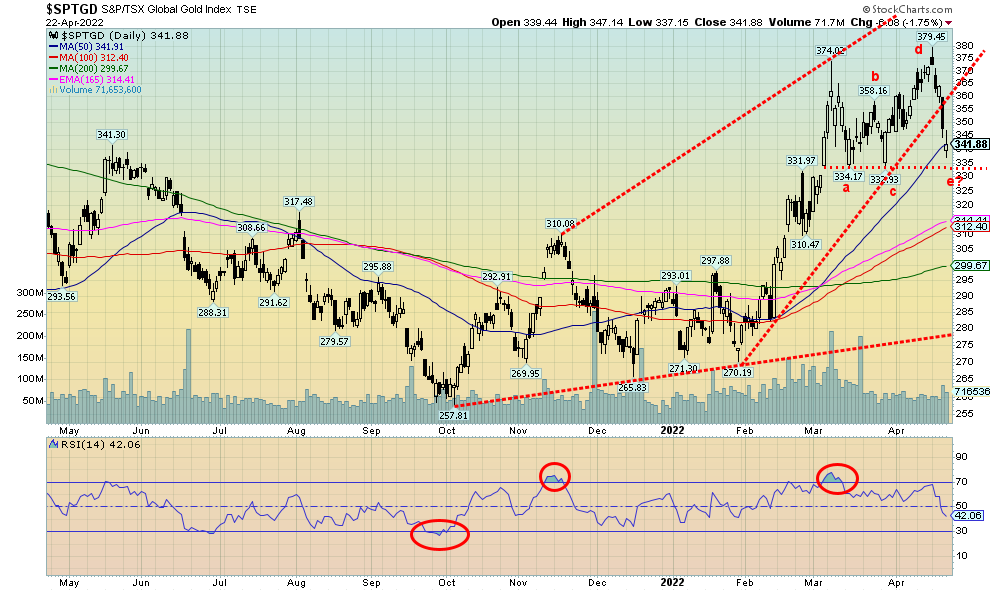
Have gold stocks topped? That could be the case as this past week the TSX Gold Index (TGD) made a fresh 52-week high, then reversed, closing below the previous week’s low and losing 7.9%. The Gold Bugs Index (HUI) did the same and lost 9.3%. It was a rather nasty end to a week that started out with considerable promise as both indices (and a number of stocks) soared to 52-week highs. If there is a positive in this, it is in looking at the chart sees the TGD forming what appears to be a 5-point abcde-type of reversal pattern. This could be the e wave. Key might be the support at 335. If that can hold, we stand a good chance of recovering. If it breaks, we could soon see the TGD fall to rising support from both the 100-day MA and the 165-day EMA near 312/314. The TGD closed slightly under the 50-day MA this past week. It is difficult to say at the moment whether Friday’s action was terminal for this rather swift down move that caught many by surprise. Other long-term support can be seen at the 200-day MA currently near 300. However, we would consider any break under 310 as being negative for the TGD. The HUI has support down to 280 then down to 265 but a breakdown under 270 would be considered negative. By all measurements gold stocks continue to be quite cheap vis-à-vis gold. As of now we would only consider the TGD to be recovering above 360. Above 370 new highs are highly probable. The last significant low was seen in late January at 270. A breakdown under 295 could suggest new lows ahead. But the key may be the appearance of the abcde pattern that could suggest this is just a sharp e wave to the downside that should soon end.
Source: www.stockcharts.com
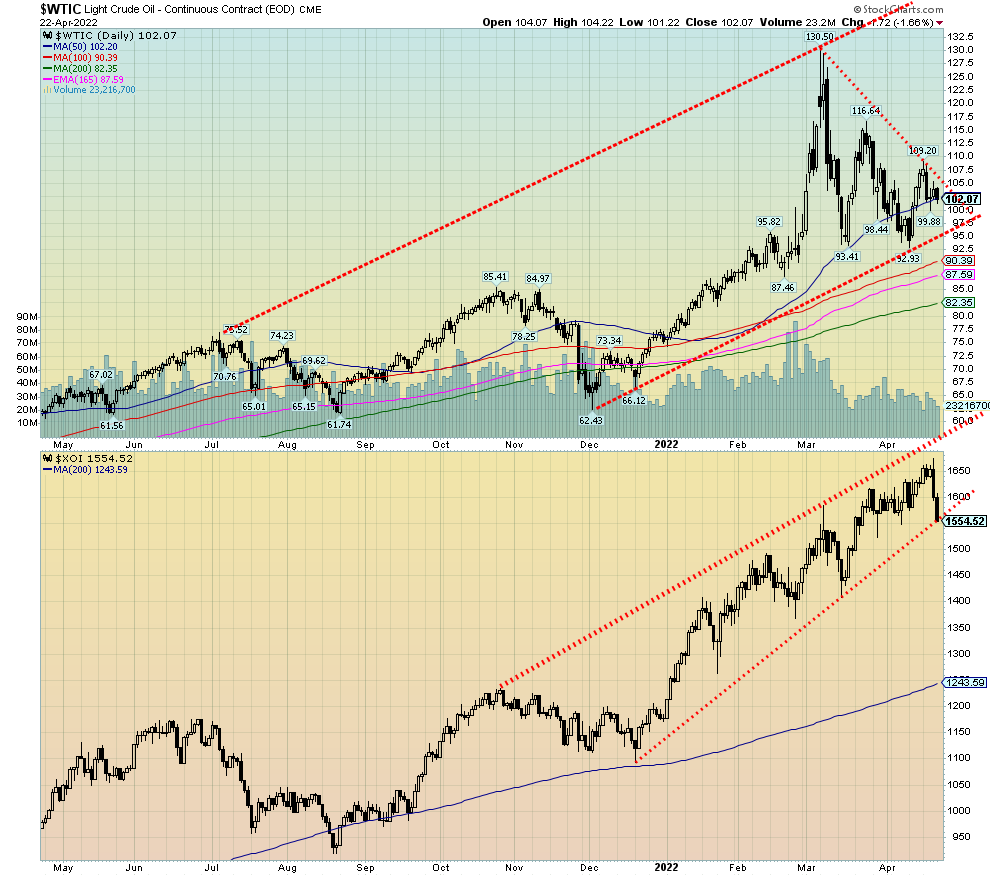
Is falling Chinese demand and the potential for a recession taking over from fear of further supply risks as a result of the Russia/Ukraine war? It’s hard to say just yet, but some weak signs appeared this past week. First, WTI oil was down 4.6% this past week and natural gas (NG) lost 8.8%. Both are still up nicely on the year.
More concerning was the outside reversal week put in by the two major energy indices. A key outside reversal week occurs when a stock/index/future makes a new high and then reverses to the downside, taking out the low of the previous week and closing below that low. A reversal week is the same except the stock/index/future does not take out the low of the previous week but still closes lower.
This past week the ARCA Oil & Index (XOI) lost 4.4% and put in what we term a key reversal week, closing below the previous week’s low. The TSX Energy Index (TEN) also made a new high and closed lower but not below the previous week’s low. It was a reversal week that saw the TEN lose 2.7%. This is something to consider going forward. Has the market topped?
Naturally we need confirmation. The stock indices (XOI, TEN) are sitting on the cusp of breaking their uptrend. The down move this past week for WTI oil suggests we could go down and test support once again at $95. A break under that level, however, would confirm a top. Oil could fall and test the 200-day MA currently near $83. NG made its high last week at $8.07 and is now down in just one week 17.5% from that high. That’s a nasty drop despite ongoing issues for the EU and Russian gas.
All we have been reading is the EU is between a rock and hard place with regard to Russian gas. They can’t just break away. Corporations and unions in Germany have been arguing that upwards of 400,000 jobs could be lost and Germany (and by extension the EU) would be plunged into a recession, or worse. It takes years to build new pipelines from other sources and Germany and the EU lack sufficient facilities to receive LNG. While coal from Russia is to be phased out by August, there are ready supplies elsewhere including Australia and Canada. But coal is the smallest energy need by the EU surpassed by a wide margin by oil and gas. As to oil, the EU is talking to potential alternative suppliers but the reality is those suppliers have limited ability to replace Russian oil.
One other EU concern was paying for their gas in rubles. The European Commission has ruled that paying in Russian rubles to Gazprombank is compatible with the EU’s sanctions on Russia. Whether that eases the fear of sanctions on Russian oil and gas is undetermined.
One other note: Investment bank JP Morgan put out a report detailing how the world is headed for an energy crunch because of the need to find $1.3 trillion in additional investment by 2030 to avoid demand exceeding supply by a 20%. That would be a catalyst for higher energy prices alone.
The technicals look somewhat negative and the stock market is taking a big hit. With fears that rising interest rates could quell any recovery, oil and gas are now falling on fears of an induced recession from the Fed. Rising Omicron cases do not appear to be an issue, at least not yet. A break of $100 could send WTI oil down to $95.
Copyright David Chapman, 2022
|
GLOSSARY Trends Daily – Short-term trend (For swing traders) Weekly – Intermediate-term trend (For long-term trend followers) Monthly – Long-term secular trend (For long-term trend followers) Up – The trend is up. Down – The trend is down Neutral – Indicators are mostly neutral. A trend change might be in the offing. Weak – The trend is still up or down but it is weakening. It is also a sign that the trend might change. Topping – Indicators are suggesting that while the trend remains up there are considerable signs that suggest that the market is topping. Bottoming – Indicators are suggesting that while the trend is down there are considerable signs that suggest that the market is bottoming. |
Disclaimer
David Chapman is not a registered advisory service and is not an exempt market dealer (EMD) nor a licensed financial advisor. He does not and cannot give individualised market advice. David Chapman has worked in the financial industry for over 40 years including large financial corporations, banks, and investment dealers. The information in this newsletter is intended only for informational and educational purposes. It should not be construed as an offer, a solicitation of an offer or sale of any security. Every effort is made to provide accurate and complete information. However, we cannot guarantee that there will be no errors. We make no claims, promises or guarantees about the accuracy, completeness, or adequacy of the contents of this commentary and expressly disclaim liability for errors and omissions in the contents of this commentary. David Chapman will always use his best efforts to ensure the accuracy and timeliness of all information. The reader assumes all risk when trading in securities and David Chapman advises consulting a licensed professional financial advisor or portfolio manager such as Enriched Investing Incorporated before proceeding with any trade or idea presented in this newsletter. David Chapman may own shares in companies mentioned in this newsletter. Before making an investment, prospective investors should review each security’s offering documents which summarize the objectives, fees, expenses and associated risks. David Chapman shares his ideas and opinions for informational and educational purposes only and expects the reader to perform due diligence before considering a position in any security. That includes consulting with your own licensed professional financial advisor such as Enriched Investing Incorporated. Performance is not guaranteed, values change frequently, and past performance may not be repeated.
About the author


Website: https://www.enrichedinvesting.com
Disclaimer: David Chapman is not a registered advisory service and is not an exempt market dealer (EMD) nor a licensed financial advisor. We do not and cannot give individualised market advice. David Chapman has worked in the financial industry for over 40 years including large financial corporations, banks, and investment dealers. The information in this newsletter is intended only for informational and educational purposes. It should not be considered a solicitation of an offer or sale of any security. The reader assumes all risk when trading in securities and David Chapman advises consulting a licensed professional financial advisor before proceeding with any trade or idea presented in this newsletter. David Chapman may own shares in companies mentioned in this newsletter. We share our ideas and opinions for informational and educational purposes only and expect the reader to perform due diligence before considering a position in any security. That includes consulting with your own licensed professional financial advisor.