
“The conventional view serves to protect us from the painful job of thinking.”
—John Kenneth Galbraith, Canadian-American economist, diplomat, public official, intellectual, author of The Affluent Society (1958) + others, U.S. ambassador to India 1961–1963, professor Harvard University; 1908–2006
"An investment in knowledge pays the best interest."
—Benjamin Franklin, American polymath, writer, scientist, inventor, statesman, diplomat, printer, publisher, political philosopher, one of founding fathers of the U.S., signer of Declaration of Independence, Postmaster General 1775–1776 plus other positions; 1706–1790
"Bottoms in the investment world don't end with four-year lows; they end with 10- or 15-year lows."
—Jim Rogers, American investor, financial commentator, Chairman Beeland Interests Inc., co-founder of Quantum Fund and Soros Fund Management, creator of Rogers International Commodities Index (RICI); b. 1942
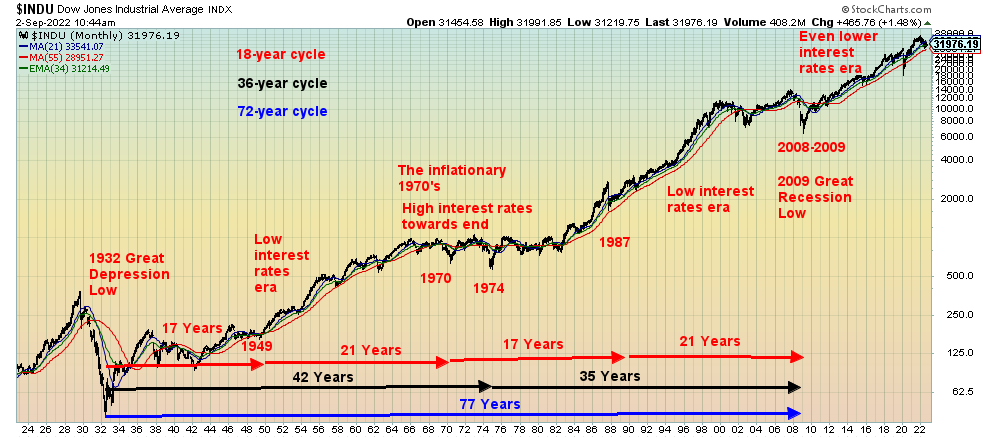
Jim Rogers might be off a bit. The 18-year cycle has more support. The range is 15–21 years, although some claim 13–21 years. A measurement: the 1932 low followed by a key low in 1949 (17 years), 1970 (21 years), 1987 (17 years), and 2008/09 (21 years). The next one is due 2023-2030. The crest is most likely in with the high seen on January 5, 2022 for the Dow Jones Industrials (DJI). Now what?
That the next 18-year cycle low happens to coincide with a potential historical 90-year cycle low is mere coincidence. Or is it? 90 is 5x18. The last 90-year cycle low (which are rare obviously) was 1932. Presuming the existence of a generational 90-year cycle, we are now into the time frame. For the record, we can trace on what charts we have of 90-year cycle lows dating back to 1555. While the nominal low for the stock markets was seen that year, no new highs were seen until well past 1600. The next major stock market low wasn’t seen until 1672. That is 117 years from 1555. The era was known as the “Disaster Years,” following a series of wars between Britain and the Netherlands and France. During that time, the Netherlands saw the collapse of the Dutch Empire and the dethroning of the Netherlands guilder as the world’s reserve currency. In turn it signaled the rise of France and Britain.
The latter part of the 18th century was a period of wars and economic depressions. Bubbles that burst included the South Sea Bubble (1720) and the Mississippi Company (1720). Stock markets peaked in 1720, then collapsed. A series of financial crises followed, continuing off and on into the 1760s and beyond. Major wars included the French/Indian wars (1754–1763) and the Seven Years’ War (1956–1763), culminating in the American Revolution (1775–1783) and the French Revolution (1792–1802). Both events shook the existing world order. A series of economic collapses, stagflation, and financial crises followed. Major stock market lows were seen in 1761 and 1783. 89 years and 111 years respectively from 1672.
Next up was the series of economic depressions that got under way with the “Panic of 1837”, a financial crisis that triggered a series of depressions. They lingered well into the 1840s and even into the 1850s and played a role in setting the conditions for the U.S. Civil War (1861–1865). Major stock market lows were seen in 1843 and 1857. Using 1761 they were 82 years and 96 years apart respectively. From 1783 they were 60 years (too short) and 74 years (also too short). The centered that particular 90-year low as 1761. Predictably the next one would be calculating from 1843 arrive in 1933. You couldn’t get much closer. The actual stock market low was 1932.
The most recent 90-year cycle collapse was the Great Depression of 1930s that culminated in World War II, and was preceded by World War I with a stock market bubble in between. 90 years hence from 1932 is 2022 and here we are. Stock markets in 2022 have been the worst seen since 1970. The world is engulfed in trade wars (U.S./China/Russia/Iran, etc.). Sanctions are a form of economic war which is similar to trade wars. We also have real wars (Russia/Ukraine) and threatening wars (China/Taiwan), whereas the real conflict is between U.S./China/Russia – global geopolitical turmoil. These events, coupled with the negative impact of the pandemic that preceded them, are the root of the problem, with supply disruptions and sharply rising commodity prices sending inflation to the highest levels seen since the 1970s. High inflation is not going to disappear anytime soon, even if it comes down as it did recently.
The world that existed before is most likely gone. It was a world dominated by cheap wages in China and other emerging economies in Asia and Latin America that allowed them to flourish. It also allowed the U.S. to become the world’s biggest importer in history. Low wages elsewhere allowed the U.S. to also keep a lid on wages that have largely stagnated since the 1990s, even if the wages of the top 20% grew sharply, thus exacerbating growing economic inequality. It was a world of globalization. Cheap commodities, particularly oil and gas from Russia, allowed Europe to flourish, fueling in particular the economic powerhouse Germany. That’s now gone and replacement could be years away.
But the elephant in the room is the growing political divide that threatens to expand into civil war or, at least, an extended period of political and economic destabilization and potential violence. What might be triggered if former president Trump is indicted with threats of violence coming from a number of sources? Countries need not go to war with each other; they can just collapse from within. The divide is so great that even the esteemed Economist has written about it with, the current cover page titled “The Disunited States of America” (https://www.economist.com/leaders/2022/09/01/american-states-are-now-petri-dishes-of-polarisation). What if the U.S. broke up? How would that destabilize the global world order?
So, what is the Fed to do if the economy imploded once again? After all, one thing that the Fed and other world central banks don’t want is an economic implosion on the scale of the 2007–2009 financial crisis. The politicians don’t want it either. For that matter no one would. But the potential threat is there. Will the only solution be another round of QE that makes the previous periods of QE look like nothing? The 2007–2009 financial crisis sparked a $3.5 trillion rise in the Fed’s balance sheet from 2008 to 2014. But the pandemic crisis of 2020 sparked a rise of $4.7 trillion from 2020 to 2022. U.S. federal debt grew over $9 trillion 2008–2016 and then another $4.1 trillion in 2020–2022. U.S. federal debt has tripled since 2008 while the Fed’s balance sheet has gone up almost 9 times. However, the reality is that without it we’d most likely already be in a global depression. But can they do a third time? The next one might take even more to prevent a collapse. Money
printing is also ultimately inflationary as too much money could well be chasing too few goods. This was exemplified by the bubbles created out of the 2008 financial crisis and even more so out of the 2020 pandemic crisis.
Our chart below shows the DJI over the past 100 years, highlighting the 18-year cycle, the 36-year cycle, and the 72-year cycle. Note all are derivatives of the 18-year cycle as is 90 years. But they all have ranges and one cannot say that the low comes in exactly but instead occurs within a time frame range. What is notable is that the intensity of each cycle rises with the number of years, culminating in the 90-year cycle which, according to this chart, could be the most intense since the Great Depression.
100-years DJI 1922–2022
Source: www.stockcharts.com
U.S. Job Numbers
Is this the goldilocks jobs number the U.S. was looking for? Nonfarm payrolls for August came in at 315,000 which was roughly in line with what most economists were expecting. Revisions for the past two months (June/July) dropped another 107,000 jobs off, putting the pace for the last three months at 378,000 jobs/month vs. 539,000 jobs/month through Q1. The unemployment rate (U3) rose to 3.7%, but that’s because more people came into the labour force. The labour force leaped by some 768,000 in August, an abnormal jump. Finally, the civilian labour force is higher (barely) than it was in February 2020. The labour force participation rate was 62.4% vs. 62.1% in July, while the civilian employment population ratio was 60.1% vs. 60.0%. In February 2020 the employment population ratio was 61.2% and the labour force participation rate 63.4%.
But there are some distortions here. The civilian labour force, defined as those 16 years of age and over, stands at 164.7 thousand. The second number is the all employees, total nonfarm defined as all those making up roughly 80% of the labour force who contribute to U.S. GDP. It stands at 152.7 thousand, up 526,000 in August from July. The third number is the employment level which is the same as the civilian labour force less those not in penal institutions or who are not on active duty in the armed forces. That is up 442,000 in August. Not shown is the population level which is the civilian non-institutional population 16 years and older and not those in penal institutions or who are not on active duty in the armed forces. The total population level has gone up 4,556,000 since February 2020 while the actual civilian labour force has expanded by only 163,000, the employment level has actually fallen by 134,000, and the total nonfarm employees is down 75,000.
Labour Force Statistics 2020–2022
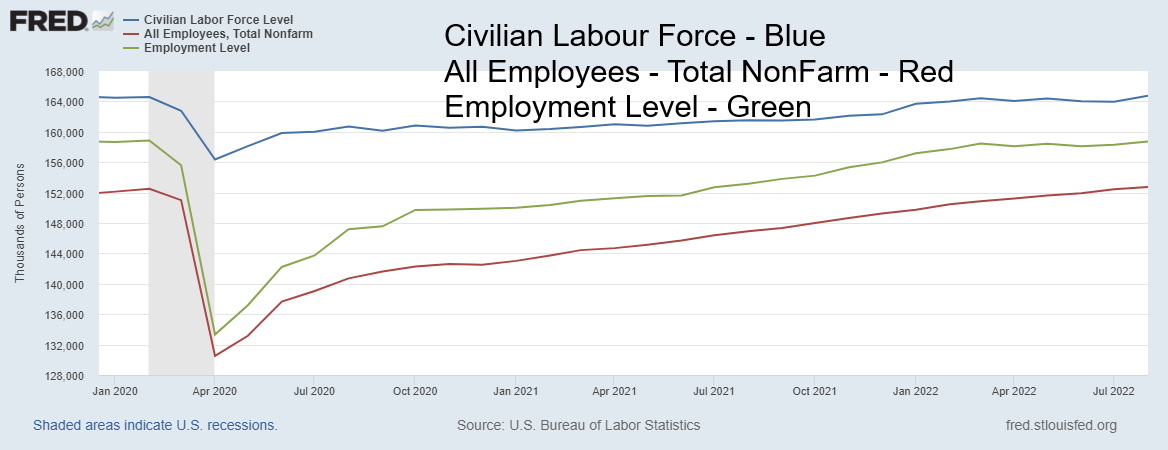
Source: www.stlouisfed.org
That’s quite a difference between the expansion of the total population vs. the expansion and, in some cases, contraction of the other employment measurements. Where did everyone go? The number for those defined as not in the labour force has jumped 3,840,000 since February 2020, the number of retirees is up 742,000, while the number unemployed is up 80,800. The actual number of unemployed, which may be more reflective of the U6 unemployment number, is up 2,283,900. Not surprisingly, while the U3 unemployment rose to 3.7% from 3.5%, the U6 unemployment which is the Bureau of Labour Statistics (BLS) broadest measurement that includes short-term discouraged workers and marginally attached workers seeking full-time rose to 7.0% from 6.7%. The Shadow Stats (www.shadowstats.com) unemployment number, U6 plus long-term discouraged workers and those defined out of the work force in a 1994 revision, rose slightly to 24.6% from 24.4%.
While the population level may have increased sharply, the number not in the labour force has also jumped sharply. However, not all of it is explained by a sharp rise in the number of retirees, although that is a factor. So, where they did all go? While the U3 unemployment is today 3.7% vs. 3.5% in February 2020 and the U6 unemployment is 7% the same as February 2020, the Shadow Stats unemployment level is now 24.6% vs. 21.3% in February 2020. Chronic unemployment appears to be a problem. It could be because of mismatch in
skills and many dropping out because of childcare or elderly care reasons. Or maybe boomers, having hit retirement age, are just retiring and not returning the labour force. The number of job openings is today 4,233,000 higher than in February 2020.
Irrespective of this, the on-the-money nonfarm payrolls gives some support to the Fed and to those who would like to see a soft landing. As to being about right on the prediction of the nonfarm payrolls, it proves you can be right some of the time but you can’t be right all of the time.
Average hourly earnings rose only 0.3% and are now up 5.2% year-over-year. But CPI inflation is last running at 8.5% while the Fed’s favourite measurement the personal consumption expenditure price index (PCE) inflation is at 6.3%. Wages are lagging inflation. Will there be a catch-up?
Shadow Stats Unemployment 1994–2022
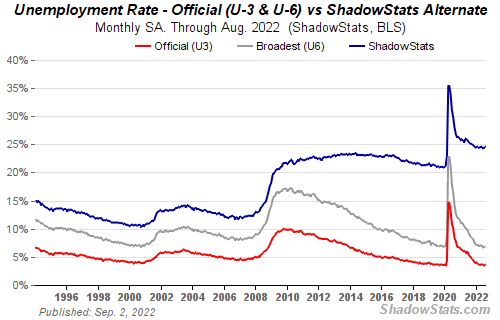
Source: www.shadowstats.com
Average Hourly Earnings, CPI, PCE 2020-2022
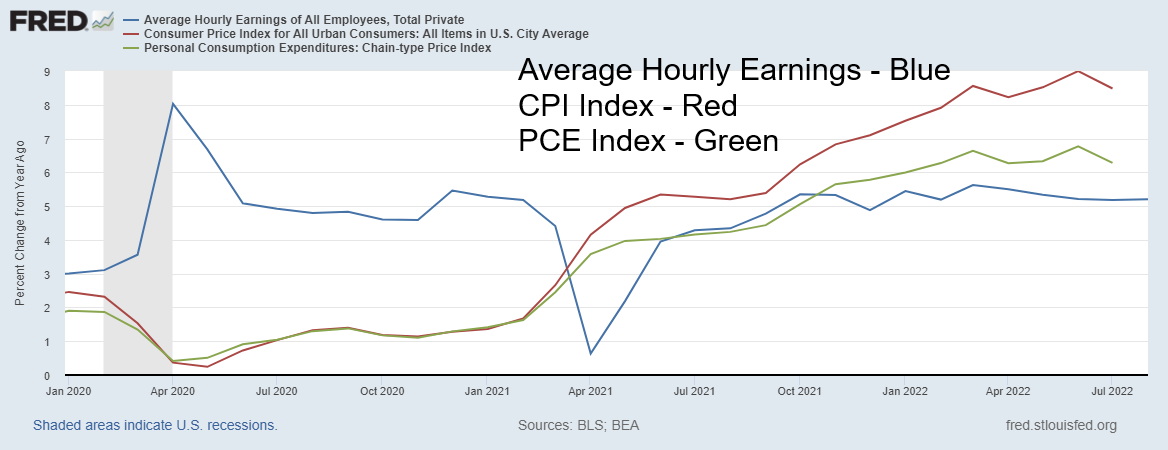
Source: www.stlouisfed.org
So where does that leave things? It probably won’t move the Fed, which is on record from Jackson Hole hinting at a 75 bp hike at the September 21 meeting. However, the good employment numbers might keep them to only a 50 bp hike. Furthermore, there are expectations of a 25 bp hike in both November and December. One area that is lagging is the leisure/hospitality industry where employment is down sharply. Part-time employment, while up 413,000 in August vs. July, is down 1,611,000 from February 2020. Full-time employment was down 242,000 in August but is up 1,496,000 since February 2020. It’s no surprise that the leisure/hospitality sector is facing the same problems in Canada. At least part of that can be explained by the poor wages in the sector and the fact that lower paid workers face more abuse. Wage growth is lagging inflation as we show. And that’s despite a supposed labour shortage.
A recession is coming. Inflation over 5%, plus an inverted yield curve have all proven to predict a recession, going back to 1950. But what they don’t predict is the severity of the recession. Unemployment is a lagging indicator, as our next chart shows. Fed funds peaked before the recession and peaked well before unemployment peaked. By the time unemployment peaked, the Fed funds was actually coming down.
Unemployment Rate vs. Fed Funds Effective Rate 1969–2022
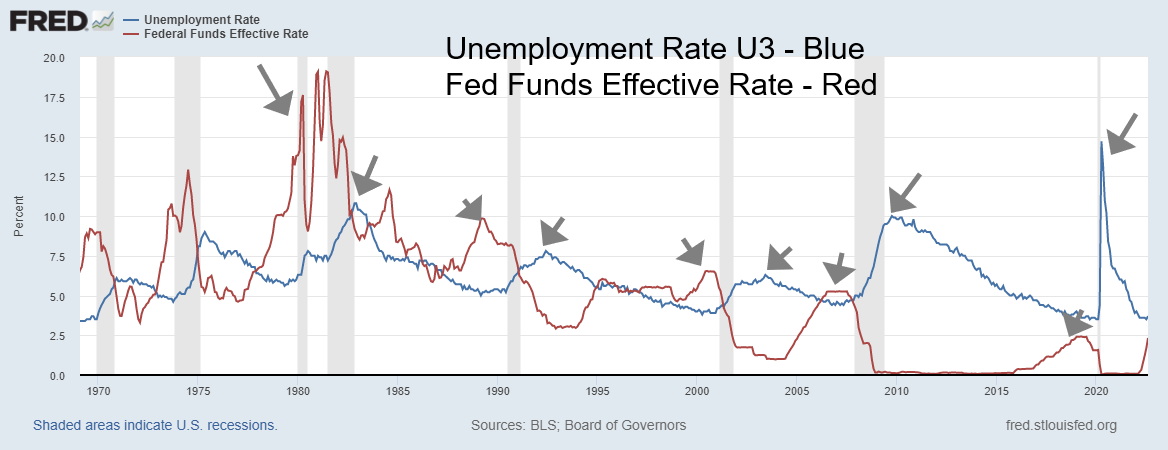
Source: www.stlouisfed.org
All of this suggests we might not see unemployment rise until sometime into 2023. While we are in a technical recession, we are not yet in an official recession. The same phenomena would also be seen in Canada. The Bank of Canada (BofC) meets September 7 and the wide expectation is that they will hike 75 bp. Canada’s employment numbers are not due out until next Friday. Canada’s hiking interest rates is already negatively impacting the housing market where prices are down 15.8% from their March 2022 peak—more in some other regions. Expectations are for at least a 25% decline into 2023. The ECB is also now hiking aggressively with an expected 75 bp rise on September 8. That’s interesting as that comes with Russia cutting off gas to the EU through the Nord Stream 1 pipeline. As well, Russia could cut oil exports as the G7 voted for price caps on Russian oil. The expectation is that Russia could cut production and they have also indicated they will not sell oil to any country that is a part of the price cap regime. The next U.S. inflation numbers are not due to be released until September 13.
The economy still has life, as seen by the August jobs report. But dark clouds lurk in the background. One should not allow complacency to set in.
Markets & Trends
|
|
|
|
% Gains (Losses) Trends |
|
||||
|
|
Close Dec 31/21 |
Close Sep 2/22 |
Week |
YTD |
Daily (Short Term) |
Weekly (Intermediate) |
Monthly (Long Term) |
|
|
Stock Market Indices |
|
|
|
|
|
|
|
|
|
`S&P 500 |
4,766.18 |
3,924.26 |
(3.3)% |
(17.7)% |
down |
down |
up (weak) |
|
|
Dow Jones Industrials |
36,333.30 |
31,318.44 |
(3.0)% |
(13.8)% |
down |
down |
neutral |
|
|
Dow Jones Transports |
16,478.26 |
13,737.61 |
(4.5)% |
(16.6)% |
down |
down |
up (weak) |
|
|
NASDAQ |
15,644.97 |
11,360.86 |
(6.4)% |
(27.4)% |
down |
down |
neutral |
|
|
S&P/TSX Composite |
21,222.84 |
19,873.29 |
(1.2)% |
(6.4)% |
neutral |
down |
up (weak) |
|
|
S&P/TSX Venture (CDNX) |
939.18 |
632.02 |
(2.2)% |
(32.7)% |
neutral |
down |
down (weak) |
|
|
S&P 600 |
1,401.71 |
1,161.88 |
(5.2)% |
(17.1)% |
down |
down |
neutral |
|
|
MSCI World Index |
2,354.17 |
1,829.96 |
(5.9)% |
(22.3)% |
down |
down |
down |
|
|
NYSE Bitcoin Index |
47,907.71 |
20,363.38 |
(4.4)% |
(57.5)% |
down |
down |
down (weak) |
|
|
|
|
|
|
|
|
|
|
|
|
Gold Mining Stock Indices |
|
|
|
|
|
|
|
|
|
Gold Bugs Index (HUI) |
258.87 |
187.31 |
(5.2)% |
(27.6)% |
down |
down |
down |
|
|
TSX Gold Index (TGD) |
292.16 |
225.40 |
(3.5)% |
(22.9)% |
down |
down |
down |
|
|
|
|
|
|
|
|
|
|
|
|
% |
|
|
|
|
|
|
|
|
|
U.S. 10-Year Treasury Bond yield |
1.52% |
3.19% |
5.3% |
110.0% |
|
|
|
|
|
Cdn. 10-Year Bond CGB yield |
1.43% |
3.10% |
2.7% |
116.8% |
|
|
|
|
|
Recession Watch Spreads |
|
|
|
|
|
|
|
|
|
U.S. 2-year 10-year Treasury spread |
0.79% |
(0.21)% |
40.0% |
(126.6)% |
|
|
|
|
|
Cdn 2-year 10-year CGB spread |
0.48% |
(0.48)% |
7.7% |
(200.0)% |
|
|
|
|
|
|
|
|
|
|
|
|
|
|
|
Currencies |
|
|
|
|
|
|
|
|
|
US$ Index |
95.59 |
109.51 (new highs) |
0.7% |
14.6% |
up |
up |
up |
|
|
Canadian $ |
.7905 |
.7616 |
(0.8)% |
(3.7)% |
down |
down |
down (weak) |
|
|
Euro |
113.74 |
99.57 |
(0.1)% |
(12.5)% |
down |
down |
down |
|
|
Swiss Franc |
109.77 |
101.91 |
(1.6)% |
(7.2)% |
down |
down |
down (weak) |
|
|
British Pound |
135.45 |
115.17 (new lows) |
(1.9)% |
(15.0)% |
down |
down |
down |
|
|
Japanese Yen |
86.85 |
71.32 (new lows) |
(2.0)% |
(17.9)% |
down |
down |
down |
|
|
|
|
|
|
|
|
|
|
|
|
|
|
|
|
|
|
|
|
|
|
Precious Metals |
|
|
|
|
|
|
|
|
|
Gold |
1,828.60 |
1,722.60 |
(1.6)% |
(5.8)% |
down |
down |
neutral |
|
|
Silver |
23.35 |
17.88 (new lows) |
(4.6)% |
(23.4)% |
down |
down |
down |
|
|
Platinum |
966.20 |
818.30 |
(4.3)% |
(15.3)% |
down |
down |
down |
|
|
|
|
|
|
|
|
|
|
|
|
Base Metals |
|
|
|
|
|
|
|
|
|
Palladium |
1,912.10 |
2,026.10 |
(4.5)% |
6.0% |
down (weak) |
neutral |
down (weak) |
|
|
Copper |
4.46 |
3.41 |
(7.8)% |
(23.6)% |
down (weak) |
down |
neutral |
|
|
|
|
|
|
|
|
|
|
|
|
Energy |
|
|
|
|
|
|
|
|
|
WTI Oil |
75.21 |
86.87 |
(6.7)% |
15.5% |
down |
down (weak) |
up |
|
|
Nat Gas |
3.73 |
8.79 |
(5.2)% |
135.7% |
up (weak) |
up |
up |
|
Source: www.stockcharts.com
Note: For an explanation of the trends, see the glossary at the end of this article.
New highs/lows refer to new 52-week highs/lows and, in some cases, all-time highs.
Source: www.stockcharts.com
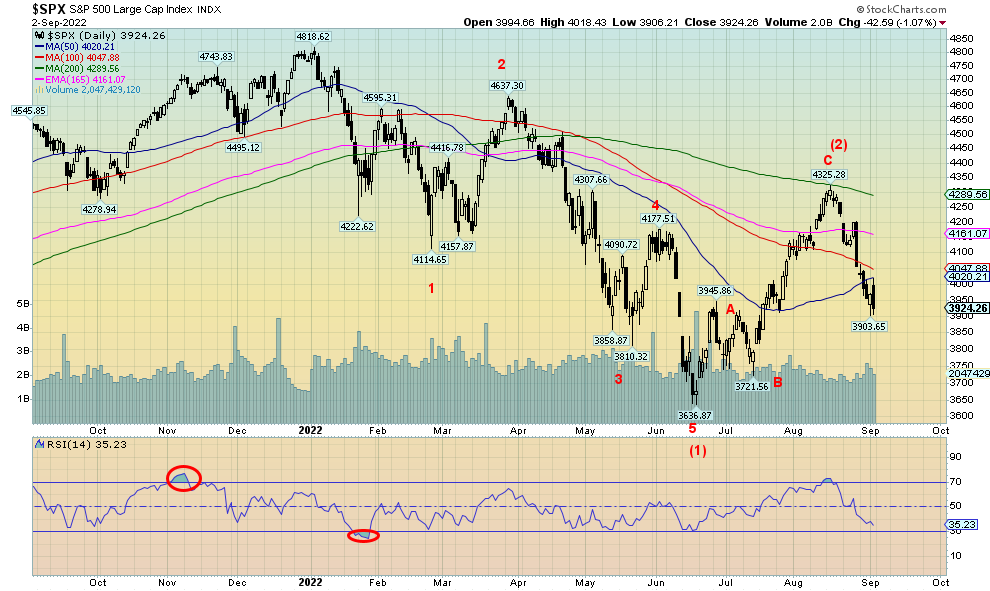
It’s September. Back to school and business ramps up once again. But September is also the worst month of the year for the stock market, and if the first two days are an indication, it could be shaping up to be a miserable month. The S&P 500 completed what appears as an ABC corrective wave to the upside from the low in June. Already the drop in the S&P 500 has taken out support at 4,000 and 3,950, hitting a low near 3,900 this past week. It was the third consecutive down week. The stock markets had a chance on Friday with the S&P 500 up over 50 points and the Dow Jones Industrials (DJI) up well over 300 points following the job numbers. But it didn’t last and by the end of the day the S&P 500 closed down almost 43 points while the DJI fell over 300 points. The trends are now firmly to the downside and further downside appears to be in the cards. Even the monthly trends are threatening to turn negative. We haven’t seen that since the 2008 financial crisis.
Other markets fell as well. The DJI was down 3.0%, the Dow Jones Transportations (DJT) was off 4.5%, the NASDAQ dropped 6.4%, while the small cap S&P 600 was down 5.2%. Bear markets are now established and are nowhere near over. In Canada, the TSX lost 3.0% while the TSX Venture Exchange was down 2.2%, generally outperforming. Bitcoin fell under $20,000 but managed to close just above that level, losing 4.4% on the week. The FAANGS took it in the ear as well with the NY FANG Index down 4.6% and not one component up on the week. Nvidia was the worst, down 16.0% this past week.
In the energy-stretched EU, things were no better with the London FTSE off 1.6% and the Paris CAC 40 down 1.7%. The German DAX gained 0.6%, but that was before they knew Russia was cutting off Nord Stream 1 once again, and things could get worse with the G7 agreeing to a price cap on Russian oil. As we note under our energy commentary, that could backfire big time.
In Asia, China’s Shanghai Index (SSEC) fell 1.5% and Japan’s Tokyo Nikkei Dow (TKN) was down 3.5%. No joy anywhere. And interest rates are rising again as the U.S. 10-year treasury note soared to 3.19% this past week, up 5.3% on the week while Canada’s 10-year Government of Canada bond (CGB) gained 2.7% to 3.10%. The 2–10 spreads, however, narrowed to negative 21 bp in the U.S. and negative 48 bp in Canada. The narrowing came as a result of the 2-year notes and bonds not rising as much as the 10-year. The on-the-money job numbers received a mixed reception with some believing it might soften the Fed from hiking rates 75 bp at the September meeting. Canada is expected to hike 75 bp this coming week.
The DJI broke support as well when it fell under 32,000. Major support lies around 27,000, but next up to break is at 31,000 and then under 30,000. If we are truly in the throes of the third wave down, then the stock markets could fall as much as 50% with the bottom coming sometime in 2023. With all of the uncertainty in the energy market, no end to the war in Ukraine nor seemingly any attempt to negotiate an end, along with all the lockdowns in China and its teetering property market, as well as teetering housing markets in Canada and the U.S., there appears to be little hope that we can escape the inevitability of a lower stock market. We’ll hold out some hope. If the DJI can regain above 33,000 and the S&P 500 above 4,000 and, in particular, above 4,100, then a short-term rebound rally might be under way. But that’s all it should be—a short-term relief rally. The trend is down. September is the worst month of the year and it is not shaping up to be very good this year again. The good news is lows usually come in October. But from what level?
U.S. Housing Starts/Existing Home Sales 2012–2022
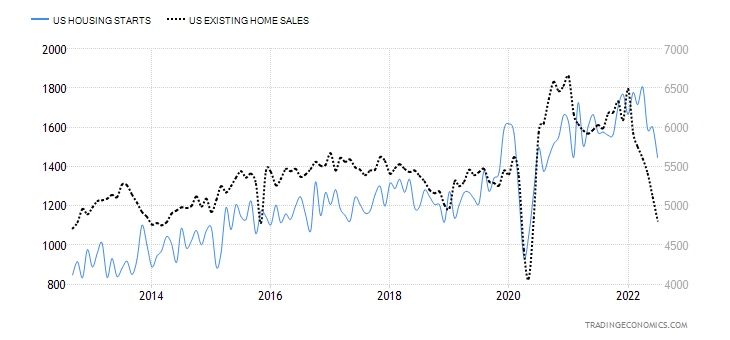
Source: www.tradingeconomics.com, www.nar.realtor, www.census.gov
Housing starts and sales of existing homes are in a downtrend, having peaked earlier in the year. The collapse in 2020 was because of the pandemic, but the collapse this time is more troublesome. Rising interest rates have played a major role in the slowdown in the housing market. Housing starts are down 20% from their high while sales of existing homes are down 26%. Not shown are sales of new homes that are down 40% from their high in December 2021. The House Price Index has fallen 17% thus far in 2022 from a peak in February. Pending home sales have fallen 20% in the past year.
Source: www.stockcharts.com
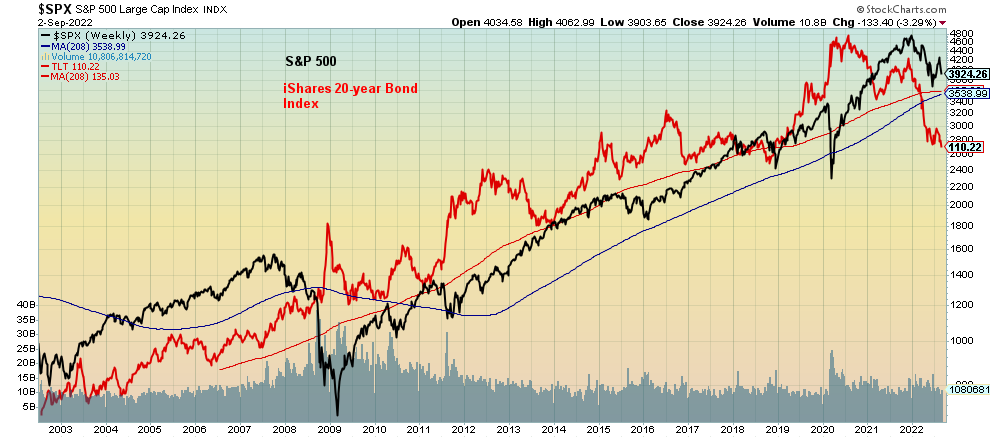
Stocks and bonds often go in tandem. This chart that shows the S&P 500 vs. the iShares 20-year Bond Index ETF shows how both followed each other to the upside but now appear to be following each other to the downside. Bonds are in one of their worst bear markets in years having already broken under their 4-year MA. The 20-year bond ETF is shown above in red while the S&P 500 is in black. The exception to following each other occurred during the 2008 financial crisis and again during the pandemic crisis. Bond prices rose as the stock market fell. But now they are both falling together. Bonds are in an inflation induced bear market. It’s the worst bear market we’ve seen since the bond bears of the early 1980’s when bond prices fell to historical lows. The signal to us is that bond prices (yields move inversely to prices) have most likely seen their highs for years to come. Note how bonds have solidly broken under their 4-year MA even as the S&P 500 has not. The S&P 500 would break under its 4-year MA at 3,500.
Source: www.stockcharts.com
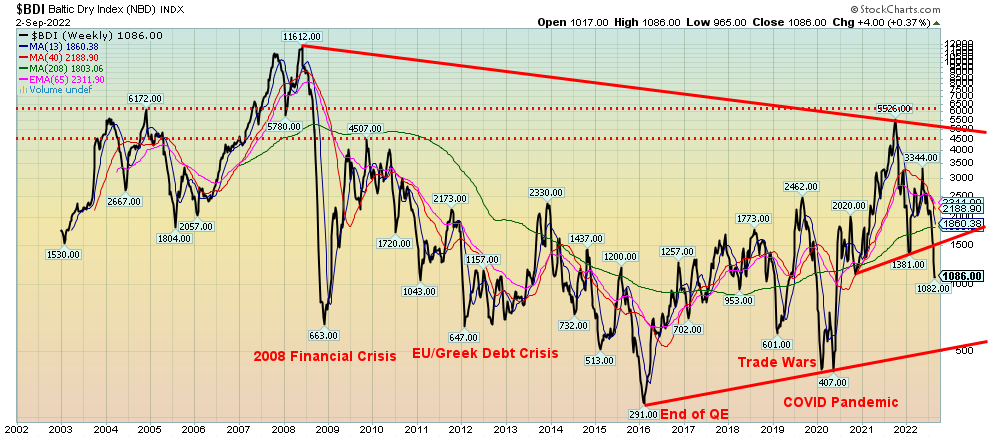
The Baltic Dry Index (BDI) has broken down. At best it is headed for uptrend line from lows in 2016. A collapsing BDI index reflects interruptions in global trade. The BDI reflects the cost of moving major raw materials by sea. So, a rising BDI is showing the global economy is doing well whereas a falling BDI reflects economic malaise and recessions. Although it doesn’t necessarily reflect the steepness of the recession. All lows have coincided with economic crises and/or recessions.
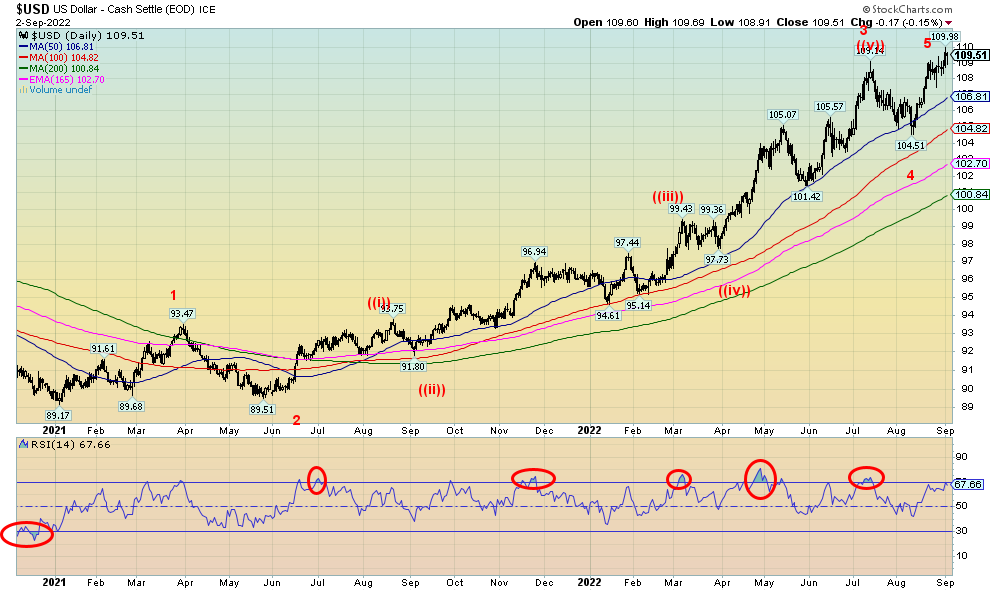
The US$ Index keeps chugging higher. Once again, the US$ Index made fresh 52-week highs, hitting a high of 109.98. The gain on the week was 0.7% and the index is up 14.6% on the year. That means all the currencies are down. The euro fell a small 0.1% but remains under par with the U.S. dollar. The Swiss franc was off 1.6% while the pound sterling and the Japanese yen both made 52-week lows as the pound lost 1.9% and the yen was down almost 2.0%. The Canadian dollar dropped 0.8%. All currencies remain firmly locked in downtrends.
The US$ Index remains firmly in an uptrend even as it once again approaches overbought on the indicators. Indicators are starting to diverge with the price action, but that doesn’t necessarily mean a high is coming. As we note below, targets up to 115 or higher are not beyond the realm of possibility. The US$ Index wavers under 108 but a more serious break wouldn’t occur until under 104.50. The US$ Index is being pushed higher by the faltering stock market and the fact that fund flows out of the EU, China, and Japan continue.
Source: www.stockcharts.com
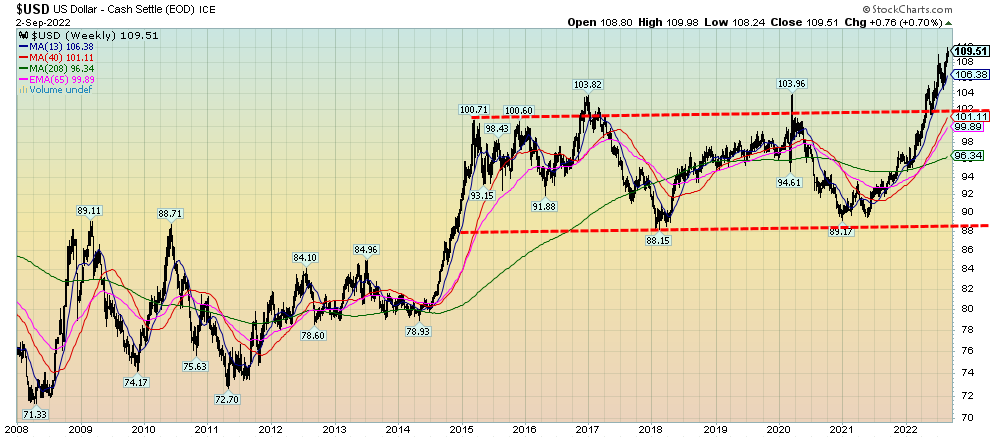
This long-term chart of the US$ Index suggests that it may have further to rise. The long period of consolidation between 2015 and 2022 pointed to a potential breakout to the upside. The downside break never materialized. It seems that a falling stock market is actually good for the U.S. dollar. If this chart is correct, we could have further upside to the 115/120 zone. A falling stock market in the fall might do the trick. Naturally that would have negative ramifications for gold.
Source: www.stockcharts.com
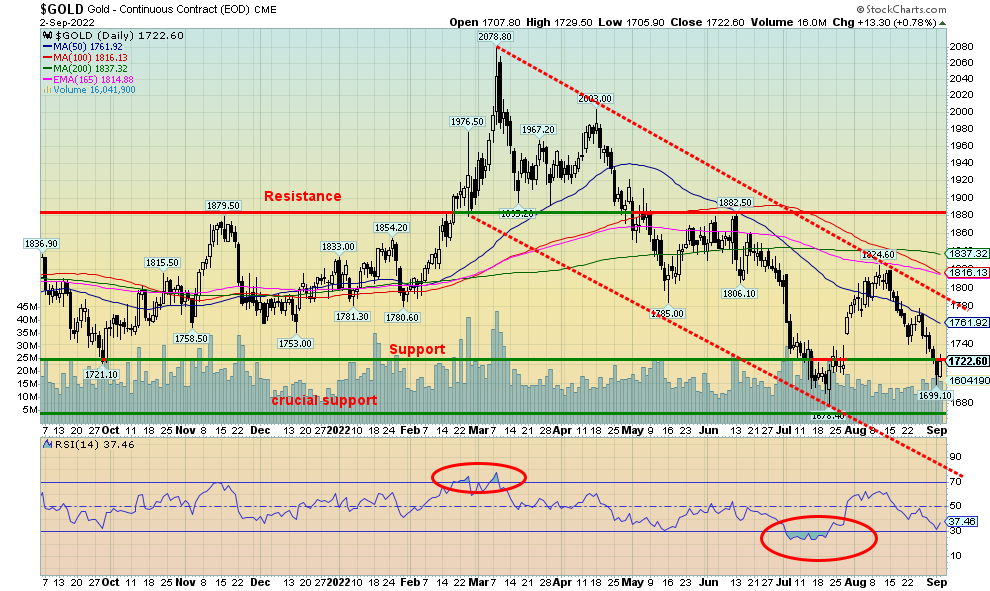
Friday’s job numbers were not enough to save gold from falling for the third consecutive week. Gold fell 1.6% on the week, despite the 0.8% gain on Friday following the U.S. job numbers. Silver also fell this past week, losing 4.6% and making fresh 52-week lows. As we note, silver made new lows but gold did not—a divergence. The U.S. job numbers seemed to ease some concern for gold as the on-the-money jobs report helped to soften the US$ Index, which in turn was positive for gold. Didn’t work for the stock markets, though, as we noted earlier. Other metals also fell with platinum down 4.3% while the near precious metals also saw losses with palladium off 4.5% and copper dropping 7.8% (demand destruction because of the slowdown in China). The gold stocks were not spared—the Gold Bugs Index (HUI) was down 5.2% and the TSX Gold Index (TGD) fell 3.5%.
Friday’s up day was highly welcomed, coming after a decline of five consecutive days. Have we made a bottom? For the short term, our outlook is bullish. With sentiment near rock bottom and a commercial COT that improved again this past week to 33% from 32%, we see gold resuming the rally that started in July. Gold appears to have fallen in five waves from the $2,078 top in March, so this may be part of an ABC correction to the upside. The A wave is complete topping at $1,824 and this may have completed the B wave down. To come is the C wave up. Our major resistance is up at $1,880/$1,900, so if we are to go higher it will be extremely important to take that level out. For the shorter term we need to regain above $1,760 to suggest a low is in and rise above $1,780/$1,800 to confirm the low. A firm breakout above that level could target up to $1,900/$1,925.
As to the commercial COT (bullion companies and banks), long open interest rose only about 1,000 contracts but short open interest fell about 8,000 contracts. The gold commercial COT is the best we’ve seen since 2018 before a $900+ up move in gold. Elliott Wave International is also bullish and believes we are on the cusp of a C wave to the upside. Less sure are their thoughts that we may be on the cusp of an even bigger move for gold. That would fit with our thoughts of the 7.83-year and the 23.5-year cycle lows. Our confidence level is higher for the C wave. That would be followed by another downdraft into 2023 that could see gold (and silver) make new lows even as all would most likely be higher than the lows seen in 2015. First, we have to see the nature of this C wave. The scenario would need to be adjusted if gold broke under $1,680, which then could see gold fall to $1,500 or lower. With our thoughts that the US$ Index could run to 115 or higher, we can’t be too complacent about gold.
Source: www.stockcharts.com
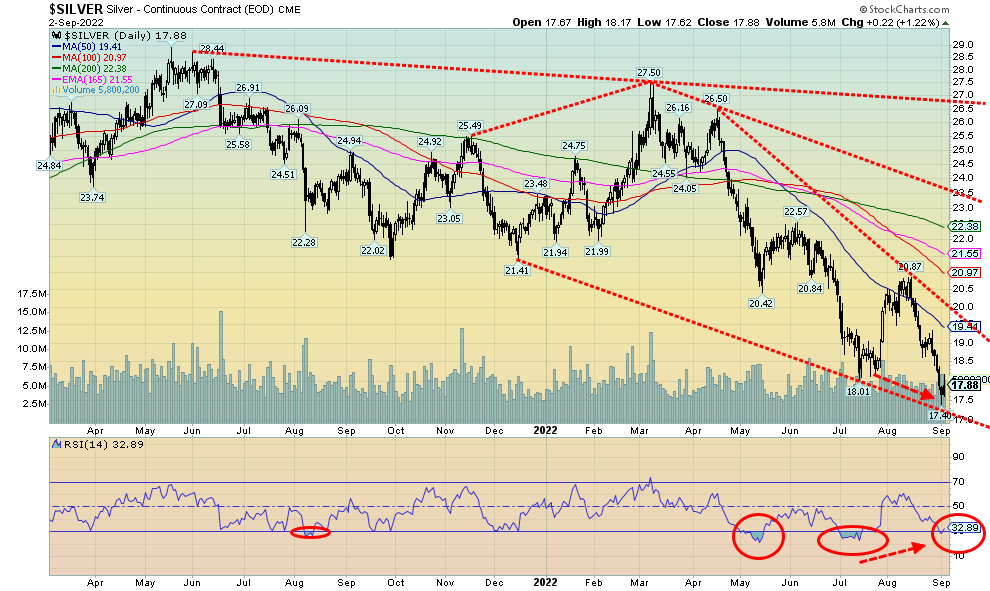
Silver prices hit fresh 52-week lows this past week, diverging with gold that did not make new lows. Naturally, this divergence needs to be confirmed and the only way that can happen is if prices rise again. Silver has not only broken down under $19 but also under $18. The only good news is that prices that hit a low of $17.40 this past week may have fallen to bottom of bear channel. Silver is forming what appears to be a descending wedge triangle from that high in April at $26.50. If that is correct, then a breakout over $20 could see silver run back towards $26.50 and even higher once it breaks above $23.50. While it has been bad enough breaking under $19 and $18, we don’t want to see silver fall under $17, as that could mean the descending wedge pattern is busted and instead, we could fall to $15 or lower. The commercial COT for silver improved this past
week to 50% the best level we’ve seen since 2018, just before a runup that took silver up over $16 from $14 to $30. Note, however, it didn’t happen overnight. The improvement in the commercial COT was mixed as longs fell about 5,000 contracts but shorts fell even more, down roughly 9,000 contracts. Not surprisingly, the large speculators COT fell to 46% from 48%. Have rarely seen the large speculators so bearish. The divergences for silver also show up in the indicators as prices make new lows but the indicators do not. Sentiment is also at or near rock bottom. A rally is coming.
Source: www.stockcharts.com
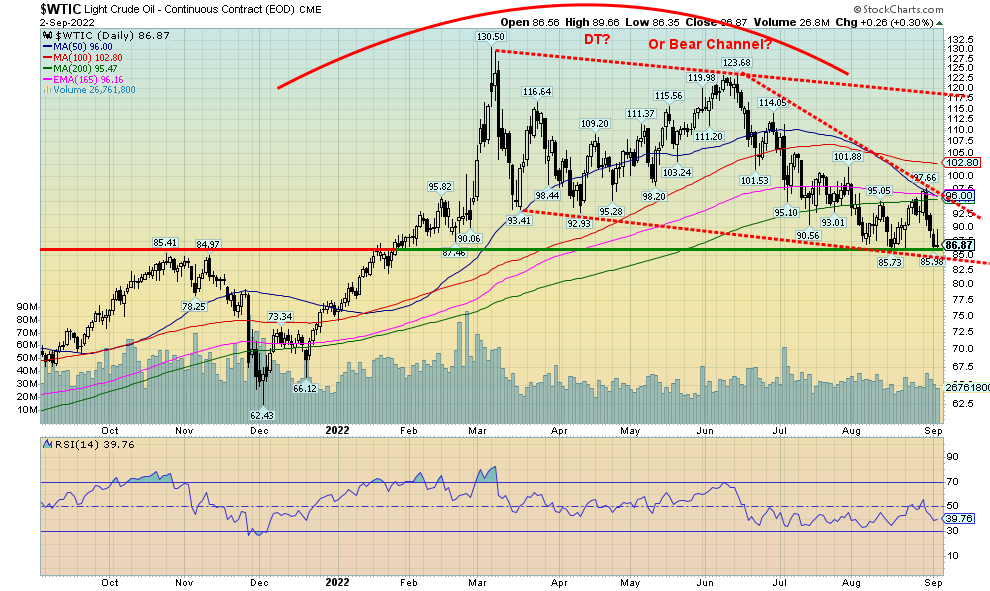
China’s COVID lockdowns once again reached the top of the oil agenda, helping to push WTI oil down over $6 this past week or 6.7%. There was a bit of a recovery on Friday. China’s PMI came in at 49.4, the second consecutive month under 50, suggesting China could actually be in a recession. Even natural gas (NG) softened this past week, off 5.2% while EU NG at the Dutch Hub fell some 37% this past week as Germany announced that its reserves are set to be 85% full. Hopes sprung that Russia might resume flows through Nord Stream 1.
Well, forget about that. Russia announced that they are extending the shutdown of NG through Nord Stream 1 because of the lack of turbines that are still being held up in Canada, while Canada is caught between Ukraine and Germany in shipping them (Ukraine claims they break sanctions while Germany, a NATO partner, just wants to start receiving gas again). At the same time the G7 agreed to a global cap on the price of Russian oil. What will Russia’s response to the price cap be? For starters, they will not sell any oil to any country that is a party to the price cap regime. Secondly, Russia could go a step further and pull oil off the market. Russia ranks
third in world production of oil and second in the world in NG. As to reserves, Russia ranks eighth in the world in oil reserves and holds the largest reserves of natural gas. In other words, Russia is an energy powerhouse. Europe, in particular, has been dependent on Russian oil and gas. But all of that is coming to an end because of the ongoing conflict in Ukraine. And new supplies are not readily available or could take years to develop. It’s an energy and economic war where there are no winners and everyone loses. Except Russia’s monetary reserves are brimming because of the high prices as they continue to defy sanctions, selling instead to the large number of countries that refuse to be a party to sanctions.
All this, of course, has brought up predictions of where prices could be headed. JP Morgan says oil could soar to $380/barrel (up from $175 prediction in June) if Russia goes “Full Monty” in retaliation against the West for
sanctions and the price cap. Russia could slash 5 million barrels per day without excessively damaging the economy, according to Bloomberg. At the other end of the spectrum, Citigroup thinks oil prices could collapse instead to $65 and even $45 into 2023 as recession and demand destruction take hold. They both could be right. And that didn’t even take into consideration if Israel attacked Iran over its nuclear ambitions and in a worst-case scenario the Straits of Hormuz, which carry one-third of the world’s oil, were blocked. On the other hand, a nuclear deal could allow more Iranian oil to flow, taking pressure off the loss of Russian oil. The question is, will the Iranians sell it to the West? Like Russia, they have found ways to work around sanctions. To make matters more complicated, OPEC meets on Monday and rumours are that the Saudis might cut production. Note that the Saudis are lobbying to become a part of BRICS. The Saudis appear to breaking from the west. Not good when one considers that the Russia and the Saudi are the two of the largest oil producers in the world. Together they overwhelm the world’s largest oil producer – the U.S.
As to demand destruction, across Europe and the UK thousands of restaurants, pubs, and other businesses are either on the verge of bankruptcy or threatening to close permanently because of the high cost of energy. They simply can’t afford to stay in business. That, in turn, could destroy Europe’s tourist industry. Who would want to go to Europe if they can’t find a restaurant to eat in? As well, cries to end the war in Ukraine are on the rise.
Energy stocks were hit this week as a result of both oil and gas prices falling. The ARCA Oil & Gas Index (XOI) fell 3.5% while the TSX Energy Index (TEN) was down 3.6%. Technically, oil prices appear to be at the bottom of a bear channel. So far, $85 has held. If it did break, a decline to $75 could get underway. The energy stocks represented on the TEN continue to appear bullish with a bullish reverse head and shoulders pattern having formed. We appear to have broken out, but it hasn’t yet been on big volume. It will be important that the TEN recovers from this week’s pullback.
Overall, the energy markets remain in turmoil, and it doesn’t appear that is about to end anytime soon.
Copyright David Chapman, 2022
|
GLOSSARY Trends Daily – Short-term trend (For swing traders) Weekly – Intermediate-term trend (For long-term trend followers) Monthly – Long-term secular trend (For long-term trend followers) Up – The trend is up. Down – The trend is down Neutral – Indicators are mostly neutral. A trend change might be in the offing. Weak – The trend is still up or down but it is weakening. It is also a sign that the trend might change. Topping – Indicators are suggesting that while the trend remains up there are considerable signs that suggest that the market is topping. Bottoming – Indicators are suggesting that while the trend is down there are considerable signs that suggest that the market is bottoming. |
Disclaimer
David Chapman is not a registered advisory service and is not an exempt market dealer (EMD) nor a licensed financial advisor. He does not and cannot give individualised market advice. David Chapman has worked in the financial industry for over 40 years including large financial corporations, banks, and investment dealers. The information in this newsletter is intended only for informational and educational purposes. It should not be construed as an offer, a solicitation of an offer or sale of any security. Every effort is made to provide accurate and complete information. However, we cannot guarantee that there will be no errors. We make no claims, promises or guarantees about the accuracy, completeness, or adequacy of the contents of this commentary and expressly disclaim liability for errors and omissions in the contents of this commentary. David Chapman will always use his best efforts to ensure the accuracy and timeliness of all information. The reader assumes all risk when trading in securities and David Chapman advises consulting a licensed professional financial advisor or portfolio manager such as Enriched Investing Incorporated before proceeding with any trade or idea presented in this newsletter. David Chapman may own shares in companies mentioned in this newsletter. Before making an investment, prospective investors should review each security’s offering documents which summarize the objectives, fees, expenses and associated risks. David Chapman shares his ideas and opinions for informational and educational purposes only and expects the reader to perform due diligence before considering a position in any security. That includes consulting with your own licensed professional financial advisor such as Enriched Investing Incorporated. Performance is not guaranteed, values change frequently, and past performance may not be repeated.
About the author


Website: https://www.enrichedinvesting.com
Disclaimer: David Chapman is not a registered advisory service and is not an exempt market dealer (EMD) nor a licensed financial advisor. We do not and cannot give individualised market advice. David Chapman has worked in the financial industry for over 40 years including large financial corporations, banks, and investment dealers. The information in this newsletter is intended only for informational and educational purposes. It should not be considered a solicitation of an offer or sale of any security. The reader assumes all risk when trading in securities and David Chapman advises consulting a licensed professional financial advisor before proceeding with any trade or idea presented in this newsletter. David Chapman may own shares in companies mentioned in this newsletter. We share our ideas and opinions for informational and educational purposes only and expect the reader to perform due diligence before considering a position in any security. That includes consulting with your own licensed professional financial advisor.