
“The whole problem with the world is that fools and fanatics are always so certain of themselves, but wiser people so full of doubts.”
—Bertrand Russell, British mathematician, philosopher, logician, public intellectual, author of Principia Mathematica; 1872–1970
“The inherent vice of capitalism is the unequal sharing of blessings; the inherent vice of socialism is the equal sharing of miseries.”
—Sir Winston Churchill, British statesman, soldier, writer, prime minister of the United Kingdom 1940–1945 and 1951–1955, Member of Parliament (MP) 1900–1964; 1874–1965
“The job of central banks: to take away the punch bowl just as the party gets going.”
—William McChesney, American business executive, 9th Chairman of the Federal Reserve 1951–1970, President of the NY Stock Exchange 1938–1941; 1906–1998
Inflation Again!
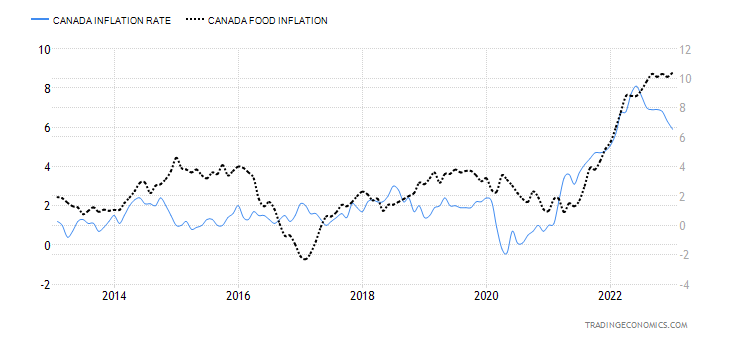
Canada Inflation Rate and Food Inflation Rate 2013–2023
Source: www.tradingeconomics.com, www.statcan.gc.ca
Canada reported its inflation rates for January. To no one’s surprise, inflation had moderated. Year-over-year (y-o-y) inflation moderated to 5.9%, down from 6.3% in December and below the expected 6.2%. The core
inflation rate fell to 5%, down from 5.4% and the expected 5.5%. Kudos all around. But food inflation kept on
rising. Food inflation rose 10.4% in January y-o-y, up from 10.1% the previous month. It is the highest food inflation rate since 1980. Apparently avian flu is sparking a big jump in chicken and poultry prices. Also, seemingly ignored or at least rarely if ever mentioned is the negative impact of droughts. When major growing areas are experiencing droughts, that reflects back on the price of food. Bad weather, droughts, poor harvests, high energy prices, the Russia/Ukraine war are all amongst the reasons why food prices have soared.
Canadian inflation is not the only number out this week that came in above expectations. In the U.S. the release of the GDP price deflator and the PCE price index indicated as well while inflation is moderating its not coming down as fast as they expect. The recent release of the FOMC minutes of January 31–February 1 meeting revealed the Fed’s concerns that the rate of inflation remains well above the 2% target. Treasury Secretary Janet Yellen has noted that inflation is staying higher for longer and that the risk of recession is also high as interest rates remain high. The FOMC also noted that labour markets remain very tight, contributing to rising prices and wages. Nonetheless, they had concluded that a lower rate hike was in order. But will they feel the same next month at the March 21–22 meeting? Some are suggesting the Fed could revert to 50 bp hikes once again.
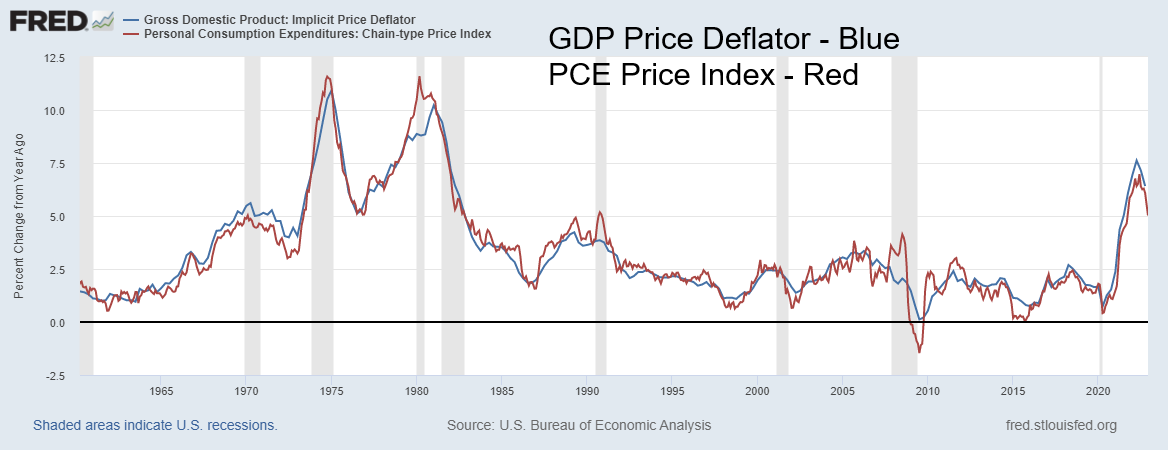
GDP Price Deflator, PCE Price Index Year-Over-Year Change 1960–2023
Source: www.stlouisfed.org
For the record, the Gross Domestic Product (GDP) price deflator came in at 3.9%, below the previous 4.4% but above the consensus estimate of 3.5%. The Personal Consumption Expenditures (PCE) price index came in at 5.4%, worse than the previous 5.3% and above consensus of 4.8%. Inflation remains a big bugaboo. The GDP numbers were also out and the latest revision to Q4 GDP came in at 2.7%, below the previous 3.2% and below consensus of 2.9%. Weaker GDP, higher inflation. Does that equal stagflation? But no, we are not in any official recession. Not yet. The 10-year U.S. Treasury Note is currently at 3.95%, still below the rate of inflation as
measured by the CPI and below the PCE price index but in line with the GDP price deflator. The current Fed rate is 4.5%–4.75%. Also, note once again how inflation came down initially in the 1970s, only to soar again later in the decade.
Russia, One Year Later
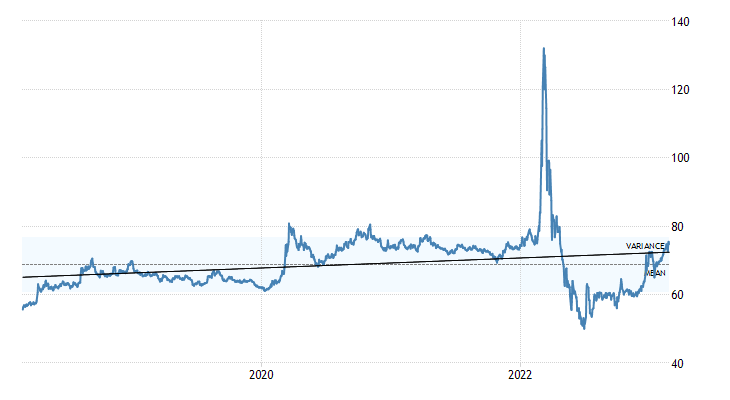
February 24 marks the one-year anniversary of the Russian invasion of Ukraine. Given all the sanctions and more, one would expect that the Russian economy is experiencing considerable trouble. But here we are a year on and its currency, the ruble, has not turned to rubble. Indeed, the ruble is trading roughly where it was before the invasion. It soared to US$ = 132 rubles in March 2022 (high was 150) but today it is at US$ = 75 rubles, roughly where it was in January 2022. So much for Russia’s currency collapsing. It has been rising of late, but we’d need to break back over US$ = 80 rubles to suggest that it could weaken further (US$ strengthen).
US$ to Russian Rubles 2018–2023
Source: www.tradingeconomics.com, www.cbr.ru
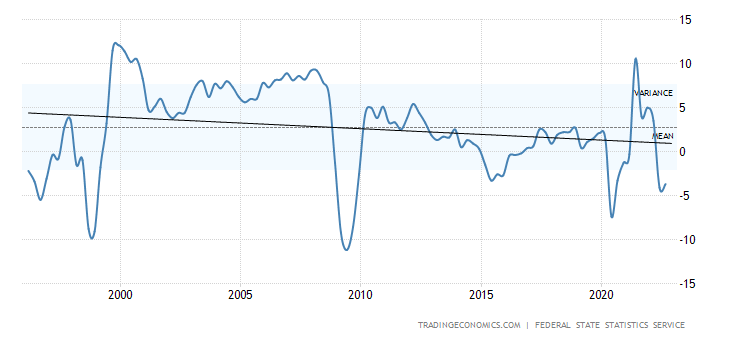
Not that their economy hasn’t contracted. It has. But, so far, it has avoided collapses as were seen in the late 1990s, during the 2008 global financial crisis, and during the pandemic crisis of 2020. We only have up to Q3 2022 but it notes that Russia is in a recession, given two consecutive quarters of negative growth. Q3 brought 3.7% negative growth and Q2 was down 4.1%. However, both came in better than expected. The Russian economy appears to be, surprisingly, somewhat resilient.
Even inflation has moderated as our chart on inflation and food inflation shows. Inflation was last recorded at 11.8%, but that was down from the month before and has been falling now for nine consecutive months. Food inflation at 10.2% is also coming down from a peak at around 20.5% back in April 2022. At 10.2% it’s lower than Canada’s food inflation rate of 10.4% recorded in January 2023. In the U.S. it was last recorded at 10.1%. Many countries are experiencing the same pain when it comes to food inflation.
Russia GDP Quarterly Year-over-Year 1995–2022
Source: www.tradingeconomics.com, www.eng.rosstat.gov.ru
Russia Inflation Rate and Food Inflation Rate 2013–2023
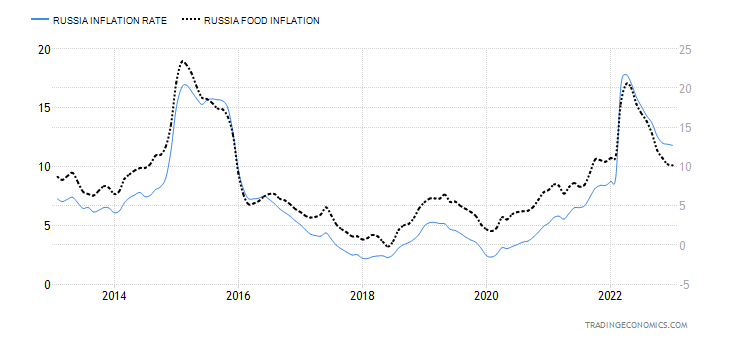
Source: www.tradingeconomics.com, www.eng.rosstat.gov.ru
Looking at Russia’s money supply, we note it keeps expanding while its central bank balance sheet has actually been contracting after soaring initially in 2022. Although over the past few months it has begun to expand once again. We note that its central bank rate (the equivalent of the Fed rate) has been held steady at 7.5% for the past three months. In early 2022, during the time of the invasion, it soared to 20% as capital controls were put on to prevent a huge outflow of money. Since then, the rate has come down steadily. The interbank rate is roughly 2% higher.
Russia Money Supply (M2) and Central Bank Balance Sheet – 2013-2023
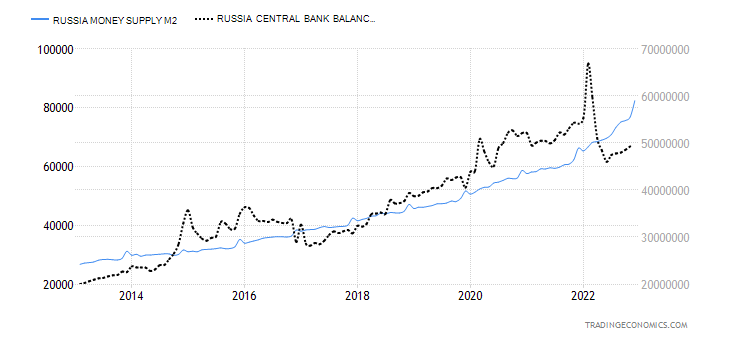
Source: www.tradingeconomics.com, www.eng.rosstat.gov.ru
Russia’s gold reserves have remained constant, last reported at 2,298.5 metric tonnes, the world’s sixth largest holdings representing 21.5% of all of their reserves. It has been well reported that the BRICS and even some others have been increasing their gold reserves. Why are they snapping up gold? Most believe it is because of the current uncertainty and global turmoil. Gold is the currency of fear and mistrust. Or some say so.
But the world has been based on fiat currency since 1971 when the world was taken off the Bretton Woods Agreement and the convertibility of the U.S. dollar into gold. Since then, the world revolves around the U.S. dollar. But now the U.S. dollar is being challenged. It is not just the BRICS buying gold but a host of other countries, as well many who want to join BRICS. The buying of gold is not so much to back their currencies with gold but to diversify out of U.S. dollars. Gold is nobody’s liability. That helps explain the big drop in foreign holdings of U.S. treasuries. While we note that foreign holdings of U.S. treasuries rose slightly in December 2022 up $45.9 billion, we are still down $425.9 billion in the past year with most of the drop coming in Japan (currency related?) and China.
Most of the slack is being picked up, we note, from Western central banks as BRICS and others drop U.S. dollar treasuries. Note that last year the U.S. seized Russia’s reserves. That in turn has led to some fear that if it can
happen to Russia it could happen to anyone. The result is, sell U.S. dollar reserves and buy gold. That none of this appears to show up in the price of gold is not surprising since it is the paper market that generally drives the price of gold, not the physical market. Nonetheless, this is just another sign of the growing divide in the world. The weaponization of the financial system as we are seeing with growing sanctions, embargoes, and more could eventually lead to the collapse of the current global financial system. Globalization, which has allowed the world to prosper, is also on the ropes.
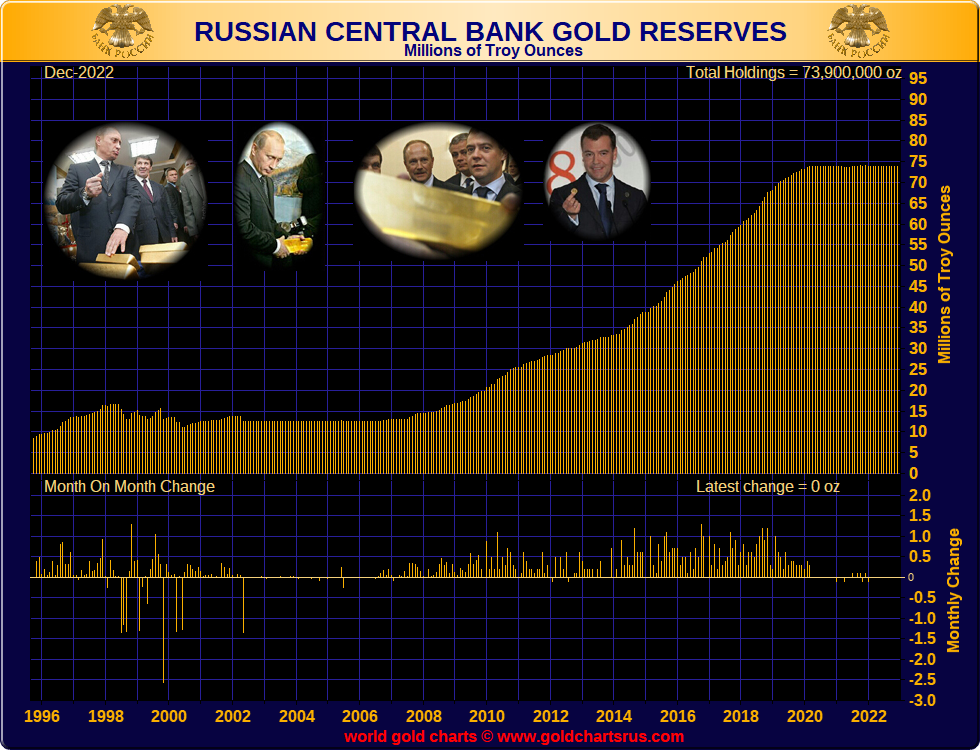
Source: www.goldchartsrus.com
The Russian stock market remains depressed. The MOEX, Russia’s major stock index, collapsed some 55% after the February 24, 2022 invasion. It has remained depressed ever since. Many of the major companies on the MOEX such as Rosneft, Transneft, and Gazprom are on sanction lists, mostly for financings. No surprise that
Russia is the most sanctioned country in the world, far exceeding the next most sanctioned country, Iran. Given that the sanctions largely emanate from Western countries such the U.S., the EU, Canada, U.K., etc., it is
also no surprise that Russia finds workarounds as large parts of the world, including China, have refused to join U.S. sanctions even at the risk of U.S. sanctions against them.
MOEX, Russia Stock Index, 2013–2023
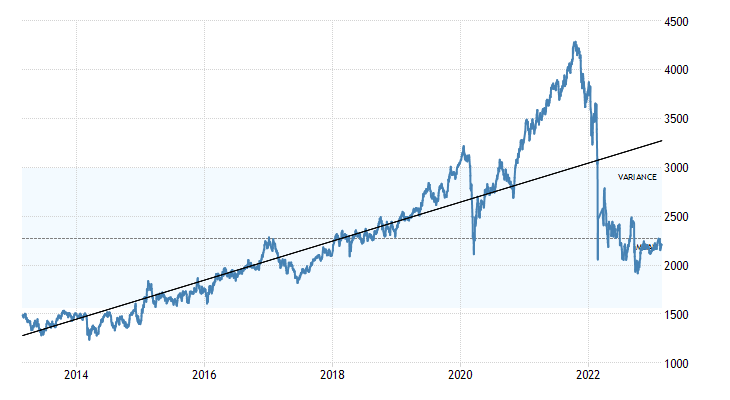
Source: www.tradingeconomics.com
Sanctions, embargoes, and trade wars are the grist that could cause economic depressions. 1930s redux? The World Trade Organization (www.wto.org) has already stated that they expect a significant slowdown in world trade in 2023, even as 2022 hit a record but faded badly in the second half of the year. Russia remains a commodity powerhouse. They were before the invasion the world’s largest exporter of wheat, iron, natural gas, and nickel. Russia and Belarus are major exporters of fertilizers. Russia was also a major exporter of crude petroleum, energy products, gold, coal, palladium, and much more. If it is not going to Western countries, it is going to others instead. Grant you, imports of important electronics, telecommunications, medical equipment, machinery, etc. have been curtailed to Russia; however, they can source these elsewhere from friendly countries such as China.
Russia’s earnings from oil and gas have fallen, but were last reported at roughly $550 billion/day. That is down from the $672 billion/day received in May of 2021 and off the peak of $937 billion/day seen a year ago May 2022 when oil and gas prices soared. This has occurred despite price caps on Russia’s oil and boycotts of its oil. Others have picked up the slack for Russian fossil fuels as they continue to find alternative markets albeit at
somewhat discounted prices. It is also noted that Russia is cutting production by at least 500,000 bpd to combat price caps.
One year since the invasion sees Russia economically weaker but not as significantly as many hoped for. Yet the blowback against the Western nations continues. More sanctions have been placed on Russia that could impact other companies in other countries as well. How they respond is anybody’s guess. To date, Russia has
found numerous workarounds. However, many are now predicting that while Russia appears to have gone through the past year in reasonable shape, they may not be so lucky in the second year. We await evidence.
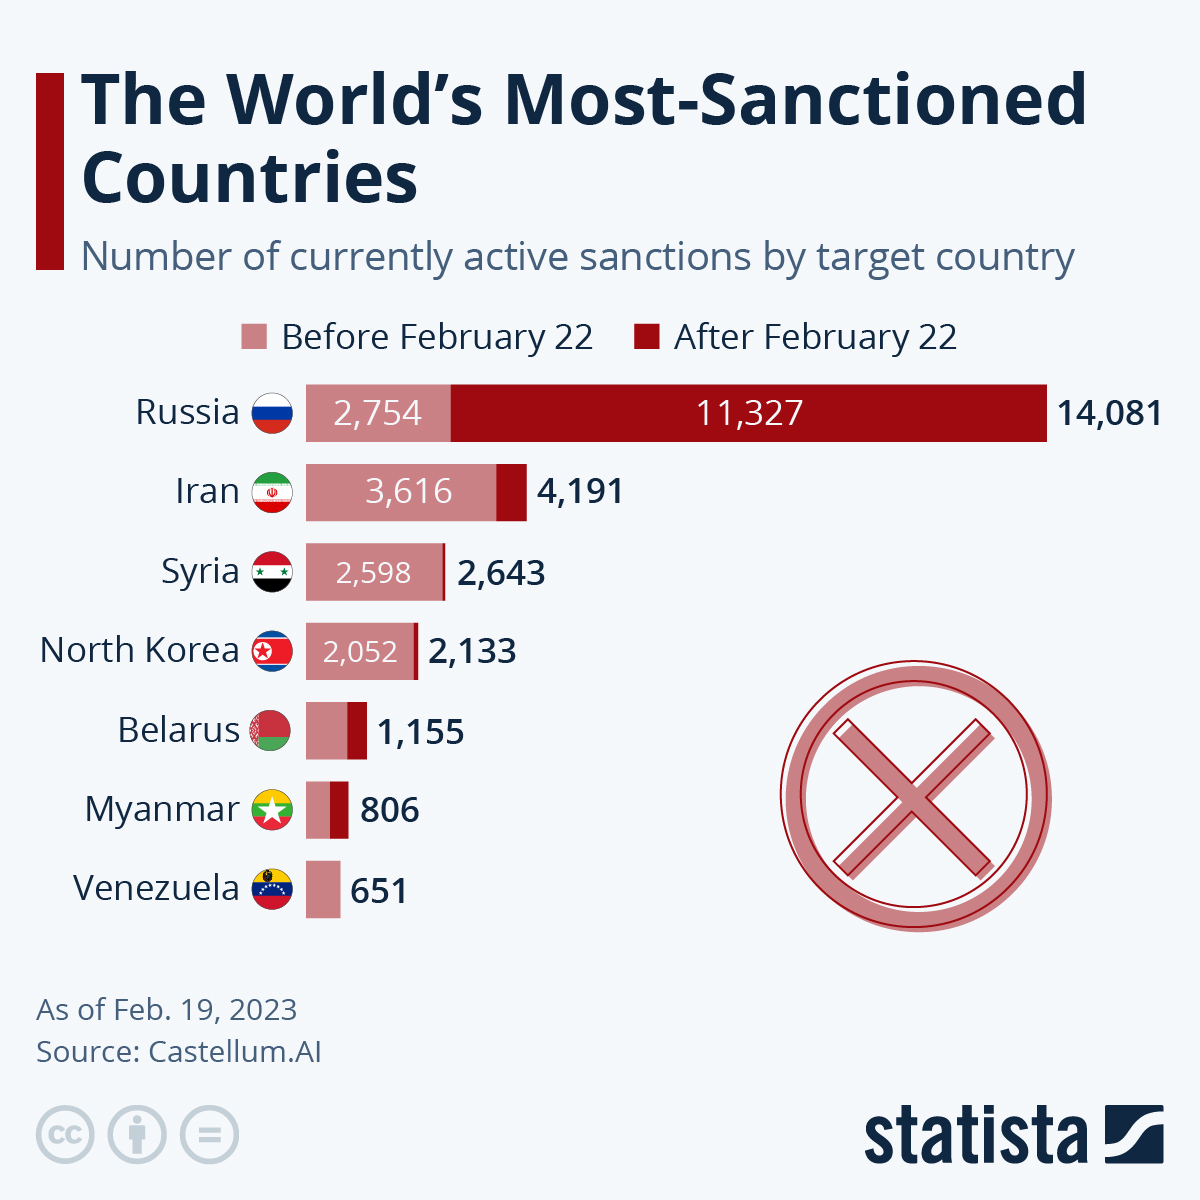
Source: www.statista.com
Chart of the Week
S&P 500 Inflation-Adjusted 1948–2023
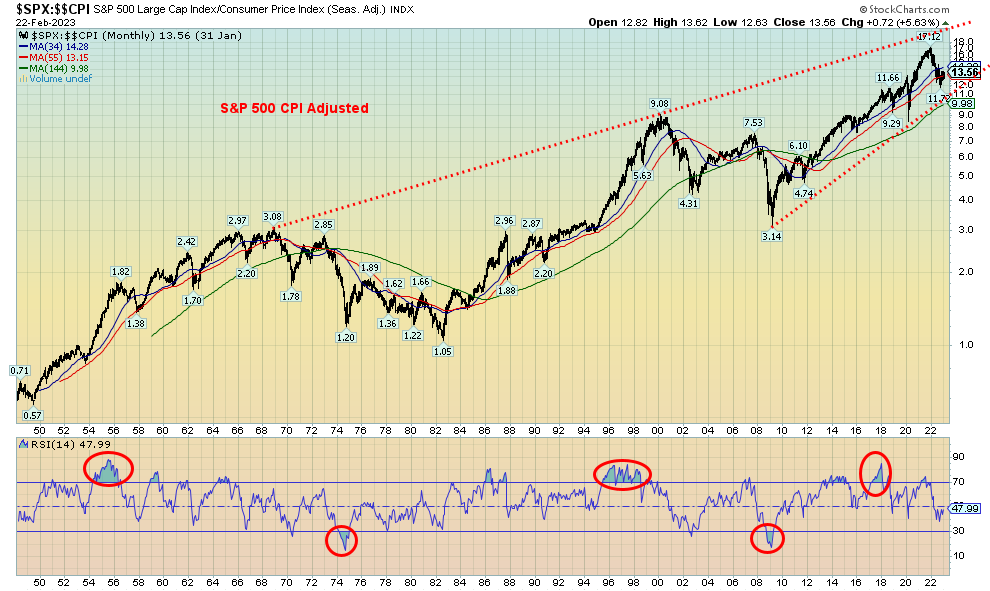
Source: www.stockcharts.com
Sometimes it is good to sit back and look at the big picture from a different angle. Above is the S&P 500 dating back to 1948, inflation-adjusted by the CPI. What we see is a rising S&P 500, still in a long-term uptrend that got underway out of the financial crisis of 2007‑2009. The crossover of the 34-month MA to the 55-month MA occurred in February/March 2012. Think of it as the golden cross of monthly charts. The long-term MA is the 144-month MA (12 years MA). The S&P 500 dipped below that very long MA twice—roughly from 1972 to 1984 then again from September 2008 to March 2012. At this point we do not appear to be in danger of crossing below that line. On an inflation-adjusted basis, that 1982 low was actually below the high of September 1929. It took the S&P 500 29 years before it recovered the 1929 high, it took 26 years to recover the November 1968 high, and it took the S&P 500 16 years to recover to the March 2000 high.
What’s concerning us is what appears as an ascending wedge forming on the S&P 500 inflation-adjusted. If that is correct, it has bearish implications. A breakdown under the 144-month MA, currently near
10, could suggest a longer-term bear market and years of underperformance, much as we saw in the two previous periods. The breakdown would put the S&P 500 close to the March 2020 pandemic low of 2,191.
For comparison’s sake, we also show gold inflation-adjusted from 1973. This is followed by a chart of WTI Oil inflation-adjusted from 1953.
Gold Inflation-Adjusted 1973–2023
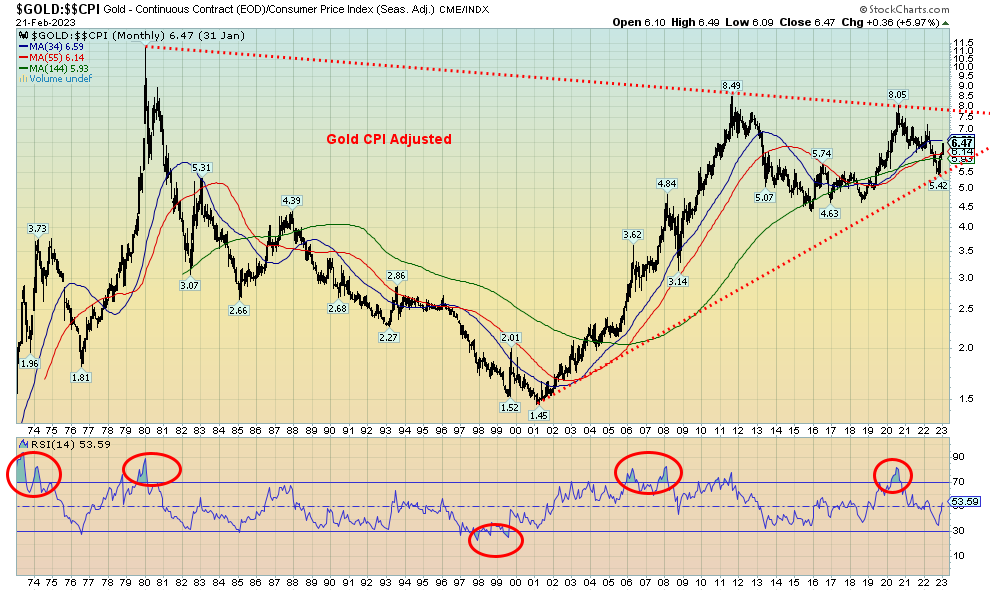
Source: www.stockcharts.com
The picture on gold is quite different. Gold remains below the inflation-adjusted high of January 1980. Yes, we approached it in August 2011 but then fell short. The second attempt in August 2020 also fell short. On that basis, we are twelve years since our last high in August 2011. Once again, we appear to be in a rising market making a higher low. We could say we are forming a huge ascending triangle which is bullish. The bigger picture shows what appears to be a huge symmetrical triangle. Irrespective of this, we are 43 years after that high of January 1980 and it remains the high point. The 2001 low actually put gold at a lower price then where it was in 1934 when FDR raised the price to $35/oz.
To fulfill the potential bullish pattern, we’d have to break out over 8.0 to suggest a big move higher. That translates into roughly $2,100. The preference is not to break those lows.
WTI Oil Inflation-Adjusted 1953–2023
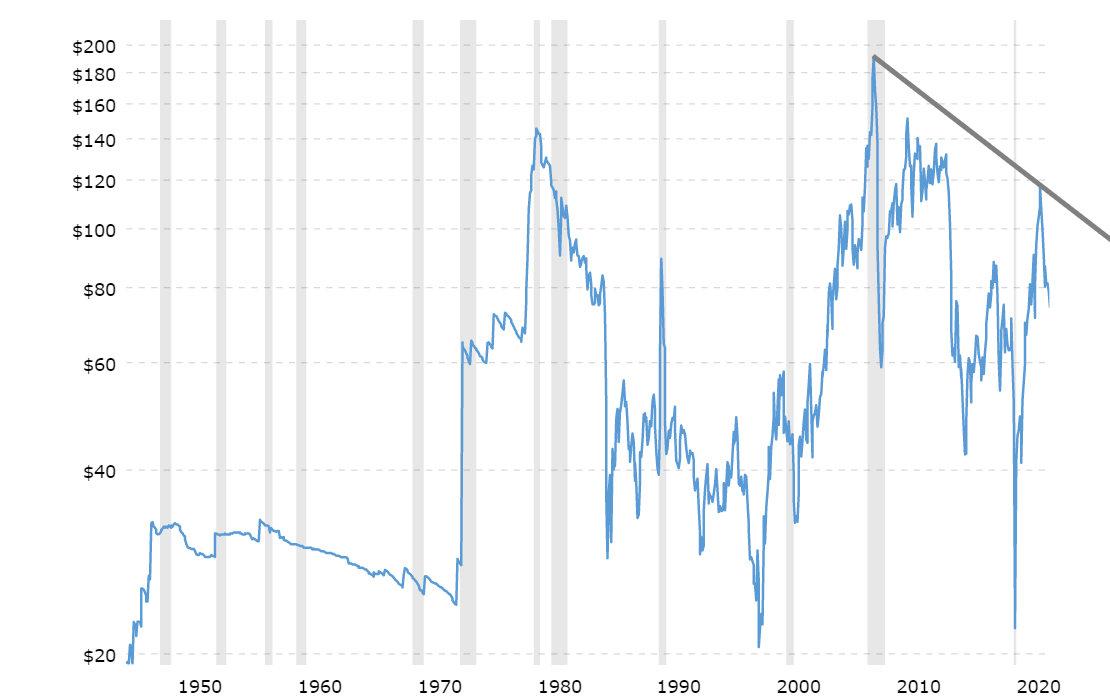
Source: www.macrotrends.net
Despite any complaints about the high price of oil, this chart is revealing. The oil price today is about where it was in 1984. The same could be said about gasoline prices at the pump. By these measures, oil and gasoline remain cheap. Notice how, in the late 1990s and again during the pandemic panic of 2020, oil prices fell to levels not seen since the 1940s. On an inflation-adjusted basis, of course.
Adjusting commodities and the stock market to take into account inflation gives us a different picture than does the nominal stock market, gold, and oil.
Markets & Trends
|
|
|
|
% Gains (Losses) Trends
|
|
||||
|
|
Close Dec 31/22 |
Close Feb 24/23 |
Week |
YTD |
Daily (Short Term) |
Weekly (Intermediate) |
Monthly (Long Term) |
|
|
Stock Market Indices |
|
|
|
|
|
|
|
|
|
`S&P 500 |
3,839.50 |
3,970.04 |
(2.7)% |
3.4% |
down (weak) |
up (weak) |
up (weak) |
|
|
Dow Jones Industrials |
33,147.25 |
33,826.69 |
(3.0)% |
(1.0)% |
down |
up (weak) |
up (weak) |
|
|
Dow Jones Transport |
13,391.91 |
14,629.01 |
(3.4)% |
9.2% |
neutral |
up |
up |
|
|
NASDAQ |
10,466.48 |
11,394.94 |
(3.3)% |
8.9% |
neutral |
neutral |
neutral |
|
|
S&P/TSX Composite |
19,384.92 |
20,219.19 |
(1.4)% |
4.3% |
down (weak) |
up |
up |
|
|
S&P/TSX Venture (CDNX) |
570.27 |
616.86 |
(1.7)% |
8.2% |
neutral |
neutral |
down |
|
|
S&P 600 (small) |
1,157.53 |
1,247.72 |
(2.7)% |
7.8% |
neutral |
up |
up |
|
|
MSCI World Index |
1,977.74 |
2,088.53 |
(1.4)% |
5.6% |
neutral |
up |
up (weak) |
|
|
Bitcoin |
16,535.23 |
23,455.57 |
(2.8)% |
41.9% |
up |
up |
up |
|
|
|
|
|
|
|
|
|
|
|
|
Gold Mining Stock Indices |
|
|
|
|
|
|
|
|
|
Gold Bugs Index (HUI) |
229.75 |
213.85 |
(4.7)% |
(6.9)% |
down |
neutral |
neutral |
|
|
TSX Gold Index (TGD) |
277.68 |
261.03 |
(3.5)% |
(6.0)% |
down |
neutral |
neutral |
|
|
|
|
|
|
|
|
|
|
|
|
% |
|
|
|
|
|
|
|
|
|
U.S. 10-Year Treasury Bond yield |
3.88% |
3.95% |
3.4% |
1.8% |
|
|
|
|
|
Cdn. 10-Year Bond CGB yield |
3.29% |
3.39% |
3.0% |
3.0% |
|
|
|
|
|
Recession Watch Spreads |
|
|
|
|
|
|
|
|
|
U.S. 2-year 10-year Treasury spread |
(0.55)% |
(0.86)% |
(7.5)% |
(56.4)% |
|
|
|
|
|
Cdn 2-year 10-year CGB spread |
(0.76)% |
(0.89)% |
(3.5)% |
(17.1)% |
|
|
|
|
|
|
|
|
|
|
|
|
|
|
|
Currencies |
|
|
|
|
|
|
|
|
|
US$ Index |
103.27 |
105.16 |
1.3% |
1.8% |
up |
down (weak) |
up |
|
|
Canadian $ |
73.92 |
73.49 |
(1.0)% |
(0.6)% |
down |
down |
down |
|
|
Euro |
107.04 |
105.47 |
(1.4)% |
(1.5)% |
down |
up |
down |
|
|
Swiss Franc |
108.15 |
106.29 |
(1.7)% |
(1.7)% |
down |
up |
neutral |
|
|
British Pound |
120.96 |
119.43 |
(0.8)% |
(1.3)% |
down |
neutral |
down |
|
|
Japanese Yen |
76.27 |
73.30 |
(1.6)% |
(3.9)% |
down |
neutral |
down |
|
|
|
|
|
|
|
|
|
|
|
|
|
|
|
|
|
|
|
|
|
|
Precious Metals |
|
|
|
|
|
|
|
|
|
Gold |
1,826.20 |
1817.10 |
(1.8)% |
(0.5)% |
down |
up (weak) |
up |
|
|
Silver |
24.04 |
20.94 |
(3.6)% |
(12.9)% |
down |
neutral |
up (weak) |
|
|
Platinum |
1,082.90 |
907.90 |
(1.5)% |
(16.2)% |
down |
neutral |
up |
|
|
|
|
|
|
|
|
|
|
|
|
Base Metals |
|
|
|
|
|
|
|
|
|
Palladium |
1,798.00 |
1,378.40 |
(7.6)% |
(23.3)% |
down |
down |
down |
|
|
Copper |
3.81 |
3.95 |
(3.9)% |
3.7% |
down |
up |
up (weak) |
|
|
|
|
|
|
|
|
|
|
|
|
Energy |
|
|
|
|
|
|
|
|
|
WTI Oil |
80.26 |
76.32 |
(0.3)% |
(4.9)% |
down |
down |
up (weak) |
|
|
Nat Gas |
4.48 |
2.55 (new lows) |
11.8% |
(43.1)% |
down |
down |
down (weak) |
|
Source: www.stockcharts.com
Note: For an explanation of the trends, see the glossary at the end of this article.
New highs/lows refer to new 52-week highs/lows and, in some cases, all-time highs.
Source: www.stockcharts.com
Thanks to higher-than-expected inflation, stock markets did not fare very well this past week. The fear now is that the Fed may return to its 50 bp interest rate hikes next at the March 21–22 FOMC. The S&P 500 lost 2.7% this past week, the Dow Jones Industrials (DJI) dropped 3.0% and is now down 1% in 2023, the Dow Jones Transportations (DJT) dropped 3.4%, and the NASDAQ fell 3.3%. The small cap stocks didn’t fare well, either, with the S&P 400 (Mid) down 2.5% and the S&P 600 (Small) off 2.7%. The Russell 1000 dropped 2.7%, the Russell 2000 was off 2.9%, and the Russell 3000 was down 2.7% while the Wilshire 5000 dropped 2.8%. The S&P 500 equal weight index was down 2.8%.
Elsewhere, Bitcoin fell 2.8%, Canada’s TSX Composite was off 1.4%, and the TSX Venture Exchange (CDXN) dropped 1.7%. In the EU, the London FTSE fell 1.6%, the EuroNext dropped 2.2%, the Paris CAC 40 was down 2.2%, and the German DAX fell 1.8%. In Asia, China’s Shanghai Index (SSEC) was a winner, up 1.3% but the Tokyo Nikkei Dow (TKN) was down a small 0.2%. Hong Kong’s Hang Seng Index (HSI) fell sharply again, off 3.4%. All the foreign indices remain in positive territory so far in 2023, but are fading.
March tends to be a bit of a middle month for the stock market—strong in the early going but weak in the latter part of the month. It’s the fifth best month of the year for the S&P 500 and the DJI. Many have nightmare remembrances of March 2020, the pandemic crash. We also remember March 2001 when markets swooned badly during the dot.com crash.
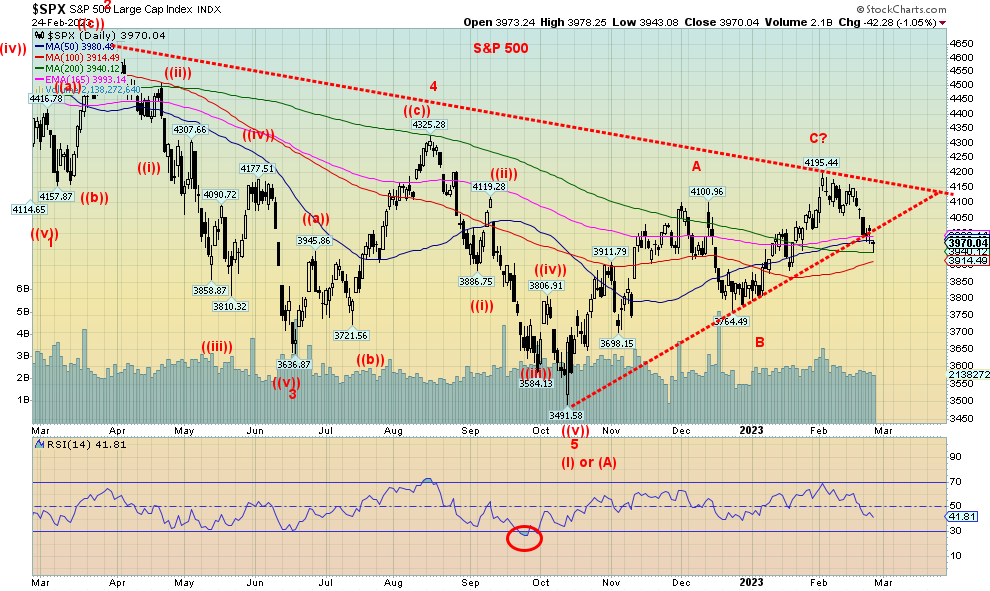
The S&P 500 has broken its uptrend line from the October low. Currently, the 200-day MA is providing support. But a break under 3,900 would be dangerous and under 3,800 we’d consider this rally over. Under 3,700, the bear could resume and under 3,650 new lows are probable. As of now, only a move back above 4,150 could end this downswing and suggest new highs. The excitement of January when everyone was saying that inflation had been beaten has returned to the gloom of February where inflation is rearing its ugly head once again. Inflation beaten? Not yet. Possible 2% inflation once again is just a dream.
Source: www.stockcharts.com
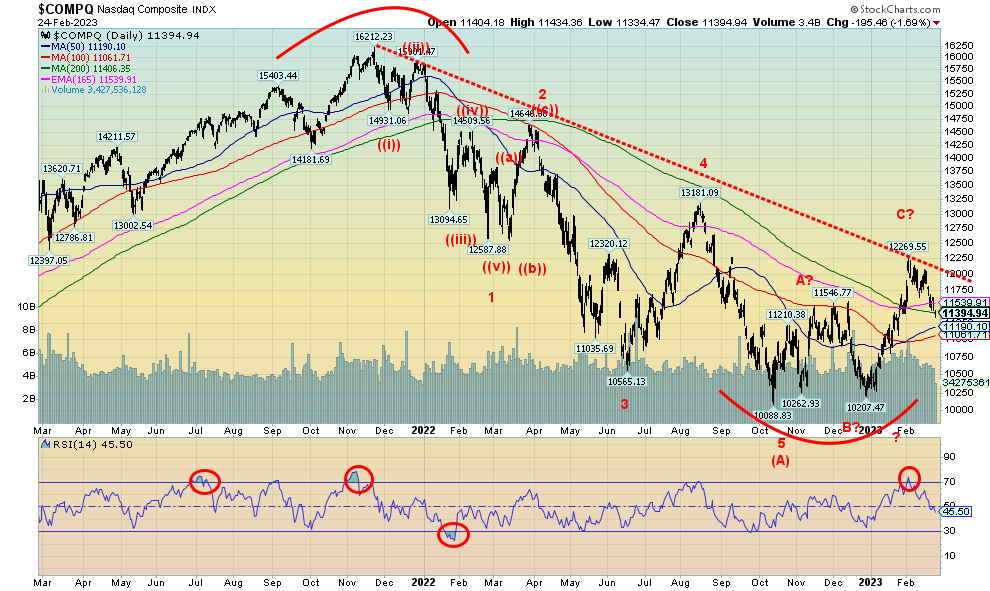
The NASDAQ lost 3.3% this past week as the FAANGs for the most part helped drive it lower. The NY FANG Index lost 2.6%. Nvidia saved the day for the FAANGs, gaining 8.9%, but everywhere else it was red ink, led by Alibaba off 11.0% and Netflix down 8.9%. Baidu lost 6.5% as the Chinese stocks suffered and Tesla was down 5.6%. The NASDAQ has still not fallen into super-dangerous territory. That won’t come until we break under 11,000. With an RSI of only 45.50, the NASDAQ is rather neutral here. It also suggests that it may have more downside before it becomes oversold. The index is already suggesting that it should head lower rather than rebounding.
Source: www.stockcharts.com
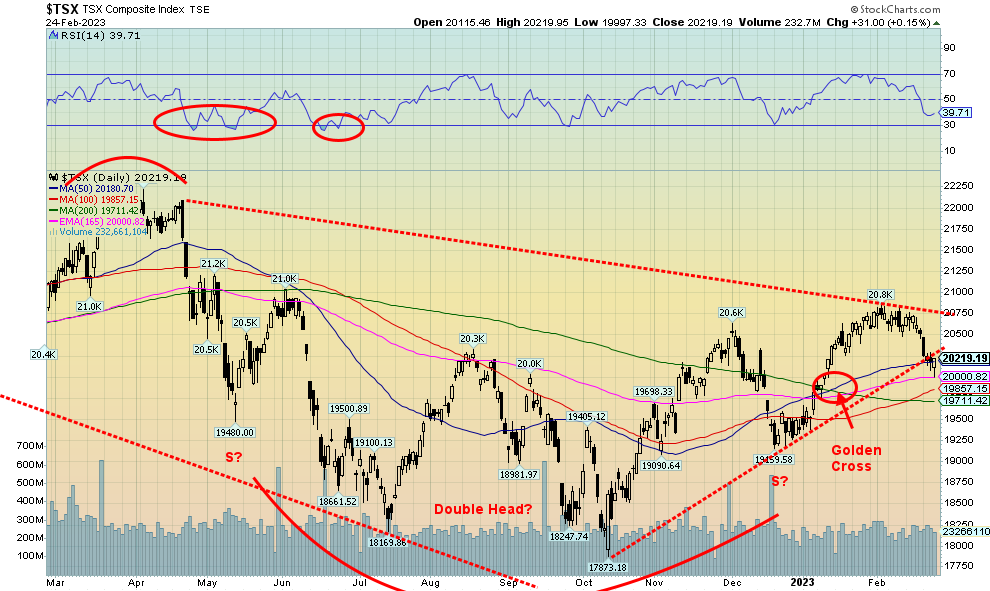
The TSX Composite fell this past week by 1.4%. The TSX Venture Exchange (CDNX) fared worse, losing 1.7%. Both indices remain up on the year, the TSX up 4.3% and the CDNX up 8.2%. Only one of the 14 sub-indices gained on the week: Energy (TEN), up 2.5%. If the TEN had fallen into negative territory the TSX would have fared worse as TEN is the second-largest component behind Financials. Leading the way of the losers was Metals & Mining (TGM), down 5.4%. Information Technology (TKK) was down 3.3% and Golds (TGD) lost 3.5%, rounding out the biggest losers. The TSX appears to be breaking the uptrend line from the October 2022 low. However, major support lies down to the 200-day MA near 19,700. A firm break under that level, however, could send the TSX down further to major support near 19,450. Only new highs above 20,800 could change the current negative scenario. But with the uptrend line breaking, more losses are now expected. A break of 19,450 would be especially negative as it would shatter the illusion that we may have formed a double head and shoulders bottoming pattern. Friday’s reversal to come back to slightly up on the day could buoy the early part of the coming week.
U.S. 10-year Treasury Bond/Canadian 10-year Government Bond (CGB)
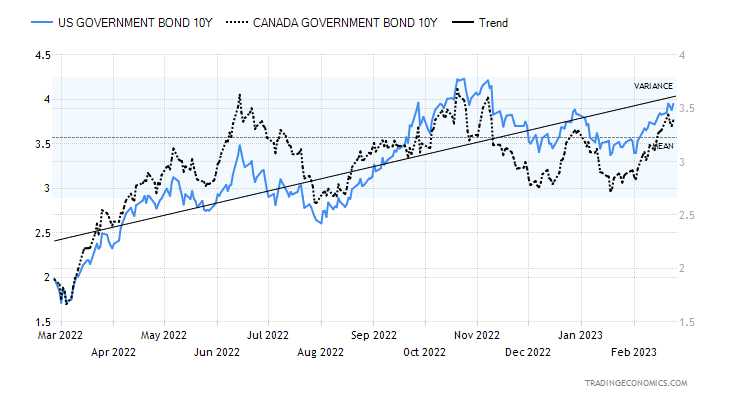
Source: www.tradingeconomics.com, www.home.treasury.gov, www.bankofcanada.ca
Bond yields are rising—of that there is no doubt. This past week the 10-year U.S. treasury note rose to 3.95% from 3.82%. Canada rose to with the 10-year Government of Canada bond (CGB) up to 3.39% from 3.29%. The catalyst? Inflation, as the GDP price deflator and the PCE price index rose above expectations. In Canada too, the CPI and especially food inflation both rose above expectations. Back on are thoughts that the Fed might go back to hiking 50 bp again at the March 21–22 FOMC. Some thought the BofC might back out of its thoughts of pausing. What that means is yields are going higher. And that puts pressure on a host of other interest rates such as car loans, LoCs, credit cards, and mortgages. Debt, already a bugaboo, became a bigger bugaboo. U.S. household debt rose 2.4% in the Q4 2022 to $16.9 trillion. While still at low levels, delinquencies for mortgages, credit cards, and auto loans are also rising. And rising interest rates are not helping. As debt has increased, the intertwined financial health of lenders and borrowers has come precariously to depend on rosy economic forecasts (Alonzo Garza, the Daily Dose July 2018).
In 2022, the 10-year broke a downtrend line that had been in place for 42 years since 1980. The era of low interest rates was now officially over. High interest rates are undoubtedly now here to stay. Grant you, interest rates were held artificially low for far too long. The 2000–2002 dot.com recession, the 2007–2009 financial crisis, and the 2020 pandemic all conspired to push interest rates down to unheard levels that had never been seen in the long history of yields. And with low interest rates, borrowing exploded. Along with low interest rates there was an explosion of liquidity into markets through quantitative easing (QE). But did that money go into productive use? No, it went into speculation in the stock market, housing, cryptos, meme stocks, etc. It did
keep the economy going and consumer spending rose. Household debt to GDP rose, although it has been coming down thanks to growth in GDP. The U.S. household debt is lower than it was before the financial crisis of 2007–2009. But Canada’s is up to 103.7%, one of the highest in the world despite improving from a high of 112.6%. Total private debt to GDP is roughly 280% for both Canada and the U.S.
U.S. Consumer Debt and Consumer Spending 1998–2023
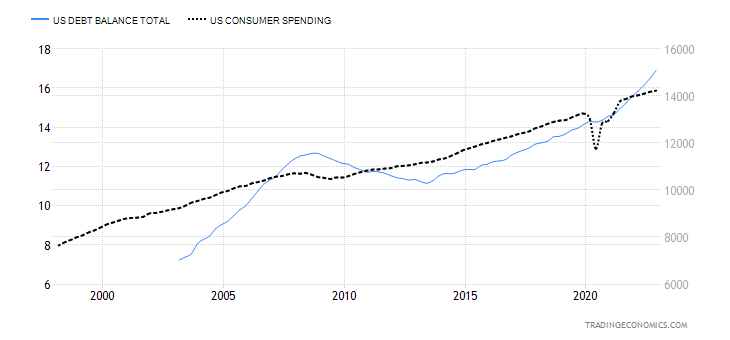
Source: www.tradingeconomics.com, www.nyfed.org, www.bea.gov
Household Debt to GDP Canada and the U.S. 1998–2023
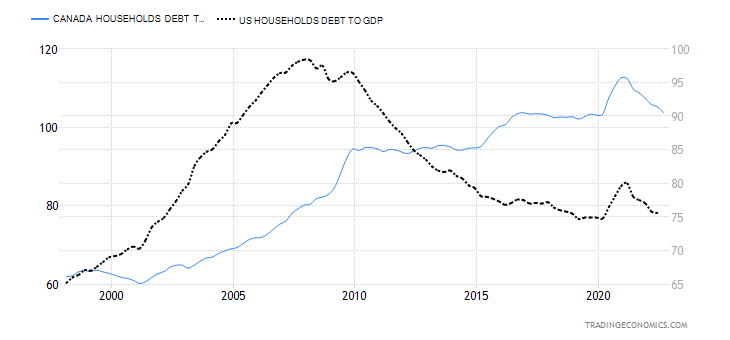
Source: www.tradingeconomics.com, www.statcan.gc.ca, www.bis.org
Private Debt to GDP Canada and U.S. 1995-2023
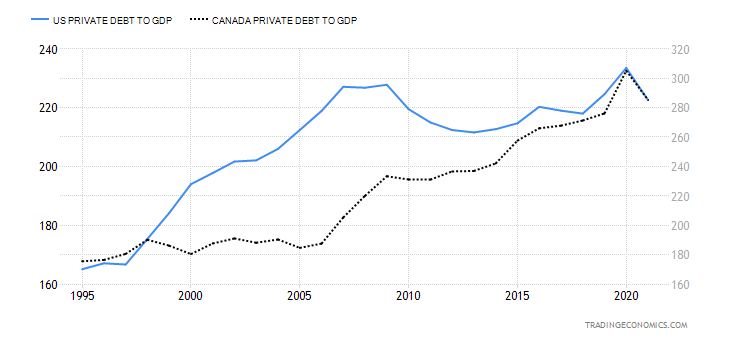
Source: www.tradingeconomics.com, www.oecd.org,
Once delinquencies become a problem, consumer spending will slow down. But, so far, it is not happening. The Michigan Consumer Sentiment Index rose to 67% in February, the highest level since January 2022. But the index is still down at levels last seen during the 1973–1975, 1980–1982, and 2007–2009 recessions. But, supposedly, we are not in a recession—yet.
Michigan Consumer Sentiment Index 1950–2023
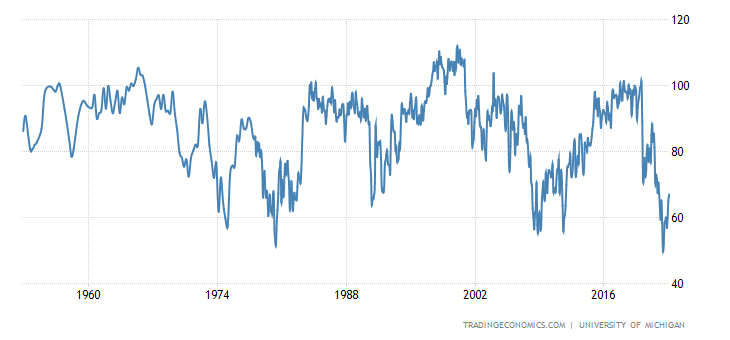
Source: www.tradingeconomics.com, www.UMich.edu
Not a lot of numbers this coming week, but durable goods on Monday and a number of manufacturing indices and PMIs are out. In Canada, they report Q4 GDP. Surprisingly, the job numbers are not out until March 10 and not on the first Friday, as is usually the case.
A rise now above 4.04% for the 10-year could suggest new highs above 4.25% the previous high yield. In theory, a breakout above that level could project up to almost 5.00% for the 10-year. That might slow things down.
Source: www.stockcharts.com
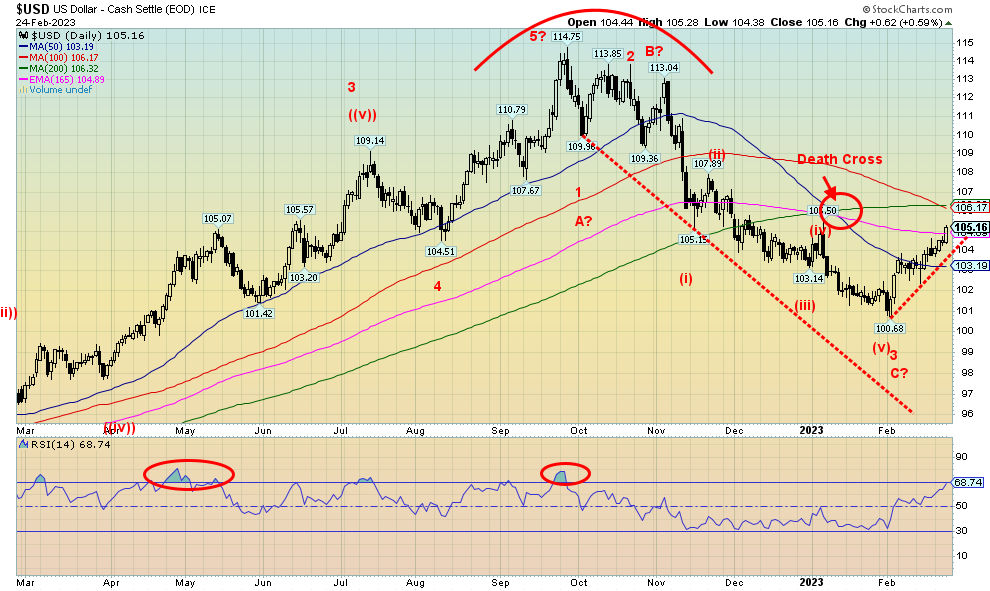
Stronger-than-expected inflation, an economy that is still growing, and employment remaining high are all helping to put a shine back on the US$ Index. This past week the US$ Index (USDX) rose 1.3%. Currencies suffered. The euro fell 1.4%, the Swiss franc lost 1.7%, the pound sterling was off 0.8%, and the Japanese yen dropped 1.6%. The Canadian dollar wasn’t spared, falling 1.0%. For USDX, it is the highest level since December. Targets still appear to be up around the 50-day MA near 106. A move above 106 could start another up wave towards 108. None of this is good for gold. However, gold can gain in the falling currencies. Only a move back under 103 could end this rally. Under 102 it would be definitely over. Under 101.70 new lows are probable. We can see solid resistance in the 107/109 zone, so it is possible we’ll test that level before this is over. We are viewing this as a correction to the decline from 114.75 to 100.68. A normal 50% correction would take us to 107.75. Only a move above 111.50 could suggest possible new highs.
Source: www.stockcharts.com
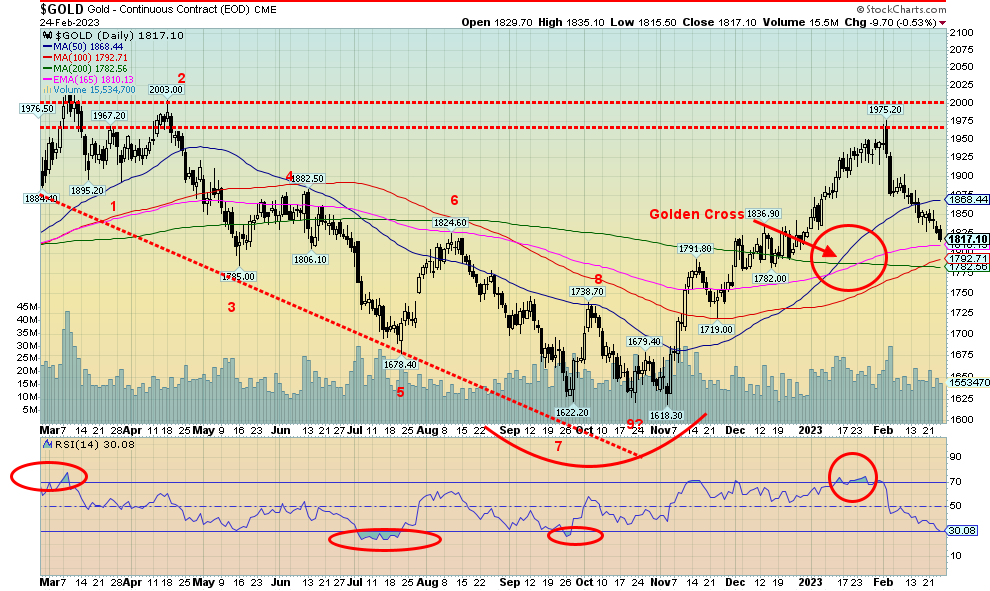
Continued signs of inflation, a strong U.S. dollar, and rising bond yields all helped to push gold prices lower once again this past week. Gold fell for the fourth consecutive week, losing 1.8%. None of the other metals were very cooperative, either. Silver fell 3.6% and platinum was down 1.5%. Palladium continued its woes as last year’s bull turns to this year’s bear. Palladium is being pressured lower by moves to electric cars that don’t really use palladium. Palladium lost 7.6% this past week and is now down 23.3% on the year. Copper also turned down, off 3.9%. The gold stocks took it on the chin as well with the Gold Bugs Index (HUI) down 4.7% and the TSX Gold Index (TGD) off 3.5%. Misery all around.
We still have no updated COT report. The CFTC is finally getting back to some normalcy but still has a long way to go. We are now up to the end of January as numbers start to get posted. So far, gold has retraced some 44% of the recent rise from $1,618 to $1,975. We knew that $1,975 was going to prove a difficult resistance and it has delivered in spades. The rise was 22% for gold but the fall has been 8% off the top. Gold is now down on the year by a small 0.5%. The RSI has fallen to 30, just above oversold territory. Ten percent corrections in a bull market for gold are not unusual. During its run from 2008 to 2011 there were more than a few pullbacks of 10% of more. The question we have asked before is, have we put in our major 7.83-year and 23.5-year cycle lows? Ideally, they’d be better placed later this year, October to December. However, as we noted with rather potentially scary charts we showed earlier, a decline to $1,200/$1,500 could occur to satisfy our long-term cycle lows.
Gold is still hanging above our $1,775/$1,800 breakdown zone. That could trigger a move down to $1,720 and our next breakdown zone. Below $1,700, new lows are probable. We need a move back above $1,875 to confirm a low.
Source: www.stockcharts.com
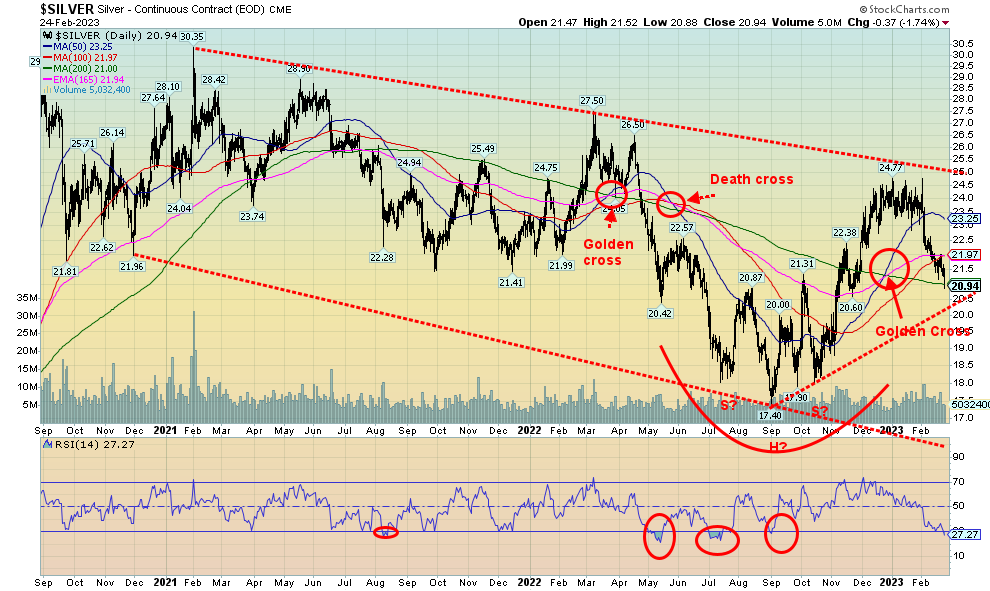
Silver continued its recent slide, falling a further 3.6% this past week and now down 12.9% in 2023. No joy. While we are working on a golden cross, we look nervously at the whiplash seen back in March/May 2022 when we had a golden cross and soon after a death cross. The death cross won. Silver prices can be volatile as this chart suggests with sharp up and down moves. Even the rise in 2011 to record levels near $50 saw numerous pullbacks for silver of 15% or more. Silver has achieved one of our targets of $20.90. A firm break under that level could next target $20.25. Below that level, a further breakdown could occur. Under $19.15 new lows are probable. Silver gained 42% from the September 2022 low, so a pull back now of roughly 50% is not unusual. A move above $22 would help suggest a low. A move above $23.25 would be quite positive and confirm a low. With an RSI at 27 we are oversold, but we can remain that way for at least a short time. We did that last back in July 2022. A negative is the Daily Sentiment Indicator (DSI) which is at a neutral 50, suggesting further declines are possible.
Source: www.stockcharts.com
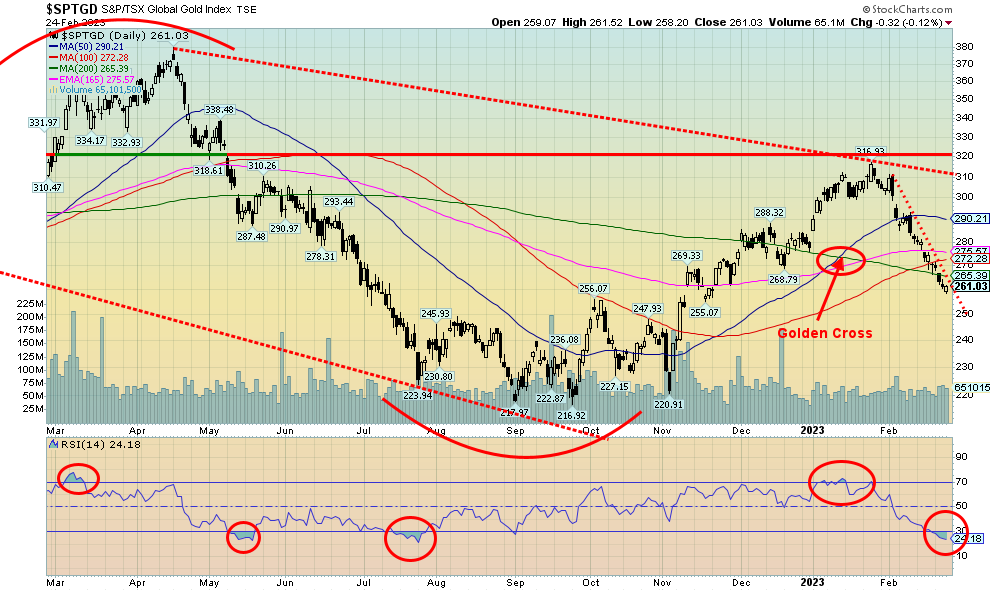
Gold stocks continued their recent relentless decline as the TSX Gold Index (TGD) fell 3.5% this past week and the Gold Bugs Index (HUI) was off 4.7%. It was the fifth consecutive weekly decline and now leaves the TGD almost 18% off its recent highs. That’s the bad news, but it remains almost 20% above its September 2022 low. Glass half full, or half empty? The RSI is firmly in bear territory at 24. But it is also extremely oversold. It’s been like that before, most recently in the April to July swoon. While we may be working on a golden cross for the TGD, it’s meaningless now that the index has fallen under its 200-day MA. A move back above 275 would be positive and a move above 290 would confirm a low. A major breakout remains a distance away up around 320. The Gold Miners Bullish Percent Index (BPGDM) has fallen to 31, well above the 3.45 recorded in September 2022 but off the recent high of 55.2. Despite the rise that peaked in January at 361, the BPGDM never reached extreme bullish levels.
Gold stocks, particularly the junior mining sector that trades on the TSX Venture Exchange (CDNX), remain mired in apathy. Companies report good news and nobody cares. If anything, it is an excuse to sell. Volumes are low, reflecting that apathy. In a market where the excitement still seems to be with meme stocks and cryptos, the gold mining market, particularly junior gold miners, continues to languish. Many are baffled as to what to do to get this market moving higher. While the TGD is oversold, it doesn’t necessarily mean we’ve hit bottom. Friday’s upside reversal (even though it still closed down) is encouraging, but we need upside follow-through this coming week.
Source: www.stockcharts.com
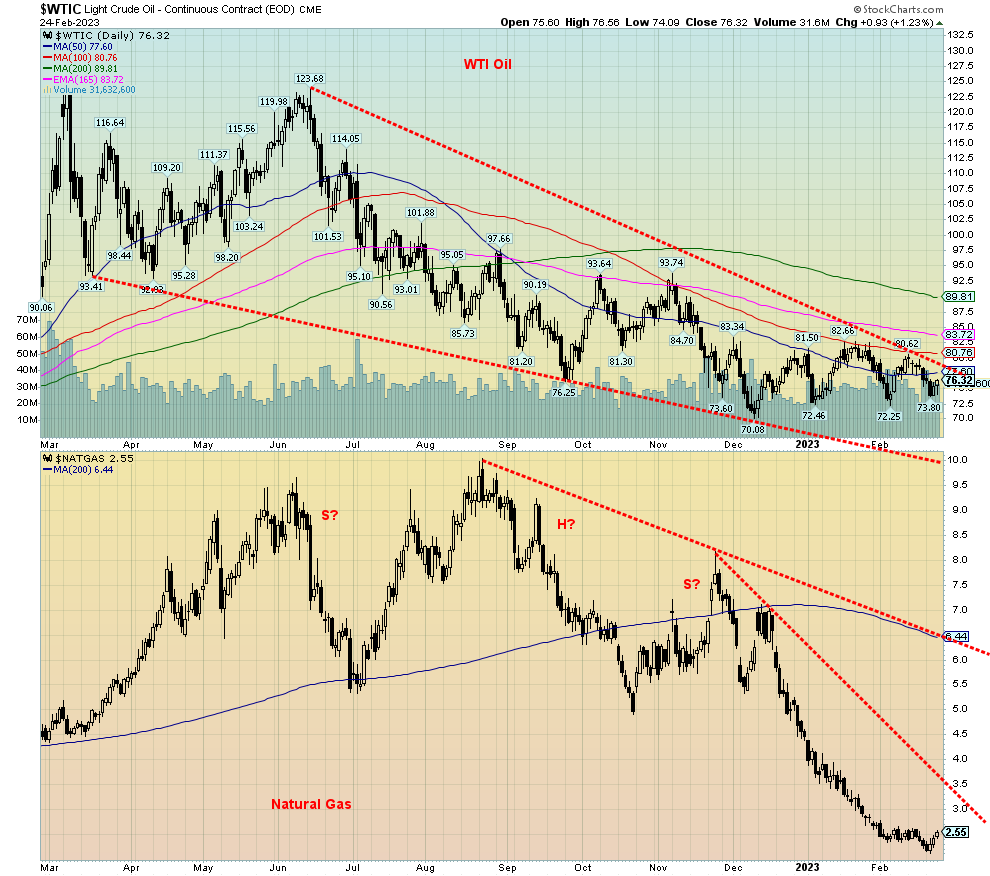
A mixed-up week for oil as a further rise for inventories in the U.S. along with inflation fears put downward pressure on prices, while Russian production cuts and increased Chinese demand put upward pressure. In the end, WTI oil was relatively flat with a 0.3% loss on the week. Brent crude didn’t fare as well, down 3.6%. Natural gas (NG), on the other hand, finally put in a good up week, thanks to winter storms and sharply colder weather this past week. NG put in an outside week reversal by making new lows, then reversing and closing up on the week by 11.8%. EU NG at the Dutch Hub also jumped, but the gain wasn’t quite as much, up 4.0%.
After being pressured lower in the early part of week, energy stocks recovered: the ARCA Oil & Gas Index (XOI) managed a gain of 0.8% and the TSX Energy Index (TEN) jumped 2.5%.
Has NG finally made a bottom? We can’t say that just yet, but this past week was encouraging. The outside week reversal is a very positive sign. But follow-through to the upside week is now important. A move back above $2.65 would be very positive and help confirm that a low is in. As to oil, the descending wedge triangle still looks good and a firm breakout above $78 could now start an upward move. A move over $81/$82 would go a long to confirming a low. Projections then could be up to $90 with outside projections to rise to $124. What would spark a big jump in the price of oil? Well, some little-noticed stories in Middle Eastern newspapers suggest that Israel could be preparing to attack Iran over its nuclear program. If that happened, oil prices could soar. Iran has threatened in the past to block the Straits of Hormuz where upwards of 30% of the world’s oil supply passes through. That could trigger a bigger conflict as the U.S. 5th Fleet is stationed in Bahrain in the Persian Gulf. A reminder that this scenario is speculative at this time.
The reversal for NG is good news for long-suffering holders of NG. WTI oil continues to make what looks like a bottom pattern with now four attempts to break down and lows at $70, $72.50, $72.25 and $73.80. Obviously, a breakdown under those levels would be quite negative. But the pattern appears bullish to us so it is a question of when oil might break out.
Copyright David Chapman 2023
|
GLOSSARY Trends Daily – Short-term trend (For swing traders) Weekly – Intermediate-term trend (For long-term trend followers) Monthly – Long-term secular trend (For long-term trend followers) Up – The trend is up. Down – The trend is down Neutral – Indicators are mostly neutral. A trend change might be in the offing. Weak – The trend is still up or down but it is weakening. It is also a sign that the trend might change. Topping – Indicators are suggesting that while the trend remains up there are considerable signs that suggest that the market is topping. Bottoming – Indicators are suggesting that while the trend is down there are considerable signs that suggest that the market is bottoming. |
Disclaimer
David Chapman is not a registered advisory service and is not an exempt market dealer (EMD) nor a licensed financial advisor. He does not and cannot give individualised market advice. David Chapman has worked in the financial industry for over 40 years including large financial corporations, banks, and investment dealers. The information in this newsletter is intended only for informational and educational purposes. It should not be construed as an offer, a solicitation of an offer or sale of any security. Every effort is made to provide accurate and complete information. However, we cannot guarantee that there will be no errors. We make no claims, promises or guarantees about the accuracy, completeness, or adequacy of the contents of this commentary and expressly disclaim liability for errors and omissions in the contents of this commentary. David Chapman will always use his best efforts to ensure the accuracy and timeliness of all information. The reader assumes all risk when trading in securities and David Chapman advises consulting a licensed professional financial advisor or portfolio manager such as Enriched Investing Incorporated before proceeding with any trade or idea presented in this newsletter. David Chapman may own shares in companies mentioned in this newsletter. Before making an investment, prospective investors should review each security’s offering documents which summarize the objectives, fees, expenses and associated risks. David Chapman shares his ideas and opinions for informational and educational purposes only and expects the reader to perform due diligence before considering a position in any security. That includes consulting with your own licensed professional financial advisor such as Enriched Investing Incorporated. Performance is not guaranteed, values change frequently, and past performance may not be repeated.
About the author


Website: https://www.enrichedinvesting.com
Disclaimer: David Chapman is not a registered advisory service and is not an exempt market dealer (EMD) nor a licensed financial advisor. We do not and cannot give individualised market advice. David Chapman has worked in the financial industry for over 40 years including large financial corporations, banks, and investment dealers. The information in this newsletter is intended only for informational and educational purposes. It should not be considered a solicitation of an offer or sale of any security. The reader assumes all risk when trading in securities and David Chapman advises consulting a licensed professional financial advisor before proceeding with any trade or idea presented in this newsletter. David Chapman may own shares in companies mentioned in this newsletter. We share our ideas and opinions for informational and educational purposes only and expect the reader to perform due diligence before considering a position in any security. That includes consulting with your own licensed professional financial advisor.