
“The most important lesson in investing is humility.”
—John Templeton, American-born/British investor, banker, fund manager, philanthropist, founded the Templeton Growth Fund 1954: 1912–2008
“At the end of the day, the most important thing is how good are you at risk control. Ninety-percent of any great trader is going to be the risk control.”
—Paul Tudor Jones II, American billionaire hedge fund manager, conservationist, philanthropist, founder of Tudor Investment Corp. 1980 and also philanthropist organization Robin Hood Foundation, 1988; b. 1954
“The market can stay irrational longer than you can stay solvent.”
—John Maynard Keynes, English economist whose ideas changed macroeconomics and economic policies of governments, father of school of Keynesian Economics; 1883–1946
Oh, yes. January’s first five days: an early warning system. Since 1950, this indicator has, according to studies by the Stock Trader’s Almanac (www.stocktradersalmanac.com), an 83.0% accuracy ratio for up years. The opposite side is, if the first five days are down, then the barometer is accurate only 44% of the time. In other words, how the first five days go can be a barometer of how the year goes. This is extended to January as a whole and is called the January barometer.
We outlined this previously. Now the verdict is in. The first five days of 2023 saw the S&P 500 gain 1.4%, the Dow Jones Industrials (DJI) go up 1.1%, and the TSX Composite gain 2.4%. Gold gained 2.8%, the Gold Bugs Index (HUI) shot up 8.9%, but silver fell 0.7%, a divergence. Not that we’ve seen the January barometer applied to the precious metals market, but we thought we’d note it. So that’s it? 2023 will in the end be a good year? Of course, we await the rest of the month and things could change. We didn’t see the Almanac note what it means if the first five days were up but the month was down. The barometer, devised by Yale Hirsch, the founder of the Stock Trader’s Almanac, based his observations only on the S&P 500. But if one wishes to be an optimist, then 2023 could be better than many expect. The first five trading days was a potentially good omen.
In last week’s Scoop, January 19, 2023 we noted that China had added to their gold reserves and also appeared to be selling off their U.S. treasury holdings. According to numbers available at the U.S. Treasury Department, China’s official holdings of U.S. treasuries have fallen $156 billion in the past year (October 2021–October 2022). This had us wondering what have other central banks been doing.
We tabulated some of the holdings of central banks available at the U.S. Treasury (ticdata.treasury.gov) and were surprised to discover that all foreign holdings of U.S. treasuries had fallen $475 billion in the past year. That was also a bit of a surprise as we all know that the U.S. needs to constantly issue and renew U.S. treasuries (treasury bills, treasury notes, and treasury bonds) to fulfill government spending
requirements. After all, the U.S. government ran a budget deficit $1.375 trillion in 2022. According to the U.S. Debt Clock (www.usdebtclock.org), the total U.S. Federal debt stands now at $31.5 trillion or 121.5% of GDP. It is the highest national debt in the world. That’s an increase of $5.9 trillion since 2020 when the pandemic got underway.
When we ran the numbers, as shown in the table on the next page, we discovered even the G7 nations (outside of the U.S.) also saw their holdings fall by $195 billion. Most of that was attributable to Japan who, surprisingly, saw $242 billion roll off. The BRICS nations, led by China, saw their holdings fall by $176 billion. However, we had no figures for either Russia or South Africa. Our understanding is Russia had already divested itself of all of its U.S. treasuries. And since the Central Bank of the Russian Federation (CBRF) is on the U.S. sanctions list, they’d have a hard time selling, regardless. Even looking at the remaining top ten foreign holders of U.S. treasuries, they also fell by a small $4.5 billion.
So, who bought? After all, when one runs a $1.4 trillion budget deficit, that means issuing a lot of new bonds. Somebody has to buy them. The Fed itself can be a major buyer. But the Fed has reduced its treasury holdings by $167 billion in the past year. The Fed started raising interest rates in March 2022 and they started quantitative tightening (QT) in June 2022. Initially, the Fed was to run off $30 billion a month of U.S. treasuries and $17.5 billion of mortgage-backed securities (MBS). In September 2022 that doubled to $60 billion a month of U.S. treasuries and $35 billion for MBS. Definitely wasn’t the Fed buying.
One of the biggest buyers was intergovernmental agencies. So, who are they? These are arms of the U.S. government that have money to place. Almost invariably they are buying U.S. government securities. In essence, the government is buying its own debt. U.S. intragovernmental holdings are primarily composed of Medicare Trust Funds, the Social Security Trust Fund, and the Federal Financing Bank. By October 2022, they held $6.3 trillion of U.S. treasuries, up some $614 billion in the past year.
The other big gain was holdings held by the public which includes the above-noted foreign holders. In total, the public held in October 2022 $22.6 trillion of U.S. treasuries, up $1.7 trillion in the year. But foreign holders shed $475 billion, so that means it actually went up $2.1 trillion. Who are they? Well, banks, insurance companies, bond funds, hedge funds, etc. We’d say individuals, but that would be small. Seems that the banks and insurance companies were brimming in cash over the past year and they have to place the money somewhere. Some obviously made it into the stock markets, but most of it is just parked in U.S. treasuries. After all, banks weren’t making large amounts of loans and they have to do something with all that money. (See chart following the table).
One of the reasons premised as to why China is running down its holdings of U.S. treasuries is that China, according to economist Martin Armstrong (www.armstrongeconomics.com), is actually preparing for war with the U.S. The last thing China would want is to be caught with billions of dollars of U.S. treasuries that the U.S. freezes. It’s an intriguing premise, but it doesn’t explain why Japan’s holdings have fallen even more. However, Japan, who is facing budget deficits, could be selling to cover needs. Japan is a major importer of commodities to run its industries.
Where are all the U.S. Treasuries going?
($Billions)
|
|
One Year Ago, Oct 2021 |
Latest Oct 2022 |
Difference |
|
G7 Countries |
|
|
|
|
Canada |
$200.3 |
$215.1 |
$14.8 |
|
United Kingdom |
$580.2 |
$638.5 |
$58.3 |
|
Germany |
$83.8 |
$85.9 |
$2.1 |
|
France |
$239.7 |
$218.4 |
($21.3) |
|
Italy |
$43.6 |
$36.9 |
($6.7) |
|
Japan |
$1,320.4 |
$1,078.2 |
($242.2) |
|
|
|
|
|
|
Total G7 |
$2,468.0 |
$2,273.0 |
($195.0) |
|
|
|
|
|
|
BRICS |
|
|
|
|
Brazil |
$247.7 |
$224.8 |
($22.9) |
|
Russia |
ND |
ND |
ND |
|
India |
$210.7 |
$213.0 |
$2.3 |
|
China |
$1,065.4 |
$909.6 |
($155.8) |
|
South Africa |
ND |
ND |
ND |
|
|
|
|
|
|
Total BRICS |
$1,523.8 |
$1,347.4 |
($176.4) |
|
|
|
|
|
|
In Top Ten Holders |
|
|
|
|
Belgium |
$225.8 |
$327.3 |
$101.5 |
|
Cayman Islands |
$271.9 |
$296.6 |
$24.7 |
|
Luxemburg |
$314.3 |
$295.7 |
($18.6) |
|
Switzerland |
$289.9 |
$262.9 |
($27.0) |
|
Ireland |
$324.1 |
$239.0 |
($85.1) |
|
|
|
|
|
|
Total Remainder Top Ten Holders |
$1,426.0 |
$1,421.5 |
($4.5) |
|
|
|
|
|
|
Grand Total Foreign Holders U.S. Treasuries |
$7,660.7 |
$7,185.4 |
($475.3) |
|
Intragovernmental Holdings |
$6,271.7 |
$6,885.8 |
$614.1 |
|
Held by Public * |
$22,637.1 |
$24,352.5 |
$1,715.4 |
|
Held By Federal Reserve** |
$5,320.2 |
$5,487.5 |
($167.3) |
Source: www.ticdata.treasury.gov, www.fiscaldata.treasury.gov, www.federalreserve.gov
* Includes those held by foreign holders ** As of January 5, 2022 and January 4, 2023
Since 2020, U.S. treasury debt held by the banks is up $2.5 trillion while commercial loans are up only $342 billion. Most of the gain for commercial loans was seen in the past year. The banks were flush with cash. It has to be placed somewhere. The same thing was going on at insurance companies. And others with lots of cash had to place those funds somewhere safe.
U.S. Commercial Bank Assets 2007–2022
($billions)
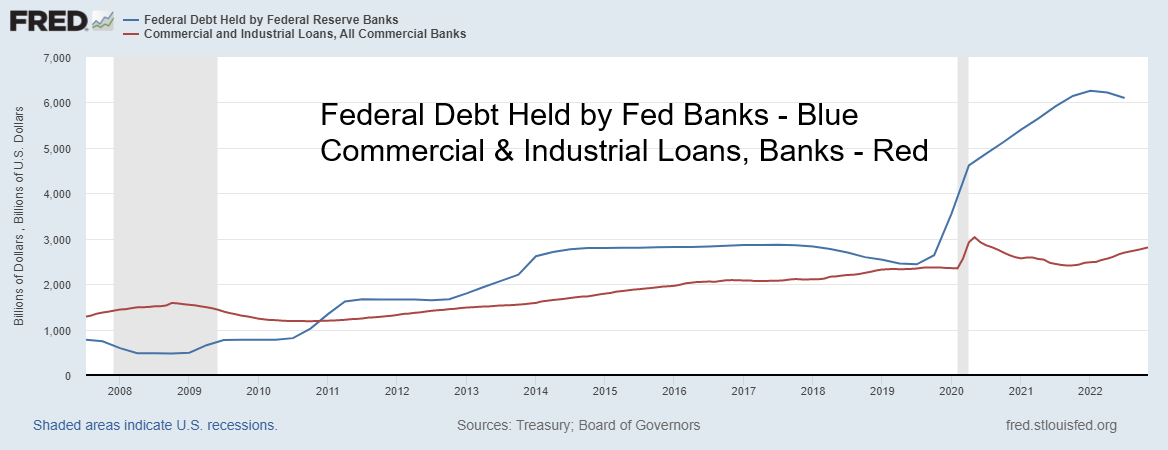
Source: www.stlouisfed.org
The December inflation numbers came in as widely expected, up 6.5% year-over-year (y-o-y). Month-over-month (m-o-m) inflation was actually down 0.1%. But core inflation m-o-m was up 0.3% and y-o-y up 5.7% as expected. Markets generally acted positively. But average hourly wages continue to lag up only 4.6% y-o-y. Wage growth overall is up 6.17% y-o-y to November 2022. The moderating hourly wage growth is a reason why some believe the Fed will begin to lessen interest rate hikes. The expectation remains that the Fed will hike another 50 bp at its January 31–February 1 meeting. But some are now expecting only a 25 bp hike. The goal, as hinted by the Fed, is to get to 5.5% from the current 4.5%. That implies to us at least 50 bp at the January 31–February 1 meeting and another 50 bp at the March 21–22 meeting.
We note, once again, as below, our chart of the U.S. Consumer Price Index (CPI), effective Fed Funds rate, and the U.S. 10-year treasury note yield from 1970 onwards. Inflation initially moderated from a peak in 1974 at 12.1% to a low in 1975 at 5.1%. But then inflation soared once again, not peaking until 1980 at 14.6%. It took hiking interest rates under Fed Chair Paul Volcker above the rate of inflation to finally bring inflation down. It also sparked the steepest recession since the Great Depression. Is this drop in the CPI merely the first wave down, to be followed another burst of inflation later on? We can’t forecast that now, but it is definitely something to be aware of. Inflation may not be one and done. It could be an ongoing problem the remainder of the decade. Stagflation!
CPI, Fed Funds, 10-Year Note Yields – 1970–2022
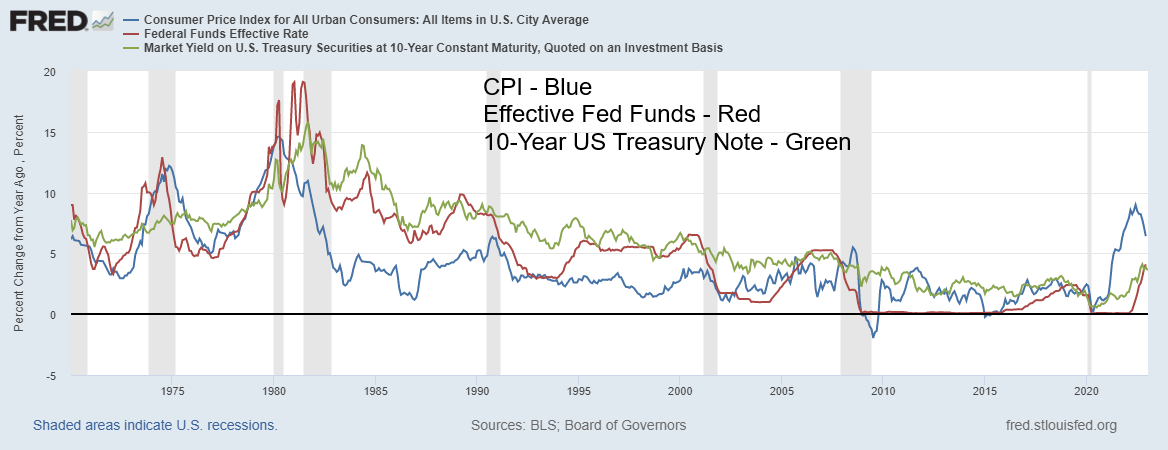
Source: www.stlouisfed.org
If the U.S. inflation rate is beginning to abate, the EU inflation rate is just now appearing to turn the corner. The EU rate of inflation is at 11.1% with the recent peak at 11.5%. Yet the ECB lags far behind the Fed in hiking rates. The current ECB rate is only 2.5%.
U.S. Inflation Rate vs. EU Inflation Rate 2012–2022
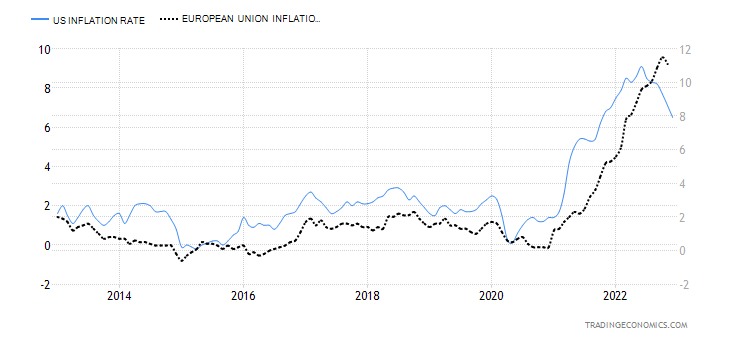
Source: www.tradingeconomics.com, www.bls.gov, www.ec.europa.eu
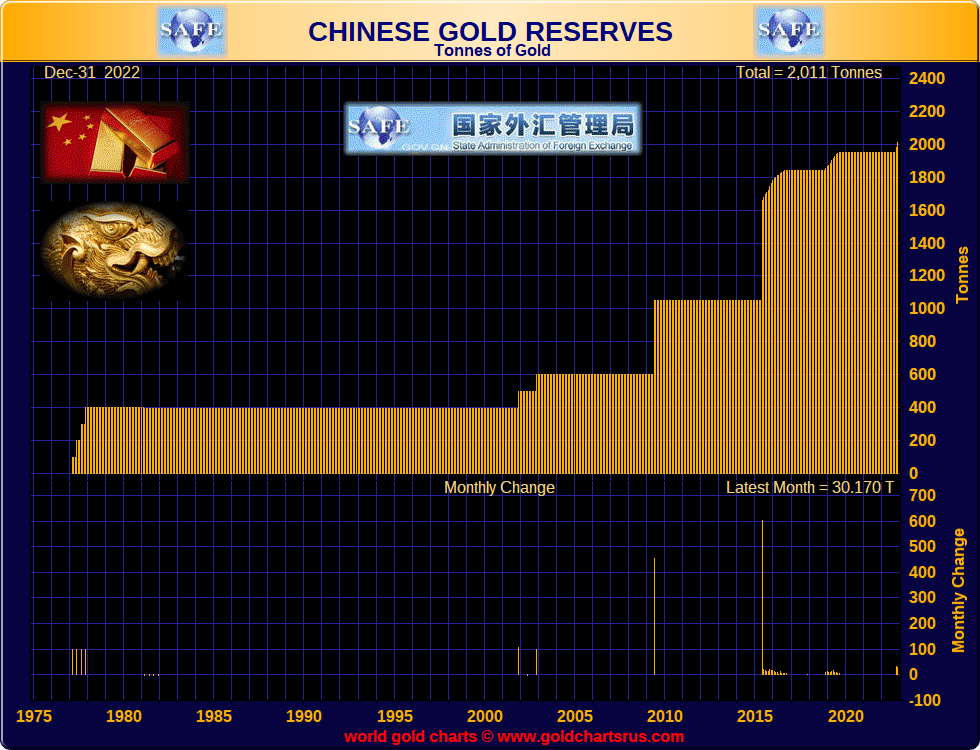
If China is selling off U.S. treasuries, then what is going up? Well, China’s gold reserves. China announced purchases for the first time in months in November and December when they said they added 32 metric tonnes in November and another 30 metric tonnes in December. It brings China’s official holdings to 2,010 metric tonnes. Many suspect it’s actually higher. China holds the highest central bank reserves in the world at $3.1 trillion. Japan is number 2 at $1.2 trillion. However, China’s official gold holdings rank them at only number 7, behind the U.S., Germany, the IMF, Italy, France, and Russia. Both Russia and China have added significantly to their gold reserves over the past decade as both look to shore up the value of the ruble and the yuan.
Central banks added gold at a record pace in 2022. China wasn’t even the largest purchaser. That belongs to Turkey who, to date, purchased some 122.8 metric tonnes in 2022. Behind Turkey was Tunisia at 104.2 metric tonnes and third was Egypt at 44.6 metric tonnes (source: World Gold Council www.gold.org). China, with its recent purchase in December of 30 metric tonnes, actually purchased 62 metric tonnes in 2022. However, that is not yet reflected in the numbers we pulled off the World Gold Council as their numbers only go to November 2022.
But if China and Russia have been shoring up their currencies and reserves by buying gold, the U.S. has different problems. Not only does the U.S. have the highest national debt in the world at $31.5 trillion, but the U.S. total debt is also the highest in the world, currently at $93.7 trillion. Global debt is estimated at over $305 trillion plus an additional $80 trillion of debt in the global shadow banking system, according to the Bank for International Settlements (BIS). The U.S. holds over 30% of the global debt or with the shadow banking system roughly 25%. The shadow banking system is made up of corporations, large financial institutions, and central banks. Most of the debt is related to foreign exchange swaps. To put the $80 trillion in perspective, global GDP is estimated at only $104 trillion.
With projections coming in that global growth is expected to fall to 1.7% in 2023 (World Bank – www.worldbank.org), the wide expectation is that the world will fall into a recession in 2023. What this means is that the U.S. budget deficits, already an astronomical $1.5 trillion (which has been coming down, thanks to growth), could begin to rise again. Add in the growing U.S. trade deficit and the U.S.’s twin deficits could top $3 trillion or over 10% of GDP.
Funding these twin deficits will help maintain upward pressure on U.S. interest rates. This also negatively impacts the U.S. dollar, which should, in turn, help gold prices. While the U.S. dollar still appears as overvalued, it’s all relative if other currencies, particularly the euro, continue to have their own problems and falter. Energy prices, while they may have softened, could start to rise again as there remain global supply problems, China could be opening again, helping push up prices, and the world remains on tenterhooks with tensions continuing between Ukraine/Russia and between the U.S. and Iran. If something happened on the latter front, this would involve the Straits of Hormuz, where over between 20% to 30% of the world’s oil supply goes through, and could spark a significant rise in oil prices.
The U.S. could be faced with an even bigger crisis: the debt ceiling. Janet Yellen, the Secretary of the Treasury, surprised the markets on Friday, January 13 when she sounded the warning that the U.S. could hit its debt ceiling by January 19, forcing the Treasury to start extraordinary cash management measures that could stave off default until at least June. While we were aware of this budding crisis, the thought for many was it wouldn’t become a major concern until the fall. A potential battle with the Republican-controlled Congress could unfold as they demand cuts and other things in order to raise the debt ceiling. Recall that the last significant time the Republicans held congress, which was during the Obama administration, they pushed the U.S. to the brink of default over the debt ceiling. The conflict was resolved, but it prompted a downgrade of the U.S.’s AAA credit rating as it fell to AA+. It also forced cuts in domestic and military spending.
Markets held together during the stand-off and gold soared, but when the crisis ended gold faced a sharp sell-off as did the markets, although that could be attributed as much at the time to the EU/Greek debt crisis. A nasty fight over the debt ceiling is in no one’s interest. The Democrat White House administration has said the debt ceiling is non-negotiable. It has to be raised to prevent a default or government shutdown. The ceiling, currently at $31.4 trillion, is on the verge of being surpassed as noted U.S. Federal debt has now reached $31.5 trillion. A prolonged debt ceiling crisis could see government offices shut down and, in a worst-case scenario, the U.S. technically default on its debt if they failed to make interest payments. Republicans have said they would allow payments to continue for Social Security, Medicare, veterans, interest on the debt, and the military. But that doesn’t address what happens to the rest of government, nor would they be able to issue new bonds to finance government operations.
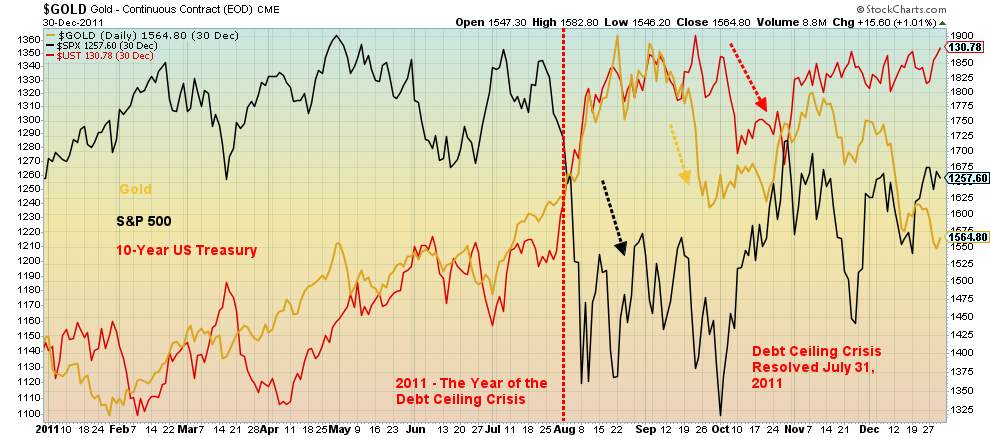
Source: www.stockcharts.com
With the stock market continuing to rally, the January barometer could be delivering a note that we are going to have a good year. Of course, we are only half-way through the month and things could change. And there have been errors in the past. As we have noted, of 12 major errors since 1950, eight of them occurred after 2000. That 83.3% accuracy ratio since 1950 collapses to only 60% after 2000. 2023 is still expected to be a challenging year and the risks are rising, not abating.
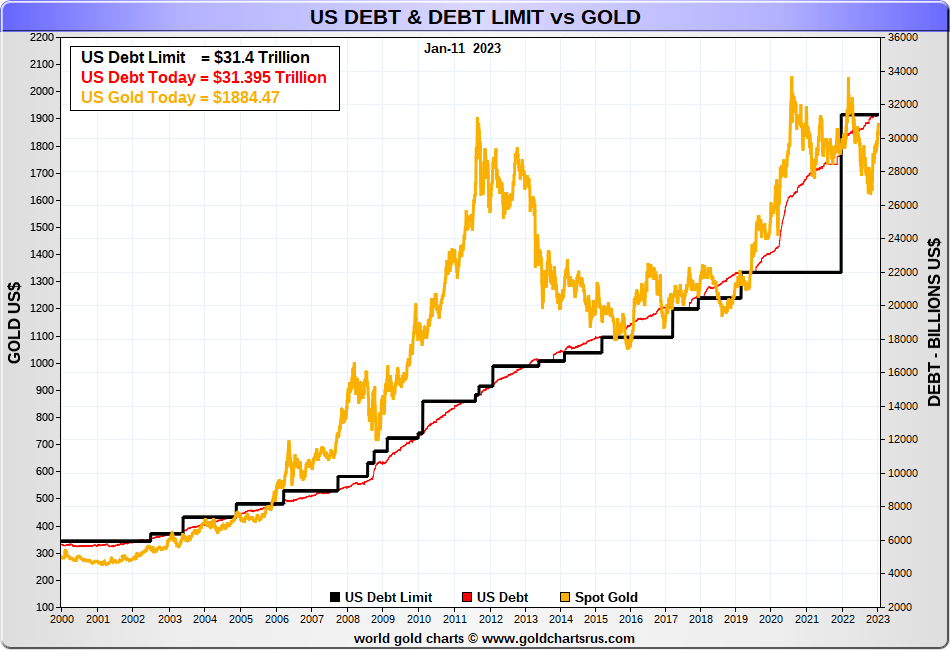
We show two more charts below. One is the rise in China’s gold reserves and the second chart shows the rise in U.S. debt, along with the debt ceiling and the rise in the price of gold against the backdrop of rising U.S. debt. The correlation between U.S. debt and gold and the debt ceiling appears to be strong and that should bode well for gold prices in 2023. The chart shows that, as the debt and the debt ceiling rise, gold rises as well. It appears wise to hold a bit of gold going forward.
China’s Gold Reserves
Source: www.goldchartsrus.com
Source: www.goldchartsrus.com
Chart of the Week
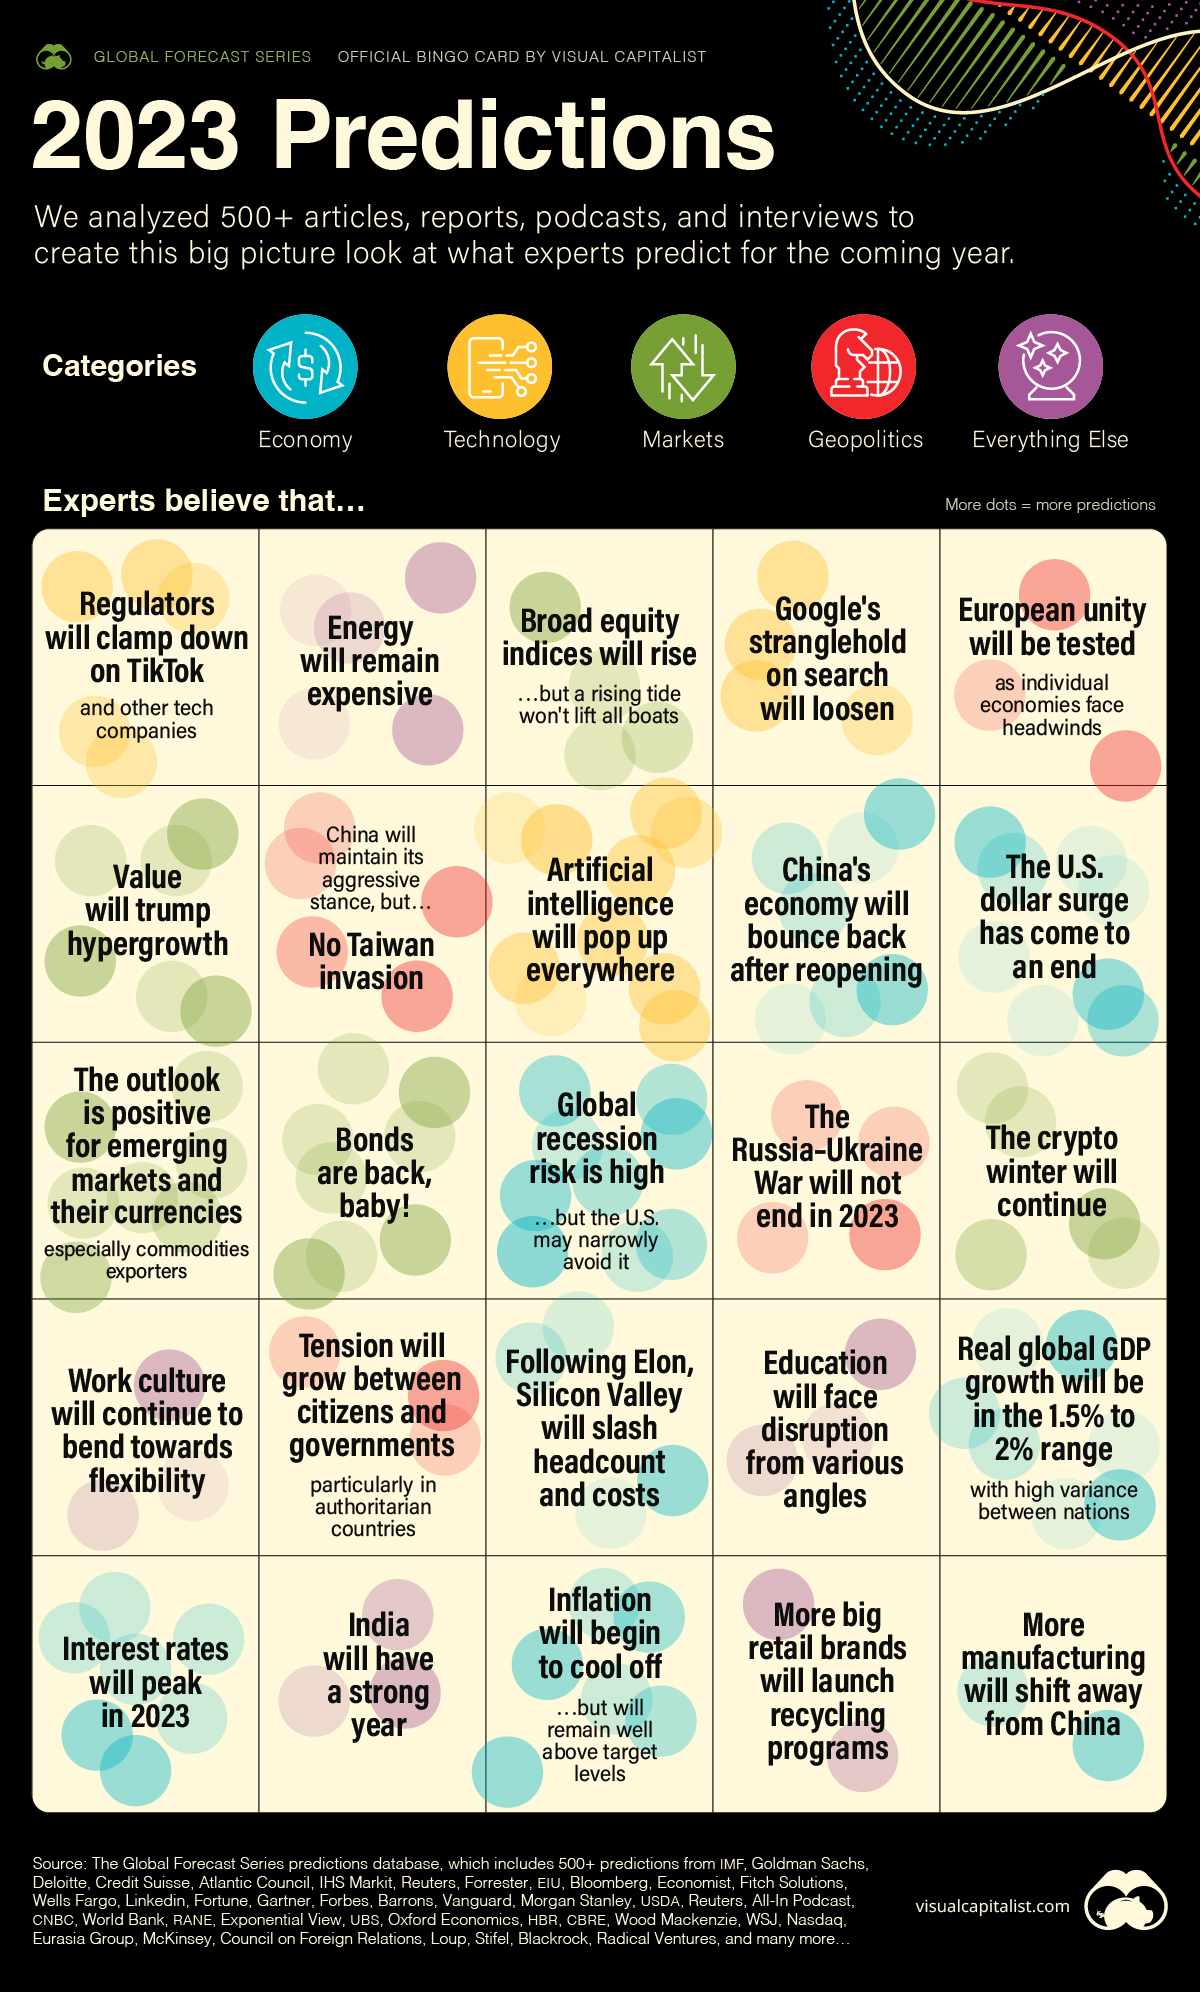
Source: www.visualcapitalist.com
We found the above chart from Visual Capitalist (www.visualcapitalist.com) quite interesting. Visual Capitalist is an online publishing company that focuses on numerous topics, including markets, technology, energy, healthcare, maps, green energy, money, and more. Their charts are, well, very visual and bold. It’s a fascinating website and, along with Statista (www.statista.com), provides a lot of fascinating information.
We liked the above chart as Visual Capitalist created a consensus chart on where experts see things going in 2023. That is, of course, assuming that the experts are right. Experts can hype forecasts just as easily as those pumping the latest crypto craze. Not that anyone is doing well in crypto these days, despite the recent bounce-back.
Key elements above seem to pinpoint inflation as a continuing bugaboo, but that it should ease as the year progresses. However, few, if any, are expecting the inflation rate to fall to 2%, the Fed’s target. Global GDP should also falter. We noted that the World Bank sees global GDP falling to 1.7% in 2023, down from their original forecast of 3%. A recession, especially in the developed world, seems to be a foregone conclusion. Certainly, for the EU, yes, but many also believe the U.S. can avoid a recession. However, it will slow down. GDP just won’t go negative for any extended period. The upset for that? If a black swan event hits. They are optimistic on China bouncing back and that is positive for energy. Energy was a big winner the past couple of years, but can it continue that winning streak? Although no joy is coming at the pump as gas prices will remain elevated.
The experts seem to be cautiously optimistic about stock markets in 2023. As we noted, the January barometer is, so far, pointing to a good year. But that can change—quickly. The bond market should do well. If we don’t see any new highs in yields, we could stay around the current levels. That makes holding bonds more attractive. Tech companies could continue to struggle and lay off people.
They note the risk of AI taking away jobs. This is something we have noted as well. Strangely, the chart is silent on gold and climate change. But it does believe that the U.S. dollar will continue to wane and that is positive for gold. Given the current devastation going on in California and a world continuing to rapidly heat up with increasingly killer storms, floods, droughts, and more, it seems odd that none of the boxes above address what is the elephant in the room – climate change. The costs to deal with climate change and the disasters will continue to rise, as well as the refugees fleeing climatic disaster zones. As to war, well, no one seems to be in a hurry to negotiate over the Russian/Ukraine war. The Western countries continue to send billions in arms to Ukraine. Who’s paying?
Irrespective of this, it is an interesting chart, even if it does lack the more dire predictions of someone like Nouriel Roubini.
Before we leave, we received another chart from Visual Capitalist on Friday January 13, which we posted below. It seems to take what was on the above chart and summarize it all in a different way, ranking the risks. Another handy chart that outlines the risks we face going forward.
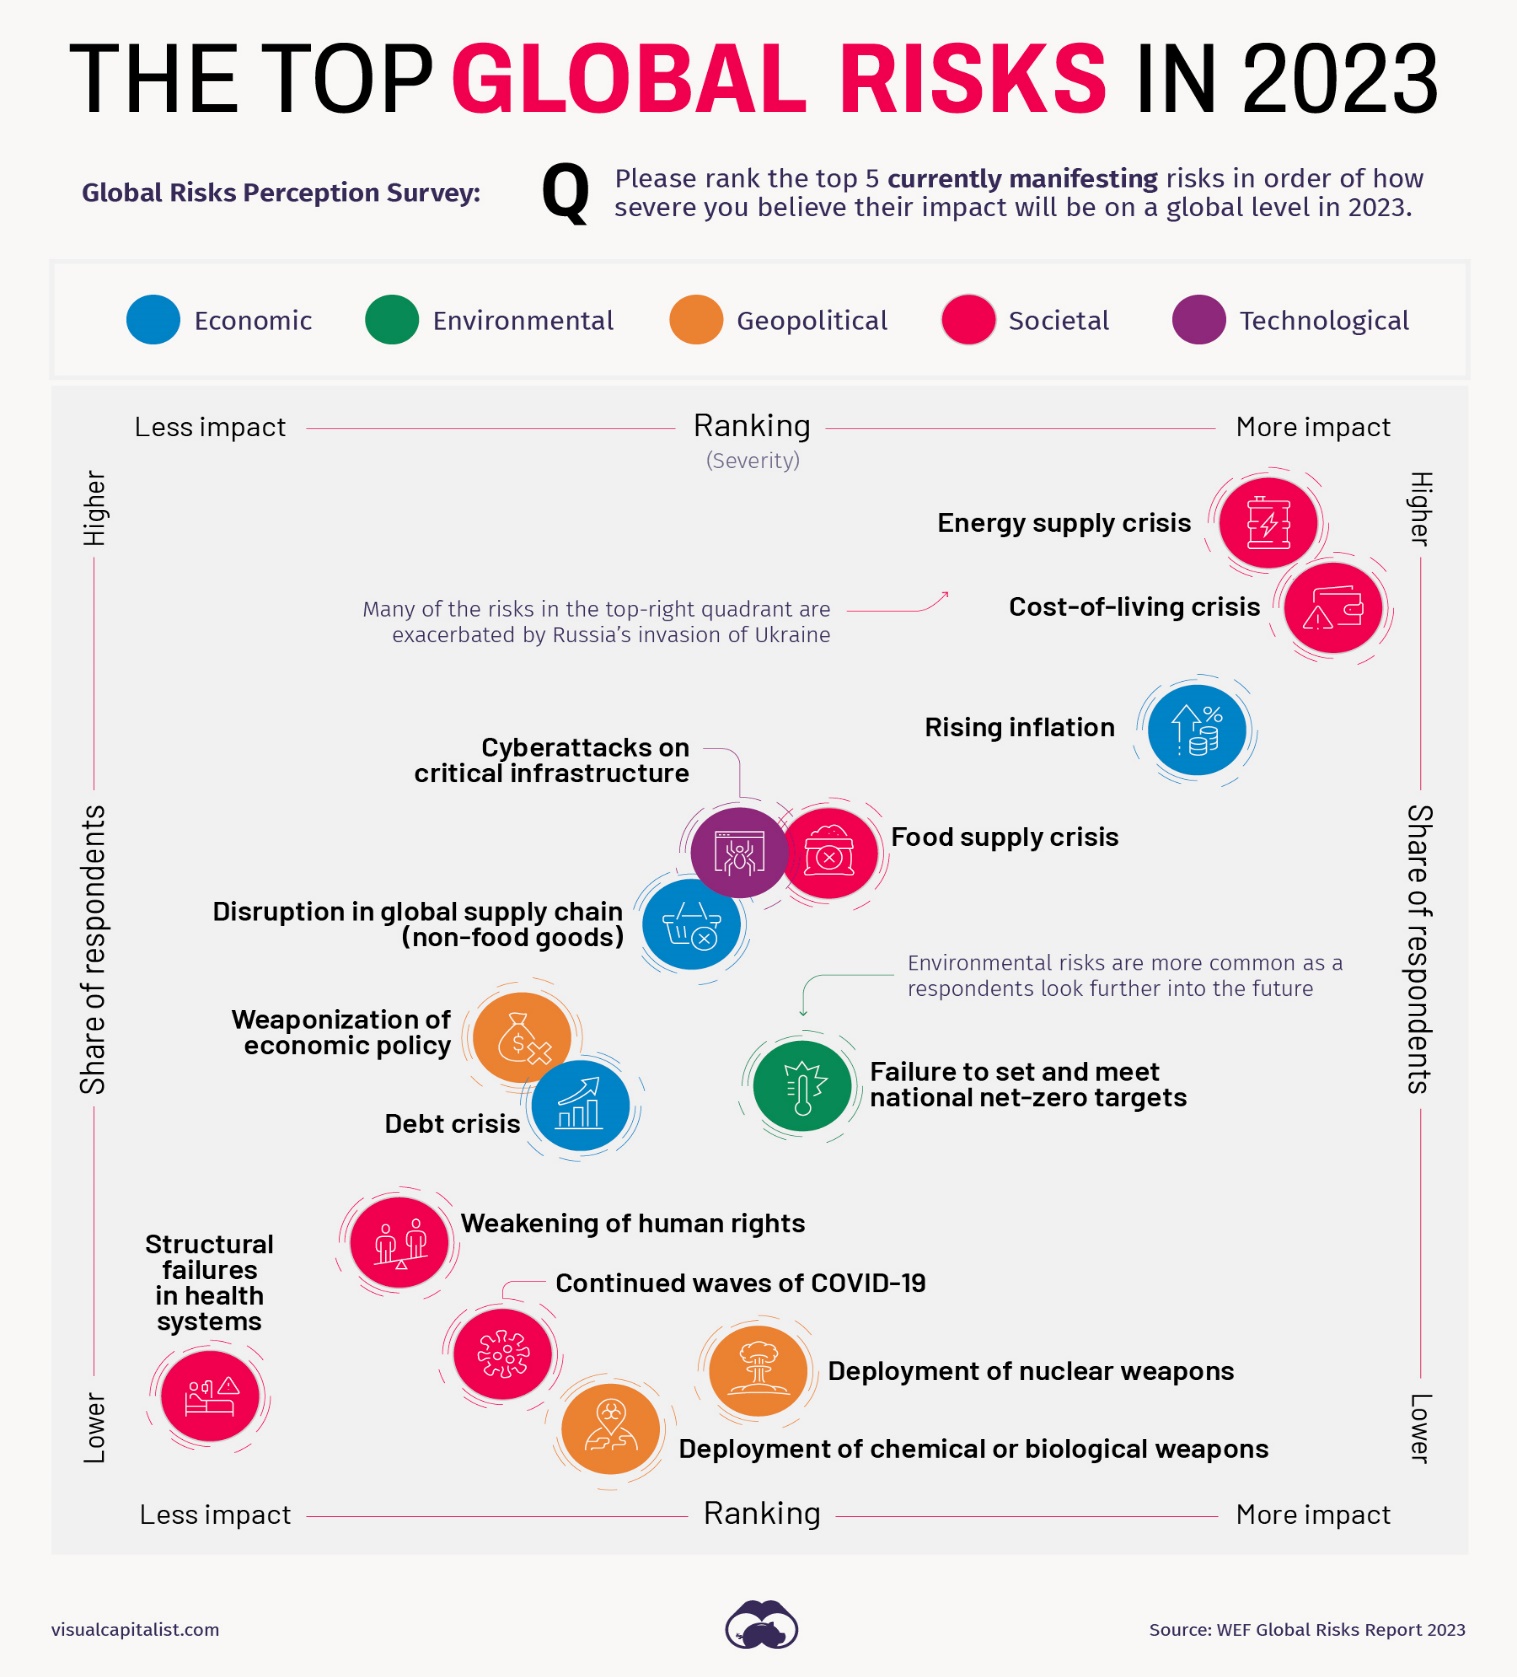
Source: www.visualcapitalist.com
Markets & Trends
|
|
|
|
% Gains (Losses) Trends
|
|
||||
|
|
Close Dec 31/22 |
Close Jan 13/23 |
Week |
YTD |
Daily (Short Term) |
Weekly (Intermediate) |
Monthly (Long Term) |
|
|
Stock Market Indices |
|
|
|
|
|
|
|
|
|
`S&P 500 |
3,839.50 |
3,999.09 |
2.7% |
4.2% |
up |
neutral |
neutral |
|
|
Dow Jones Industrials |
33,147.25 |
34,302.61 |
2.0% |
3.5% |
up |
up |
up |
|
|
Dow Jones Transport |
13,391.91 |
14,364.39 |
3.5% |
7.3% |
up |
up (weak) |
up (weak) |
|
|
NASDAQ |
10,466.48 |
11,079.16 |
4.8% |
5.9% |
up (weak) |
down |
down (weak) |
|
|
S&P/TSX Composite |
19,384.92 |
20,360.10 |
2.8% |
5.0% |
up |
up (weak) |
up (weak) |
|
|
S&P/TSX Venture (CDNX) |
570.27 |
615.11 |
5.7% |
7.9% |
up |
down (weak) |
down |
|
|
S&P 600 (small) |
1,157.53 |
1,238.88 |
4.5% |
7.0% |
up |
up |
up (weak) |
|
|
MSCI World Index |
1,977.74 |
2,084.20 |
5.1% |
5.4% |
up |
up |
neutral |
|
|
Bitcoin |
16,535.23 |
16,797.12 |
1.6% |
1.6% |
neutral |
down |
down (weak) |
|
|
|
|
|
|
|
|
|
|
|
|
Gold Mining Stock Indices |
|
|
|
|
|
|
|
|
|
Gold Bugs Index (HUI) |
229.75 |
260.30 |
3.4% |
13.3% |
up |
up |
neutral |
|
|
TSX Gold Index (TGD) |
277.68 |
310.94 |
3.1% |
12.0% |
up |
up |
neutral |
|
|
|
|
|
|
|
|
|
|
|
|
% |
|
|
|
|
|
|
|
|
|
U.S. 10-Year Treasury Bond yield |
3.88% |
3.51% |
(1.7)% |
(9.5)% |
|
|
|
|
|
Cdn. 10-Year Bond CGB yield |
3.29% |
2.90% |
(6.5)% |
(11.9)% |
|
|
|
|
|
Recession Watch Spreads |
|
|
|
|
|
|
|
|
|
U.S. 2-year 10-year Treasury spread |
(0.55)% |
(0.72)% |
(4.4)% |
(30.9)% |
|
|
|
|
|
Cdn 2-year 10-year CGB spread |
(0.76)% |
(0.78)% |
11.4% |
2.6% |
|
|
|
|
|
|
|
|
) |
|
|
|
|
|
|
Currencies |
|
|
|
|
|
|
|
|
|
US$ Index |
103.27 |
103.65 |
0.4% |
0.4% |
down |
down (weak) |
up |
|
|
Canadian $ |
73.92 |
74.72 |
0.3% |
1.1% |
up |
down (weak) |
down |
|
|
Euro |
107.04 |
108.34 |
1.8% |
1.2% |
up |
up |
down |
|
|
Swiss Franc |
108.15 |
107.99 |
0.2% |
(0.2)% |
up |
up |
neutral |
|
|
British Pound |
120.96 |
122.34 |
1.2% |
1.2% |
up |
up (weak) |
down |
|
|
Japanese Yen |
76.27 |
78.19 |
3.3% |
2.5% |
up |
up |
down |
|
|
|
|
|
|
|
|
|
|
|
|
|
|
|
|
|
|
|
|
|
|
Precious Metals |
|
|
|
|
|
|
|
|
|
Gold |
1,826.20 |
1,921.70 |
2.8% |
5.2% |
up |
up |
up |
|
|
Silver |
24.04 |
24.37 |
1.6% |
1.4% |
up |
up |
up (weak) |
|
|
Platinum |
1,082.90 |
1,072.50 |
(2.9)% |
(1.0)% |
up |
up |
up |
|
|
|
|
|
|
|
|
|
|
|
|
Base Metals |
|
|
|
|
|
|
|
|
|
Palladium |
1,798.00 |
1,787.30 |
(1.1)% |
(0.6)% |
down |
down |
down |
|
|
Copper |
3.81 |
4.22 |
7.8% |
10.7% |
up |
up |
up (weak) |
|
|
|
|
|
|
|
|
|
|
|
|
Energy |
|
|
|
|
|
|
|
|
|
WTI Oil |
80.26 |
79.86 |
8.3% |
(0.5)% |
up |
down |
up (weak) |
|
|
Nat Gas |
4.48 |
3.42 (new lows) |
(7.8)% |
(23.7)% |
down |
down |
neutral |
|
Source: www.stockcharts.com
Note: For an explanation of the trends, see the glossary at the end of this article.
New highs/lows refer to new 52-week highs/lows and, in some cases, all-time highs.
Source: www.stockcharts.com
The January effect: as goes January, so goes the year. At least, that is the theory. We covered that earlier, but what we are seeing so far is the potential for January 2023 to be a solid up month. This past week the S&P 500 gained 2.7%, the Dow Jones Industrials (DJI) was up 2.0%, the Dow Jones Transportations (DJT) gained 3.5%, and the NASDAQ jumped 4.8%. The smaller stocks also gained with the S&P 400 (Mid) up 3.7% and the S&P 600 (Small) gaining 4.5%. The S&P 500 equal weight index was up 2.6%. The joy continued into Canada as the TSX Composite was up 2.8% and the small cap TSX Venture Exchange (CDNX) was up 5.7%.
Over in the EU, the London FTSE was up 1.9%, EuroNext gained 2.5%, the Paris CAC 40 was up 3.9%, and the German DAX was up 4.5%. Plunging natural gas (NG) prices no doubt helped. In Asia, China’s Shanghai Index (SSEC) gained 1.3%, the Tokyo Nikkei Dow (TKN) was up 0.6%, and Hong Kong’s Hang Seng Index (HSI) was up 3.3%. The MSCI World Index gained 5.1%. Joy was returning to global stock markets. An up January will no doubt catch a lot of bears by surprise and short covering could spark even more gains.
Of course, one of the prime reasons for the jump was moderation on the inflation front. That feeds into the market. We are a little uncertain at this time how things will play out with the debt ceiling as the expectation is that, while a deal may eventually be reached, the Republican-led Congress may take things to the brink. Also, there is the developing scandal over unauthorized documents found at President Biden’s place. While the comparison with Trump is not the same, it is still something that could envelope the president and, in a worst-case scenario, lead to impeachment and bring him down.
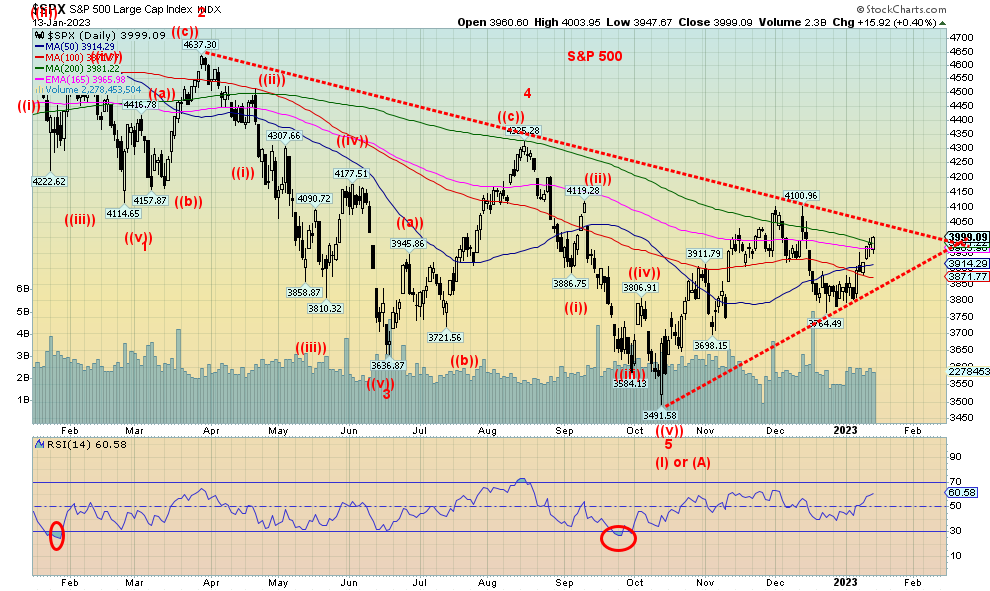
There are some divergences as the price on the S&P 500 is lagging the advance/decline line ratio. The VIX Volatility Indicator is making new lows while the S&P 500 has not yet made new highs. It is possible the indicators are leading the way. The S&P 500 is also approaching that downtrend line from the highs. A firm break over 4,050 could see the S&P 500 put on even more gains. So far, only the DJI has broken above its downtrend line and firmly above its 200-day MA. The 50-day MA is just now crossing over the 100-day MA. More work to do there to bring the 50-day up over the 200-day MA. We could also argue that the S&P 500 is making a head and shoulders bottom. We didn’t label it, but the head is that plunge down to the lows at 3,491 while the left shoulder bottomed in June at 3,637. The right shoulder may be the low here at 3,764. A break over 4,050 could see the S&P 500 in theory rise to near 4,900 for new all-time highs. That would surprise a lot of people. We are hopeful.
Source: www.stockcharts.com
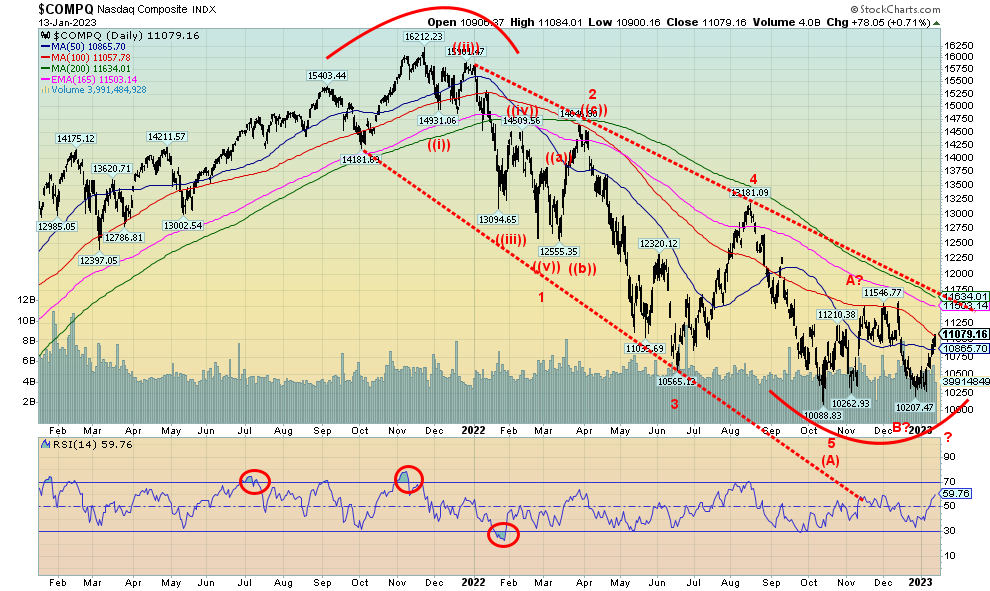
The NASDAQ had a solid week, gaining 4.8%. The NY FANG Index was up 8.6% and many of the FAANG stocks had a solid week. The best was Amazon, up 14.1% and Nvidia gaining 13.7%. Even Tesla rebounded up 8.2%. It is possible that the NASDAQ is forming a potential double bottom with the lows at 10,088 in October and the secondary one at 10,207 in December. The neckline would be up around 11,550 (to be safe) and a breakout could project up to around 13,000. A break above 11,550 would also break that downtrend line from the highs seen at the end of 2021 and early 2022. If we broke back under 10,750, we’d be cautious and under 10,300 we are headed for new lows.
Source: www.stockcharts.com
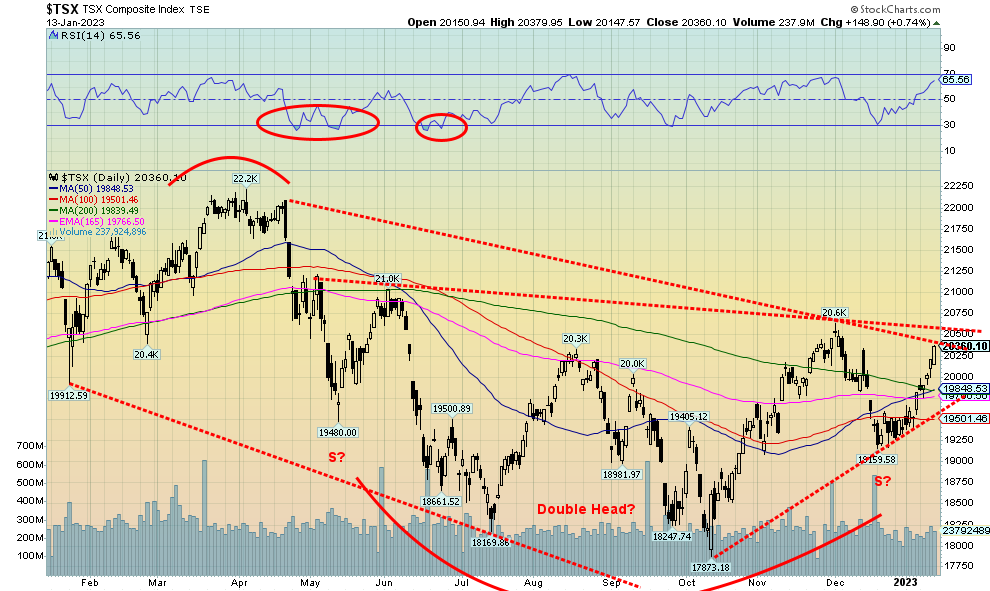
The TSX Composite joined the party this past week, gaining 2.8%. The TSX Venture Exchange (CDNX) finally showed some life and jumped 5.7%. The TSX is now knocking on the door of the downtrend resistance line from the highs last March/April. A firm break above 20,500 could start another up move towards those highs near 22,000. We could argue that the TSX is making a double head and shoulders bottom pattern. The neckline is around that 20,500 level and could project the TSX up to around 23,600. At that level, the TSX would be making new all-time highs. We emphasize that this is possibly a double H&S pattern and targets are potential, not a given. The pattern would be shattered if the TSX were to first break that uptrend line currently near 19,500 and break down under the possible right shoulder near 19,160. The 14 sub-indices all enjoyed an up week as well. Okay, one did not really participate. Consumer Staples (TCS) was basically flat on the week. Income Trusts (TCM) led the way with a gain of 5.3%. Real Estate (TRE) was right behind, up 5.2%. Other strong performances were seen for Metals & Mining (TGM) up 4.4%, Energy (TEN) up 4.2%, and Information Technology (TKK) +4.3%. We like the look of the TSX at this point and a firm break above 20,500 could send us higher still and challenge the 2022 highs.
Source: www.stockcharts.com
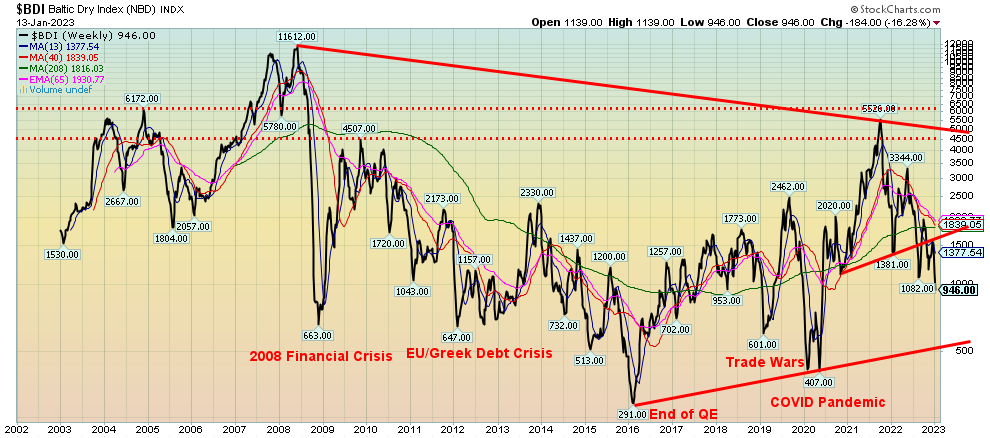
The Baltic Dry Index, a benchmark for the price of moving raw materials by sea, appears to be breaking down. The index has now fallen from a peak of 5,650 in October 2022 to 946 this past week, a decline of 83%. Generally speaking, lows in the BDI index have generally coincided with stock market lows and lows in the economy. This may be another sign of a pending recession. Longer term support appears to be down around 500 and that may be a target.
Source: www.stockcharts.com
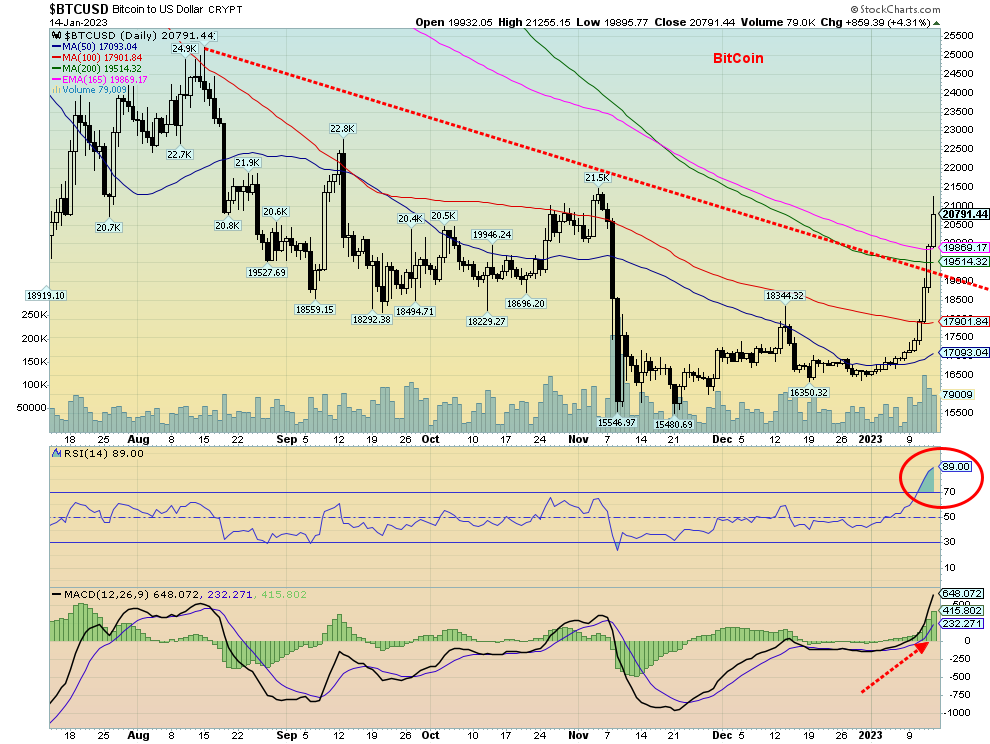
Is Bitcoin embarking on another moonshot to the upside, despite all of the crypto scandals? It certainly appears that way as Bitcoin surged 14.7% this past week to close out around $20,700. We’re sure crypto followers were pleased and relieved, given the sharp drop experienced by Bitcoin and the other cryptos in 2022 when generally they were down 65% to 75%. Some were down 90% or more. However, we are very suspicious of fast rapid moves like we saw this past week, which quickly took Bitcoin to extreme overbought levels. Rapid up moves like this are usually not sustainable. We are also into a resistance zone, but if we could take out $22,000 then a rise to $24,000 is possible. After all the scandals in 2022 in the crypto sphere, this rally is probably welcome and will have many quickly calling for Bitcoin $100,000 once again.
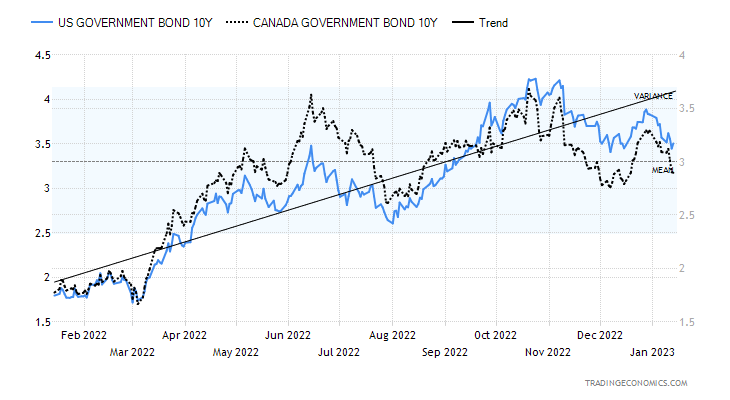
10-year Treasury Bond/Canadian 10-year Government Bond (CGB)
Source: www.tradingeconomics.com, www.home.treasury.gov, www.bankofcanada.ca
Bond yields fell this past week (prices that move inversely to yields rose) as the December CPI came in largely as expected. What it showed was that inflation, while not going away, is potentially moderating. The U.S. 10-year treasury note fell to 3.51% from 3.57%, while in Canada the 10-year Government of Canada bond (CGB) dropped to 2.90% from 3.10%. The recession spreads, however, remained wide with the U.S. 2-year–10-year spread at negative 72 bp, while the Canadian 2-year–10-year spread was at negative 78 bp. All signs continue to point to a recession in 2023. Besides the CPI, there was actually a dearth of numbers this past week. The weekly initial claims came in 205,000 which was below expectations and continued to support a strong jobs market. The Michigan Consumer Sentiment Index strengthened to 64.6%, above the expected 60.5% and December’s 59.7%. If both those numbers had been weaker, no doubt the 10-year would have slipped further. Canada is below support at 3% now while the U.S. needs to break under 3.25% and especially under 3% to suggest lower levels are possible. Overall, we don’t expect the 10-year to moderate too much in 2023 as it should stay elevated as the Fed continues its quest to wrestle inflation to the ground. The Fed is committed to going to at least 5% and even 5.5% for the Fed rate. If the Fed were to hike only 25 bp at the January 31–February 1 meeting, then we’d go with 5%. But if it is a 50 bp hike, then they are most likely going to take it to 5.5%. Many are expecting the Fed to moderate. But the reality is they need to engineer at least a soft landing if they hope to get inflation back to its target zone of around 2%.
Source: www.stockcharts.com
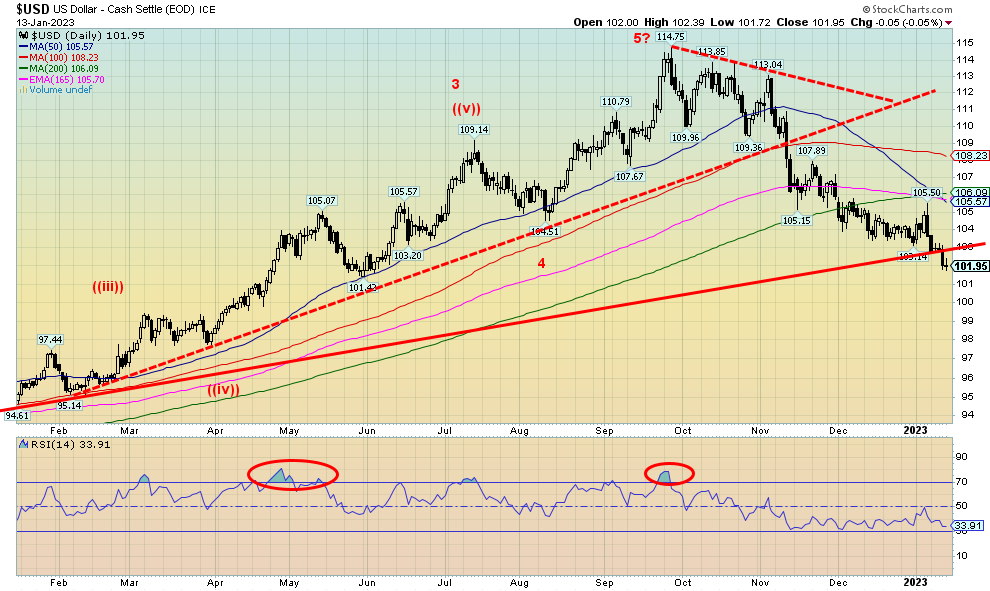
Is the US$ Index finally breaking down? It certainly appears to be that way as the index decisively broke under our major 103 support zone closing the week out at 101.95 down 1.6%. Trends are now turning to the downside. The other major currencies were beneficiaries as the euro rose 1.8%, the Swiss franc gained a small 0.2%, the pound sterling was up about 1.2%, while the Japanese yen soared up 3.3%. The Canadian dollar managed to tack on 0.3%, helped along by rising oil prices. But it is the US$ Index (made up of euro 57.6%, Japanese yen 13.6%, pound sterling 11.9%, Cdn dollar 9.1%, Swedish Krone 4.2%, and Swiss franc 3.6%) breaking down against the major global currencies. No, the index does not contain the Chinese yuan as the yuan, while no longer pegged to the U.S. dollar, is carefully managed by China within a range, although the range is not fully clear. Call it a managed float system. It is possible that the US$ Index should hold the yuan, given its role now in international trade and that the yuan is a part of the IMF’s Special Drawing Rights (SDR) basket. The SDR is made up of the U.S. dollar 43.4%, euro 29.3%, yuan 12.3%, Japanese yen 7.6%, and pound sterling 7.4%. The yuan’s inclusion in the US$ Index would make sense. However, the yuan only represents roughly 3% of global trade vs. 87% for the U.S. dollar. But that could be changing, given China and Saudi Arabia are moving towards trading oil for yuan. That could be the start of a game changer as global U.S. dollar hegemony is challenged. The US$ Index was on the up throughout 2022 as inflation rose in the U.S. and the Fed hiked rates. Global conflicts such as the Russia/Ukraine war helped and COVID-strapped China also contributed as funds flowed out of the EU and Asia into the so-called safe haven of U.S. dollars. But that may now be over as the U.S. goes through a political divide and a looming debt ceiling crisis. Technically, note how we now have the so-called golden cross with the 50-day MA crossing over the 100-day MA, the 165-day EMA,
and now appears to be breaking under the 200-day MA. While we ourselves do not put a lot of credence in the indicator, many do, so it should be noted. We note the same with gold, silver, and the gold stocks. We are approaching oversold levels so a bounce could develop any time. However, 103 may now prove to be resistance. Better resistance is up to 105/106. A falling US$ Index is positive for gold.
Source: www.stockcharts.com
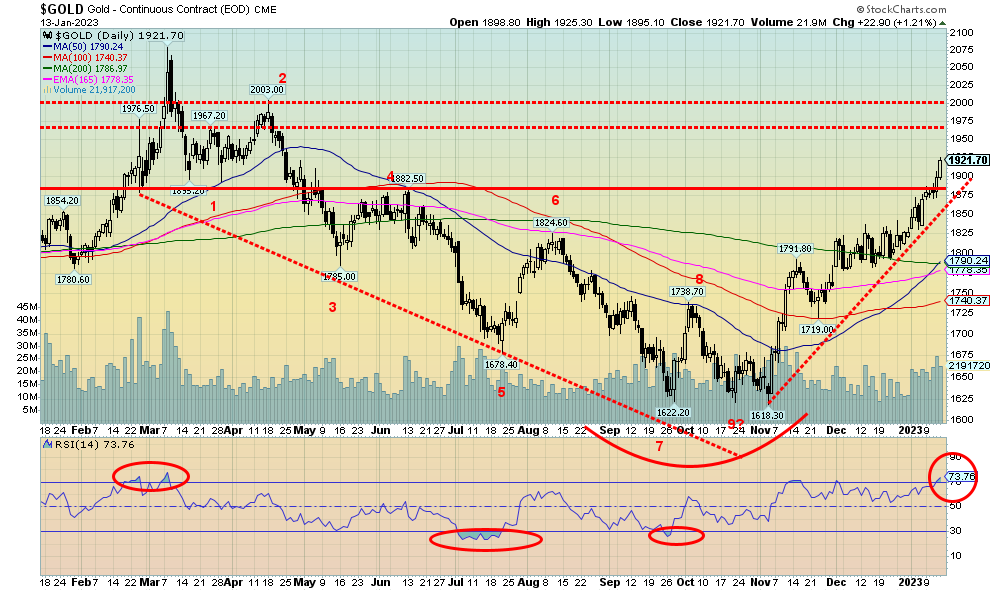
With gold now firmly through our $1,875 resistance and also over $1,900, gold appears to have further room to rise. There are, however, a few creeping negatives to keep in mind. First, on the positive side, moderating inflation was a boost for gold as thoughts turn to the Fed easing on its rate hikes. Second, the U.S. dollar has been coming under increasing pressure as other countries hike their interest rates, lowering the differentials with the U.S. This is along with the ongoing attacks on the U.S. dollar as the Saudis and the Chinese appear to be agreeing that they could pay for oil in yuan. Is the petroyuan replacing the petrodollar? China also continues to bolster its gold reserves to back the yuan, even as it also sells off U.S. treasuries, as we noted in our main essay. Selling U.S. treasuries could result in the proceeds being converted to yuan to purchase gold. The potential for a U.S. debt ceiling crisis could also be a positive catalyst for gold. As well, a potential documents scandal could engulf the Biden presidency as the hyper-partisan Republican congress goes after the president, not only for the documents found at his home, but also in looking to treat Biden’s document scandal the same as Trump’s document scandal—even though the two are not related and the circumstances are quite different.
Some concerns are that the Relative Strength Index (RSI) indicator is now over 70, in overbought territory. However, overbought conditions can remain in place for weeks in a strong bull market. Gold is up 18.7% since that low in early November. However, gold remains about 9% under the March 2022 highs. The second negative is that the Daily Sentiment Indicator (DSI) is at 90, a level associated with tops in the past. Again, these overbought signs can remain for some time if the market is truly strong. And, as we have pointed out, silver is not confirming gold’s up move as, while gold has made new highs for the up move, silver has not. The two need to confirm each other.
We remain optimistic that gold is poised to move higher as a weakening U.S. dollar and the potential for chaos over the debt ceiling is real. Gold’s next strong band of resistance is roughly $1,950/$1,970, but once through that level we should rise to $2,000. A break back under $1,860 now would be a negative sign. Under $1,800 the rally is most likely over.
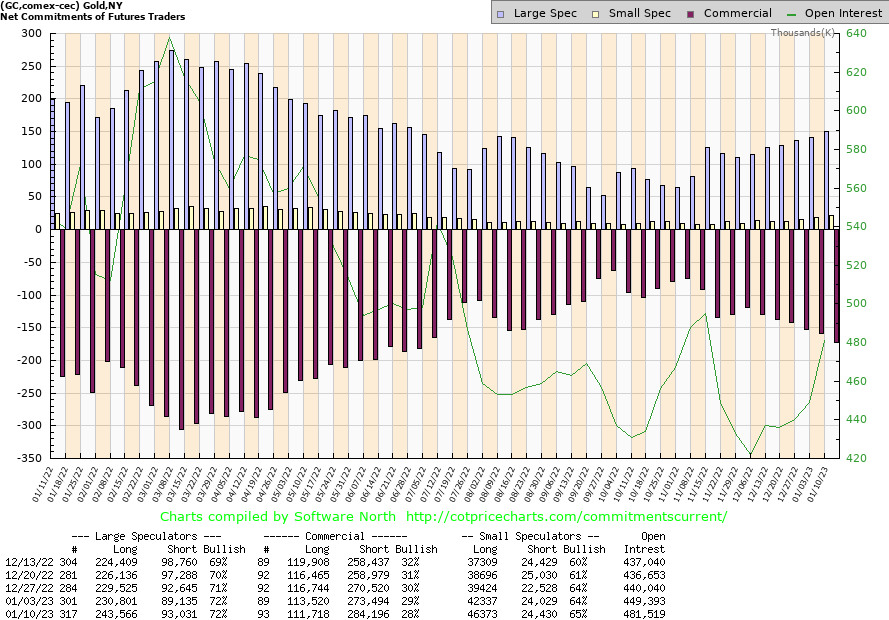
Source: www.cotpricecharts.com
The gold commercial COT (bullion companies and banks) slipped to 28% this past week from 29%. This continues the recent deterioration in the commercial COT as gold prices move higher. Long open interest fell
about 2,000 contracts while short open interest rose about 11,000 contracts. The large speculators COT (hedge funds, managed futures etc.) was steady at 72%. They did add roughly 13,000 longs but they also added roughly 4,000 shorts. Overall, open interest jumped about 32,000 contracts. That’s positive given gold’s rise in price this past week. Open interest was confirming the rise in price. The commercial COT is sliding, but it is not yet at levels that raise concerns that we could be topping. So, this decline is not all that surprising. However, if it falls further into the 20%s, that concern will rise accordingly.
Source: www.stockcharts.com
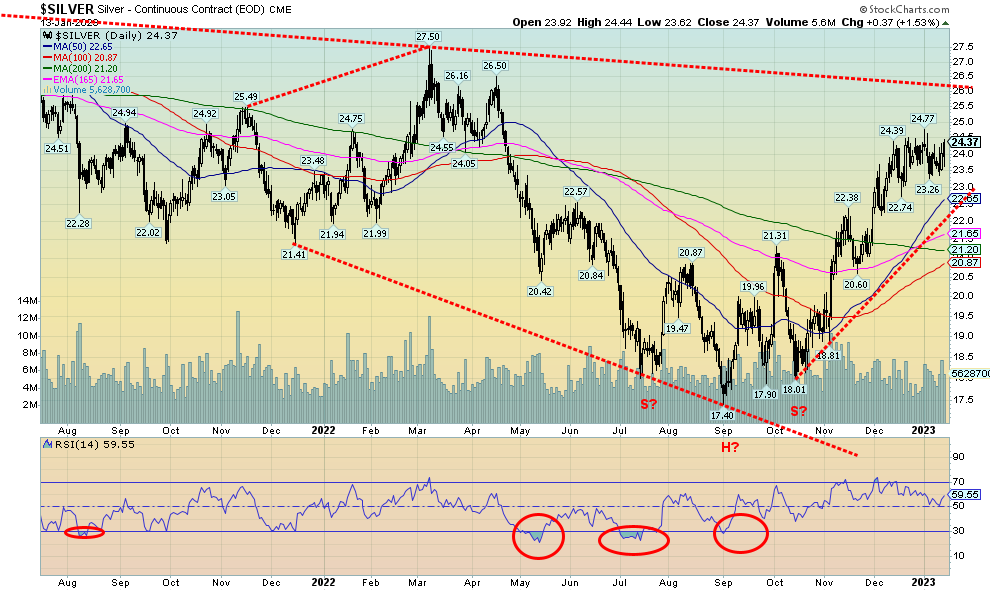
Silver prices gained 1.6% this past week, but that was actually a disappointment for two reasons. One, gold out-performed silver, gaining 2.8%. Second, silver has once again failed to make new highs for the up move, even as gold and the gold stocks did make new highs. This is non-confirmation that needs to be resolved if we are to move higher in price. Otherwise, it could be a signal that the market could fail. Silver is usually a leader in both up and down markets—meaning, the preference is that silver leads the market. Silver’s MACD indicator is currently on a sell signal that had crossed to the downside back on December 20. The recent high was at $24.77 and it is essential we take that out to confirm gold’s up move. On the moving averages, the 50-day MA has crossed over all the MAs’ 100-day, 200-day and 165-day EMA. That’s a positive. While bullish sentiment towards gold is high, silver’s bullish sentiment is not as yet too high. Silver has, potentially, room to move higher. If we can make new highs above $24.77, then we could set our sights on the trend line near $26. To the downside, a break under $23 with no new highs would be negative and suggest a decline is underway. Major support wouldn’t come in until near $21. That possible head and shoulders bottom pattern does project up to around $25.25. We remain short of that level. The RSI is not yet overbought, suggesting there is room to move higher. But our real concern is the ongoing failure for silver to make new highs. Until we do, we would continue to exercise some caution in the precious metals.
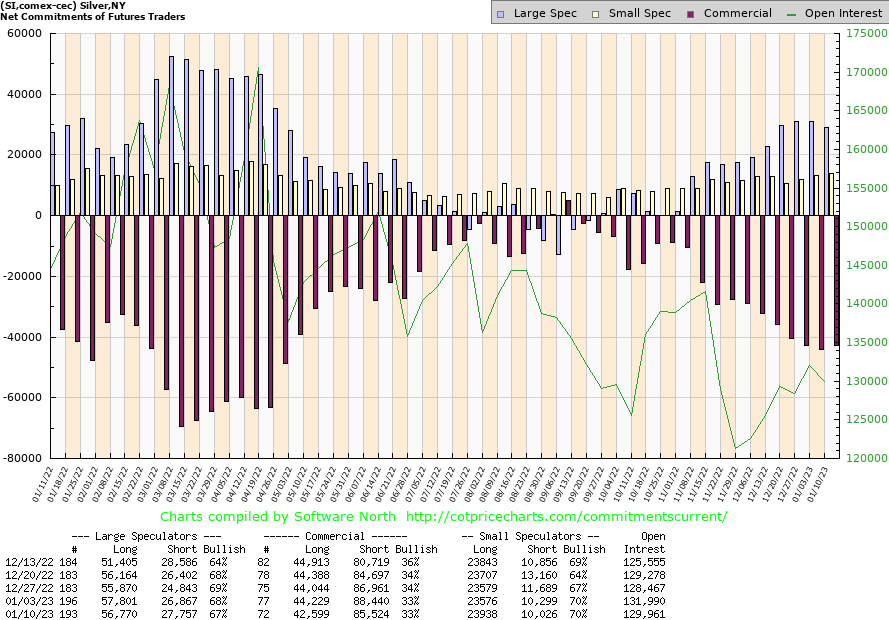
Source: www.cotpricecharts.com
The silver commercial COT was unchanged this past week at 33%. Long open interest fell about 2,000 contracts, but short open interest also fell down about 3,000 contracts. The large speculators COT slipped a bit as well to 67% from 68%. Overall open interest fell about 2,000 contracts on an up week. That to us shows some weakness in the market.
Source: www.stockcharts.com
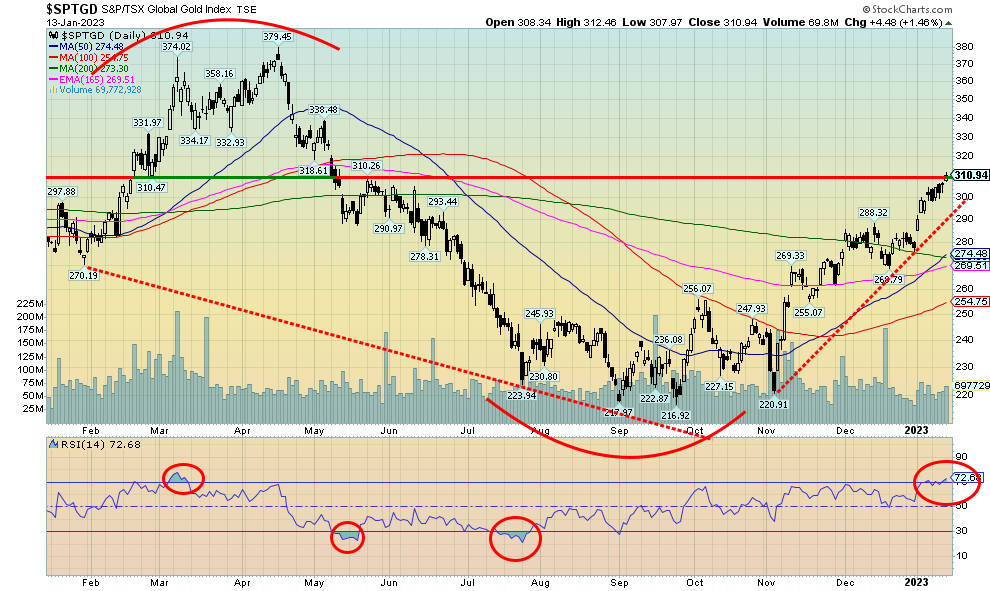
Gold stocks added to their gains of the previous week, although this past week’s gains weren’t as impressive. Still, the Gold Bugs Index (HUI) rose 3.4% and the TSX Gold Index (TGD) was up 3.1%. The Gold Miners Bullish Percent Index (BPGDM) is only at 55, well below previous top levels of 83 and 100. That suggests to us that we have room to move higher. Short term, there could be a pullback as the RSI indicator is currently just under 73. Although in a bull market the RSI indicator can remain overbought for some time. The recent rise for the TGD has been rapid; however, we have seen this before and while reaching a state of overbought is not unusual it doesn’t necessarily mean we are topping. We are, however, at resistance near 310 so a pullback this coming week would be healthy and work off some of the overbought conditions. Since the November low, the TGD has gained almost 41%. However, to maintain perspective we remain down over 18% from the March 2022 high. To reach those levels again we’d have to gain an additional 22%. Support for the TGD can be seen down to around 290, and then again down to 275. Note the 50-day MA is giving off what is called golden-cross buy signals as it crosses the 100-day MA and 165-day EMA, and is now on the cusp of crossing the 200-day MA. That would be a positive development and suggest further gains.
Source: www.stockcharts.com
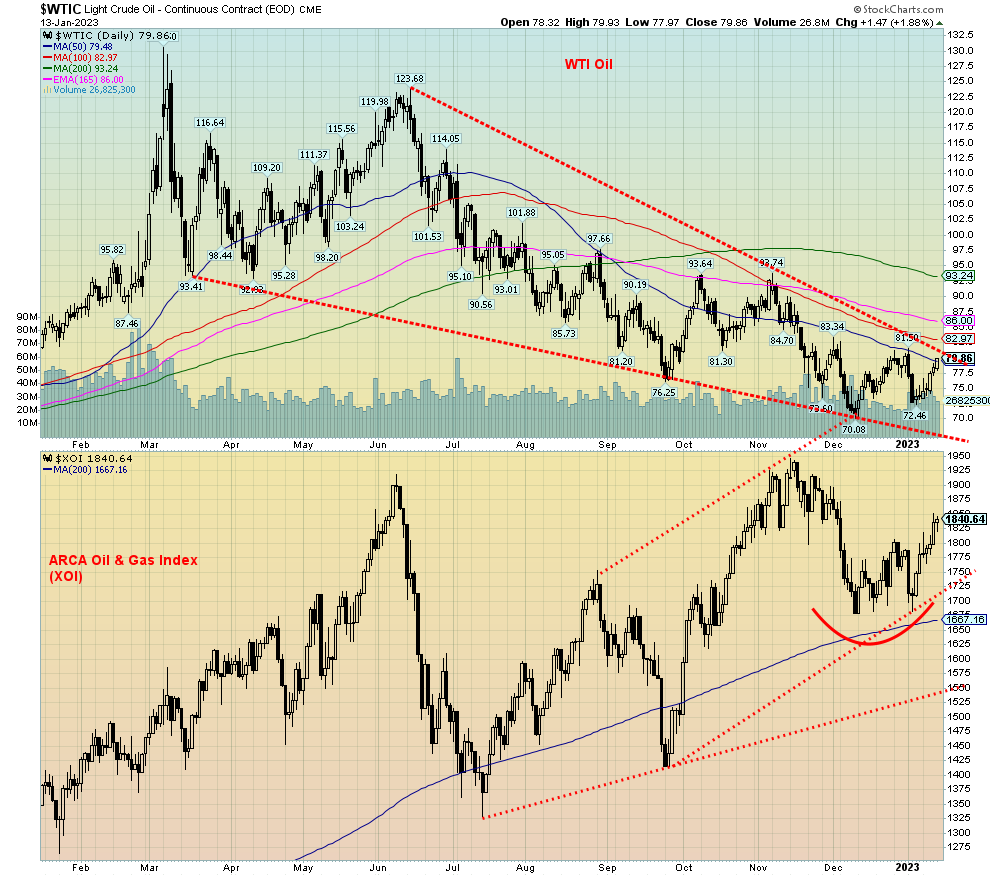
Oil prices rose this past week after inflation data showed some moderation and came in largely as expected. China’s opening up also helped, although the Chinese situation may remain in flux until we see for sure whether they really are opening up as they move away from their zero-COVID policy. As a result, that should keep the market in check until it seems to be fully sorted out. WTI oil rose roughly $6 on the week or 8.3%. Brent oil also jumped 8.3%. But natural gas (NG) prices fell again as LNG imports poured into the EU offsetting the negative impact of the loss of Russian NG. NG was down 7.8% on the week to fresh 52-week lows and NG at the Dutch hub also fell down 6.8%. Prices are largely back at where they were in February 2022 when Russia first invaded Ukraine. The energy stocks did well with the ARCA Oil & Gas Index (XOI) up 3.4% and the TSX Energy Index (TEN) up 4.2%.
WTI oil continues to form what appears to us as a descending wedge triangle. A descending wedge triangle is bullish once the pattern breaks to the upside. Right now, the break out comes in just over $81.50. In theory, it could portend a move back towards the high of 2022 near $130. Further resistance can be seen up to around $94, but above $95 oil prices could embark on a sharp move to the upside.
Catalysts to achieve those levels could be a wrong turn in the war in Ukraine or the outbreak of hostilities in the Persian Gulf. Hostilities could break out between any or all of the U.S./Israel/Saudi Arabia/Gulf States with Iran. The Straits of Hormuz, only 50 kilometers wide at its narrowest point, is the most dangerous choke point in the world for oil. Roughly 20–30% of the world’s oil goes through the Straits on any given day.
WTI oil appears to have created a floor in the $70/$72 zone.
Copyright David Chapman, 2023
|
GLOSSARY
Trends
Daily – Short-term trend (For swing traders) Weekly – Intermediate-term trend (For long-term trend followers) Monthly – Long-term secular trend (For long-term trend followers) Up – The trend is up. Down – The trend is down Neutral – Indicators are mostly neutral. A trend change might be in the offing. Weak – The trend is still up or down but it is weakening. It is also a sign that the trend might change. Topping – Indicators are suggesting that while the trend remains up there are considerable signs that suggest that the market is topping. Bottoming – Indicators are suggesting that while the trend is down there are considerable signs that suggest that the market is bottoming. |
David Chapman is not a registered advisory service and is not an exempt market dealer (EMD) nor a licensed financial advisor. He does not and cannot give individualised market advice. David Chapman has worked in the financial industry for over 40 years including large financial corporations, banks, and investment dealers. The information in this newsletter is intended only for informational and educational purposes. It should not be construed as an offer, a solicitation of an offer or sale of any security. Every effort is made to provide accurate and complete information. However, we cannot guarantee that there will be no errors. We make no claims, promises or guarantees about the accuracy, completeness, or adequacy of the contents of this commentary and expressly disclaim liability for errors and omissions in the contents of this commentary. David Chapman will always use his best efforts to ensure the accuracy and timeliness of all information. The reader assumes all risk when trading in securities and David Chapman advises consulting a licensed professional financial advisor or portfolio manager such as Enriched Investing Incorporated before proceeding with any trade or idea presented in this newsletter. David Chapman may own shares in companies mentioned in this newsletter. Before making an investment, prospective investors should review each security’s offering documents which summarize the objectives, fees, expenses and associated risks. David Chapman shares his ideas and opinions for informational and educational purposes only and expects the reader to perform due diligence before considering a position in any security. That includes consulting with your own licensed professional financial advisor such as Enriched Investing Incorporated. Performance is not guaranteed, values change frequently, and past performance may not be repeated.
About the author


Website: https://www.enrichedinvesting.com
Disclaimer: David Chapman is not a registered advisory service and is not an exempt market dealer (EMD) nor a licensed financial advisor. We do not and cannot give individualised market advice. David Chapman has worked in the financial industry for over 40 years including large financial corporations, banks, and investment dealers. The information in this newsletter is intended only for informational and educational purposes. It should not be considered a solicitation of an offer or sale of any security. The reader assumes all risk when trading in securities and David Chapman advises consulting a licensed professional financial advisor before proceeding with any trade or idea presented in this newsletter. David Chapman may own shares in companies mentioned in this newsletter. We share our ideas and opinions for informational and educational purposes only and expect the reader to perform due diligence before considering a position in any security. That includes consulting with your own licensed professional financial advisor.