
"With a good perspective on history, we can have a better understanding of the past and present, and thus a clear vision of the future."
—Carlos Slim Helu, Mexican business magnate, investor, philanthropist, CEO Telmex, America Movil, Grupo Carso; b. 1940
"In investing, what is comfortable is rarely profitable."
—Robert Arnott, American entrepreneur, investor, editor, writer on quantitative investing, Chair Research Affiliates LLC, editor CFA Institute, author of books on portfolio management; b. 1954
"How many millionaires do you know who have become wealthy by investing in savings accounts? I rest my case."
—Robert G. Allen, American businessman, Democrat congressman Pennsylvania 1937–1940; 1902–1963
We have found it increasingly astounding the growth in money supply and the Fed’s balance sheet since the pandemic got underway back in the first months of 2020. Yes, the governments were no doubt required to respond to the sudden massive jump in unemployment that took place in those first few months as the Western economies shut down to combat the pandemic. A failure to respond, or to leave things alone and let “nature” takes it course could well have resulted in an economic depression that would have been very difficult to recover from. That in turn would have triggered a political crisis in an already polarized political environment.
Based solely on the monthly job numbers, the U.S. lost 22,362 thousand jobs in March/April 2020 while Canada shed 3,004.5 thousand. That represented 14.8% and 15.7% respectively of the total number employed at the time in the U.S. and Canada. The core unemployment rate shot to 14.8% in the U.S. and 13.7% in Canada respectively at its peak in May 2020. Real unemployment—i.e., U.S. U6 unemployment—shot to 22.9% and the R8 unemployment rate in Canada reached a peak of 18.3%. Those rates are depression level. Governments spent trillions injecting liquidity into the financial system and providing support for the sudden mass of unemployment to the tune of roughly $4.5 trillion in the U.S. and in Canada $300 to $500 billion. This is in addition to bond-buying programs known as QE to the tune of $120 billion/month in the U.S. and $3 billion/week in Canada. The support has been ongoing and shows no sign of slowing (tapering).
With so much money flooding the system, the question begs—where did all this money go? For consumers savings shot up, hitting a rate of 33.7% in the U.S. and 28.2% in Canada. Those rates have since come down as personal spending recovered, even as it remains below peak spending before the pandemic. Personal savings rates remain high at 14.9% in the U.S. and 13.1% in Canada. Deposits in commercial banks soared up $3.9 trillion in the U.S. since February 2020 but only about $250 billion in Canada. The same thing happened in the EU, Japan, and elsewhere.
With all the money being pumped into the financial system, the expectation was that it would spur economic activity and help moderate the severity of the downturn because of the pandemic. The amount being pumped into the system paled with what was pumped in during the 2008 financial crisis. With QE, the banks’ balance sheets were overwhelmed with cash. So, what do you do with it all? Well, lend it out. But lending dried up as banks tightened credit rules. While commercial loans shot up in the early days of the pandemic, they have since fallen. After rising $680 billion from February 2020 to May 2020, total commercial and industrial loans have since fallen $493 billion, essentially giving the gain back. Money found its way into the stock market in speculation as the S&P 500 soared 95% from March 2020 the pandemic crash low to record levels. The TSX is up 81% and also hit record levels.
Consumers went on a house-buying spending spree, pushing up housing prices as mortgages soared. As well, household debt to GDP rose in the U.S. and hit record levels in Canada, raising concerns about the amount of debt households were carrying. Housing prices rose 37% in Canada but only 14% in the U.S. The problem is reflected in the high number of investors leaping into the housing market, where it is estimated that at least 20% of house purchases in the past year were not made by end buyers but by investors. Some may be speculating on higher prices to flip.
But against this backdrop, the velocity of money (how quickly dollars turn over in the economy) kept falling. Banks, with balance sheets engorged with cash, didn’t know what to do with it all. The result was they put it back with the central banks in the form of bank reserves. Money supply—M1, M2, and the Monetary base—soared. Reserves of banks at the Federal Reserve have shot up 124% since February 2020 or $2.1 trillion. Since 2008 bank reserves are up $3.8 trillion or over 8,000%.
Federal Reserve Assets, Monetary Base 2000-2021
$ Millions
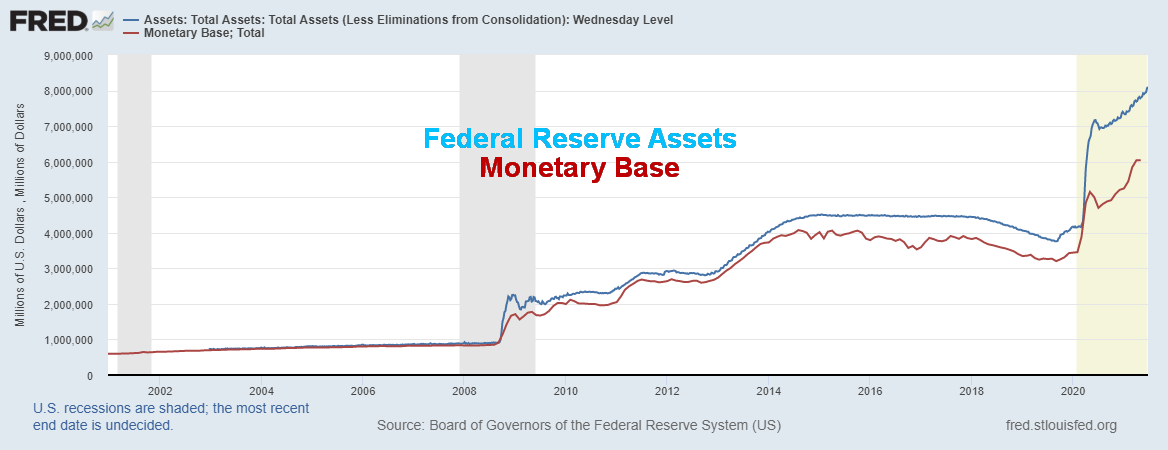
Source: www.stlouisfed.org
Our chart above shows the massive growth in the Federal Reserve’s balance sheet up $4.1 trillion or almost 100% since February 2020. The monetary base, consisting of highly liquid funds—notes, coins, current bank deposits, reserve deposits at the central bank—leaped $2.6 trillion or 76%.
Money Supply: M1, M2 2000–2021
$billions
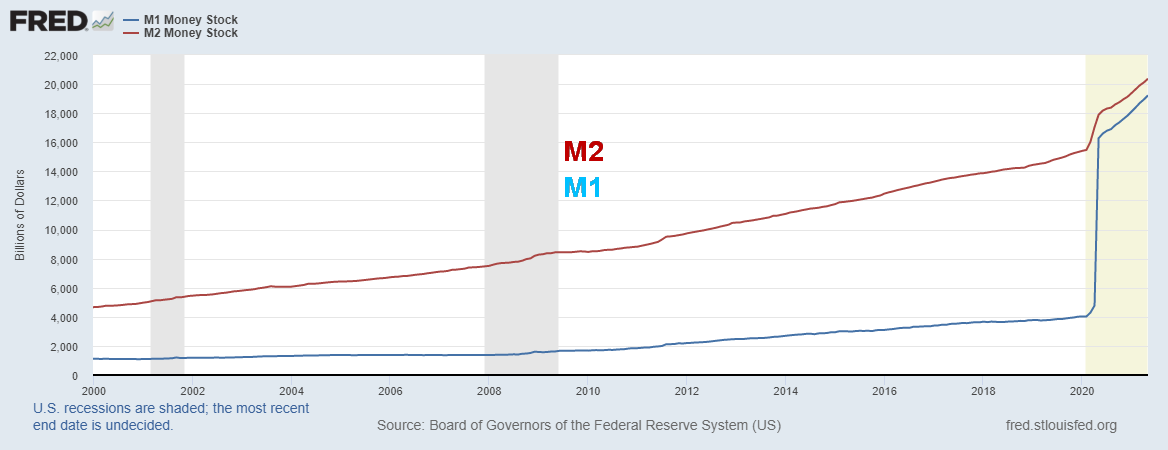
Source: www.stlouisfed.org
Money supply also soared. M1—basic money supply, currency, coin, demand deposits, travelers’ cheques, checkable accounts—is up an astounding $15.1 trillion since February 2020 or 272%. As well,
M2—M1 plus savings accounts, money market securities, mutual funds, time deposits. all that can be converted to cash—grew by almost $5 trillion or 32%. Bank assets have grown $3.6 trillion but the amount of outstanding commercial loans and leases has fallen $495 billion even as their holdings of treasury bills and other government agency securities has grown.
All that money. It has to go somewhere. And where it has gone is onto the balance sheet of the central bank: in the U.S., in the E.U., in Canada, in Australia, in Japan, etc. The result is that bank reserves at the Fed have soared up almost $2.2 trillion since February 2020. The Fed even raised the rate of interest for reserves to 0.15% from 0.10% to encourage the banks. Otherwise, extreme pressure on buying treasury bills, etc. could push interest rates negative, something the Fed doesn’t want. Bank reserves show up as a liability on the Fed’s balance sheet.
To soak up all the excess liquidity in the financial system, the Fed has been conducting reverse repos whereby the financial institutions give their money to the Fed in overnight repurchase agreements (reverse repos). Again, this is to help prevent interest rates from potentially going negative and to soak up excess liquidity. Reverse repos have now hit an incredible record of $813 billion daily.
The Fed giveth (in QE $120 billion/month) and the Fed taketh (in overnight reverse repos now $813 billion/day, subject to daily change). Fed gives cash with one hand and takes it back with the other. One winds up as a permanent asset on the Fed’s balance sheet (QE) while the other is a short-term liability that could end at any time. Banks are not finding enough creditworthy loans. The velocity of money falls. So, they give their money to the Fed—which is better than receiving negative interest rates.
The Fed is caught in a trap that they cannot get out of. With the economy still moribund and unemployment still very high, the Fed can’t stop the QE program or it could cause financial instability in the markets, potentially sparking the reverse wealth effect—i.e., a market crash as everyone rushes for the door at once. The Fed’s QE program is having little real effect. But money supply, its balance sheet, and all that cash sloshing around is ultimately inflationary. It sloshes into the stock market, housing market, cryptos, NFTs, collectibles, art, etc., pushing up prices. The Fed is worried about inflation even if it is transitory (that could be a year or more) but its hands are tied. They can’t raise interest rates as that might spark a market panic. And the market has become so used to low to zero rates that raising them even a little could spark a panic. If the markets had to face another panic it would make what happened in 2008–2009 seem like a Sunday school picnic. We are reminded that, since the world went off of the gold standard in August 1971, the Western world has faced increasingly stronger financial crises, each one worse than the previous one: in 1973–1974, 1980–1982, 2000–2002, 2007–2009, and 2020–2021.
The rock and the hard place.
Overnight Reverse Repos Sold by Federal Reserve Temporary Open Market Operations
$ billions
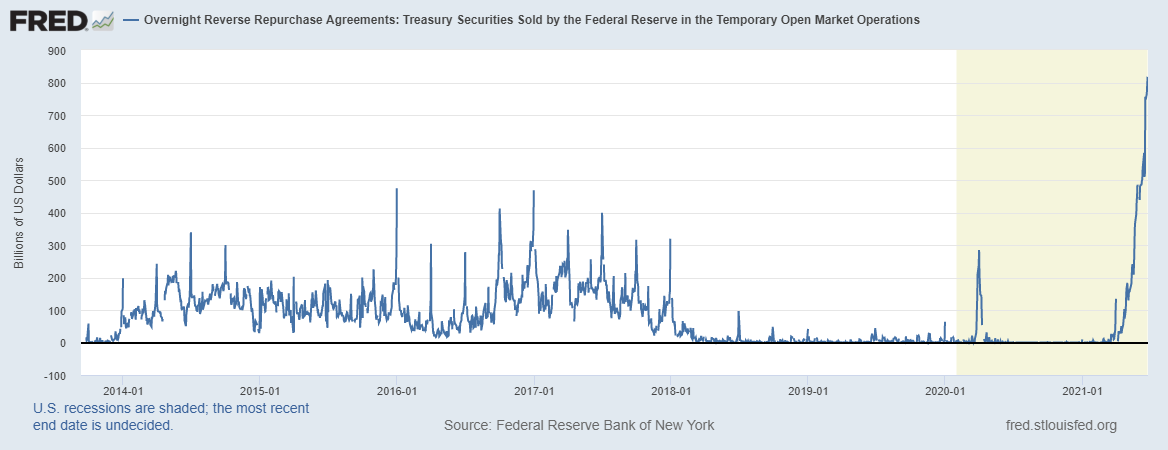
Source: www.stlouisfed.org
The Pandemic Rages On!
The pandemic is easing. But it hasn’t gone away. As the western world i.e., North America, EU etc. get vaccinated things are opening up and the numbers are plunging. But elsewhere it is not as rosy. And while it has eased the numbers remain disturbingly high. And variants are showing up at the forefront making them a challenge for the unvaccinated less so for the vaccinated. Brazil, India and much of Latin America are still getting high numbers. Daily new cases are leveling out just under 370 thousand/day a far cry from the peak of 828 thousand/day in January. Deaths are falling but still around 8,000/day down from a peak of almost 15,000/day back in January 2021.
Sunday June 27, 2021 – 14:52 GMT
World
Number of cases: 181,679,361
Number of deaths: 3,935,390
Cases per million: 23,308
Deaths per million: 504.9
U.S.A.
Number of cases: 34,490,134
Number of deaths: 619,343
Cases per million: 103,601
Deaths per million: 1,860
Canada
Number of cases: 1,412,768
Number of deaths: 26,214
Cases per million: 37,112
Deaths per million: 689
Source: www.worldometers.info/coronavirus
Chart of the Week
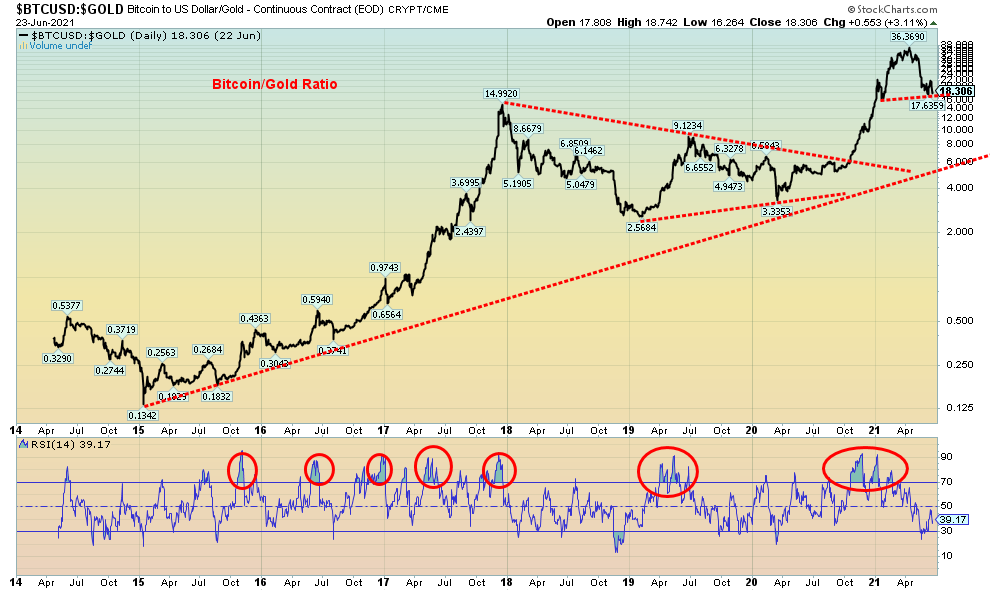
Source: www.stockcharts.com
We have been recently asked the question as to whether there is any relationship between Bitcoin and gold. The best way of looking at that is through ratio charts; in this case, the Bitcoin/Gold ratio. Naturally, there is not a lot of history since Bitcoin has only been around since 2014. Since then, the action has favoured Bitcoin over gold. But could that be changing?
From 2015 to 2017 with Bitcoin soaring, the supposed place to be was Bitcoin. Bitcoin topped out in December 2017 at around $19,900. Bitcoin then went into a decline that made its final bottom in December 2018 near $3,200 and a secondary bottom in March 2020 just under $4,000. From there, Bitcoin took off again, topping out in April 2021 near $65,000. At that point the Bitcoin/Gold ratio hit its high at 36.37. Since then, however, with Bitcoin taking a hit, the ratio has fallen to 18.30 for a decline of about 50%.
However, concluding that one should now own gold over Bitcoin is not so conclusive. That uptrend line currently near 6 might be a preferred target. That’s a 67% decline from current levels and would imply that Bitcoin could fall to under $11,000 for the ratio to reach that level, assuming gold was held constant at current prices. While the trend on the ratio has turned down on the short-term (daily) charts, it is only neutral on the intermediate (weekly) chart and still long on the long-term (monthly) chart. However, it wouldn’t take much of a further decline for Bitcoin to change the intermediate trend to down. A decline under the December 2017 high near 15.0 would most likely turn the ratio down in favour of gold. There appears to be forming a small head and shoulders top on the ratio. The neckline breaks under 16.60 and potentially projects down to 2.60. That’s quite a drop.
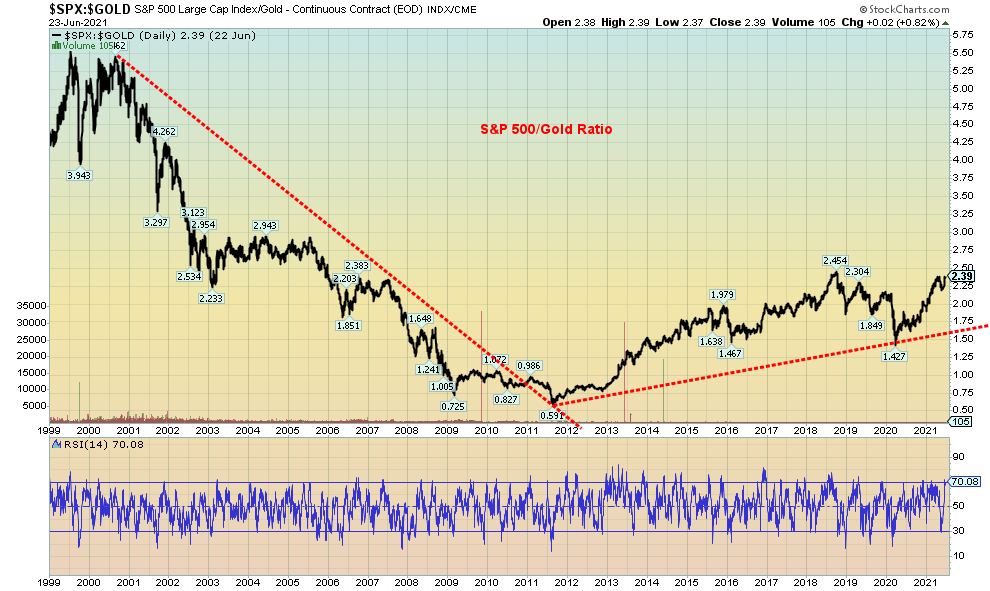
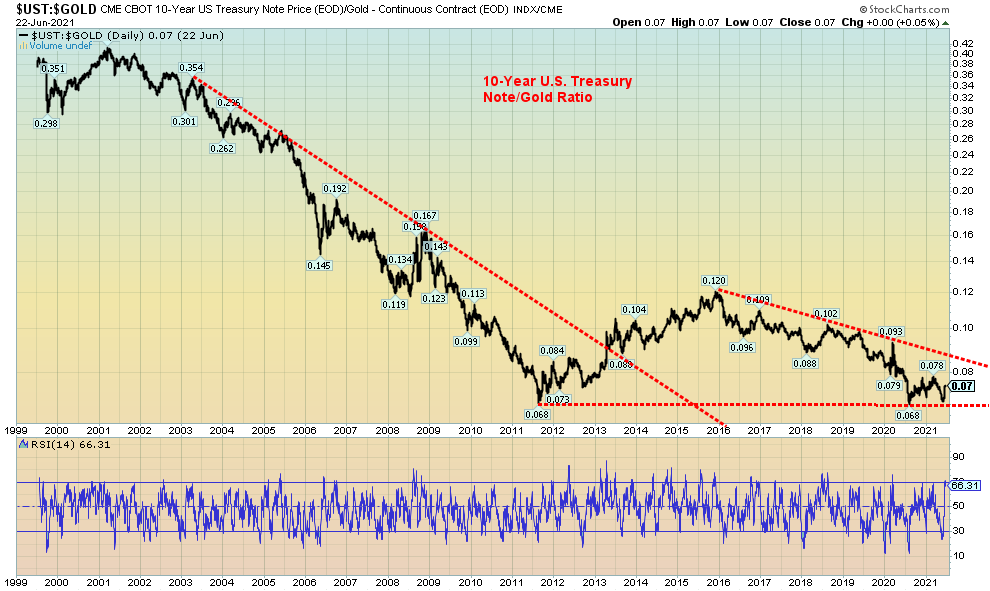
It is also worthwhile at this time to show the S&P 500/Gold ratio along with the 10-year U.S. Treasury Note/Gold ratio.
Source: www.stockcharts.com
Source: www.stockcharts.com
As we know, gold topped out in 2011. Since then, the S&P 500 has generally outperformed gold as the S&P 500/Gold ratio has moved higher from 0.59 to today’s level of 2.39. But of bigger importance is the fact that the S&P 500/Gold ratio is down 58% from its 1999 high. The same has occurred with the 10-year U.S. Treasury note. The ratio has fallen 82% since 2001. Grant you, that doesn’t take into account any interest payments that may have been made. So, what that tells us is in real terms and as measured against money, assuming one considers gold to be money, is that the markets haven’t gone up—instead, they have actually gone down.
Yes, the S&P 500/Gold ratio could still move higher, although it could also be making a double top here. It would appear that the 10-year Note/Gold ratio could be making a multi-year double bottom. If all that were correct, then one would want to buy bonds.
MARKETS AND TRENDS
|
|
|
|
% Gains (Losses) Trends
|
|||||
|
|
Close Dec 31/20 |
Close Jun 25/21 |
Week |
YTD |
Daily (Short Term) |
Weekly (Intermediate) |
Monthly (Long Term) |
|
|
Stock Market Indices |
|
|
|
|
|
|
|
|
|
S&P 500 |
3,756.07 |
4,280.70 (new highs) |
2.7% |
14.0% |
up |
up |
up |
|
|
Dow Jones Industrials |
30,606.48 |
34,433.84 |
3.4% |
12.5% |
up (weak) |
up |
up |
|
|
Dow Jones Transports |
12,506.93 |
14,976.77 |
2.4% |
19.8% |
down |
up |
up |
|
|
NASDAQ |
12,888.28 |
14,360.39 (new highs) |
2.4% |
11.4% |
up |
up |
up |
|
|
S&P/TSX Composite |
17,433.36 |
20,230.26 |
1.2% |
16.0% |
up |
up |
up |
|
|
S&P/TSX Venture (CDNX) |
875.36 |
948.51 |
0.2% |
8.4% |
neutral |
up |
up |
|
|
S&P 600 |
1,118.93 |
1,388.76 |
4.4% |
24.1% |
up |
up |
up |
|
|
MSCI World Index |
2,140.71 |
2,346.32 |
(0.7)% |
9.6% |
neutral |
up |
up |
|
|
NYSE Bitcoin Index |
28,775.36 |
32,853.40 |
(10.6)% |
14.2% |
down |
neutral |
up |
|
|
|
|
|
|
|
|
|
|
|
|
Gold Mining Stock Indices |
|
|
|
|
|
|
|
|
|
Gold Bugs Index (HUI) |
299.64 |
269.04 |
(0.8)% |
(10.2)% |
down |
down |
up |
|
|
TSX Gold Index (TGD) |
315.29 |
294.32 |
(1.4)% |
(6.7)% |
down |
down |
up |
|
|
|
|
|
|
|
|
|
|
|
|
Fixed Income Yields/Spreads |
|
|
|
|
|
|
|
|
|
U.S. 10-Year Treasury Bond yield |
0.91 |
1.52% |
4.8% |
67.3% |
|
|
|
|
|
Cdn. 10-Year Bond CGB yield |
0.68 |
1.45% |
5.8% |
113.2% |
|
|
|
|
|
Recession Watch Spreads |
|
|
|
|
|
|
|
|
|
U.S. 2-year 10-year Treasury spread |
0.79 |
1.25% |
4.2% |
58.2% |
|
|
|
|
|
Cdn 2-year 10-year CGB spread |
0.48 |
1.00% |
9.9% |
108.3% |
|
|
|
|
|
|
|
|
|
|
|
|
|
|
|
Currencies |
|
|
|
|
|
|
|
|
|
US$ Index |
89.89 |
91.84 |
(0.4)% |
2.2% |
up |
neutral |
down |
|
|
Canadian $ |
0.7830 |
0.8120 |
0.9% |
3.7% |
down |
up |
up |
|
|
Euro |
122.39 |
119.36 |
0.6% |
(2.5)% |
down |
neutral |
up |
|
|
Swiss Franc |
113.14 |
109.05 |
0.6% |
(3.6)% |
down |
down (weak) |
up |
|
|
British Pound |
136.72 |
138.88 |
0.6% |
1.6% |
down |
up |
up |
|
|
Japanese Yen |
96.87 |
90.28 |
(0.5)% |
(6.8)% |
down |
down |
down |
|
|
|
|
|
|
|
|
|
|
|
|
Precious Metals |
|
|
|
|
|
|
|
|
|
Gold |
1,895.10 |
1,777.80 |
0.5% |
(6.2)% |
down |
down (weak) |
up |
|
|
Silver |
26.41 |
26.09 |
0.5% |
(1.2)% |
down |
neutral |
up |
|
|
Platinum |
1,079.20 |
1,103.60 |
6.3% |
2.3% |
down |
neutral |
up |
|
|
|
|
|
|
|
|
|
|
|
|
Base Metals |
|
|
|
|
|
|
|
|
|
Palladium |
2,453.80 |
2,637.20 |
6.8% |
7.5% |
down |
up (weak) |
up |
|
|
Copper |
3.52 |
4.29 |
3.2% |
21.9% |
down |
up |
up |
|
|
|
|
|
|
|
|
|
|
|
|
Energy |
|
|
|
|
|
|
|
|
|
WTI Oil |
48.52 |
74.05 (new highs) |
3.9% |
52.6% |
up |
up |
up |
|
|
Natural Gas |
2.54 |
3.52 (new highs) |
9.7% |
38.6% |
up |
up |
up |
|
Source: www.stockcharts.com, David Chapman
Note: For an explanation of the trends, see the glossary at the end of this article.
New highs/lows refer to new 52-week highs/lows and in some cases all-time highs.
Source: www.stockcharts.com
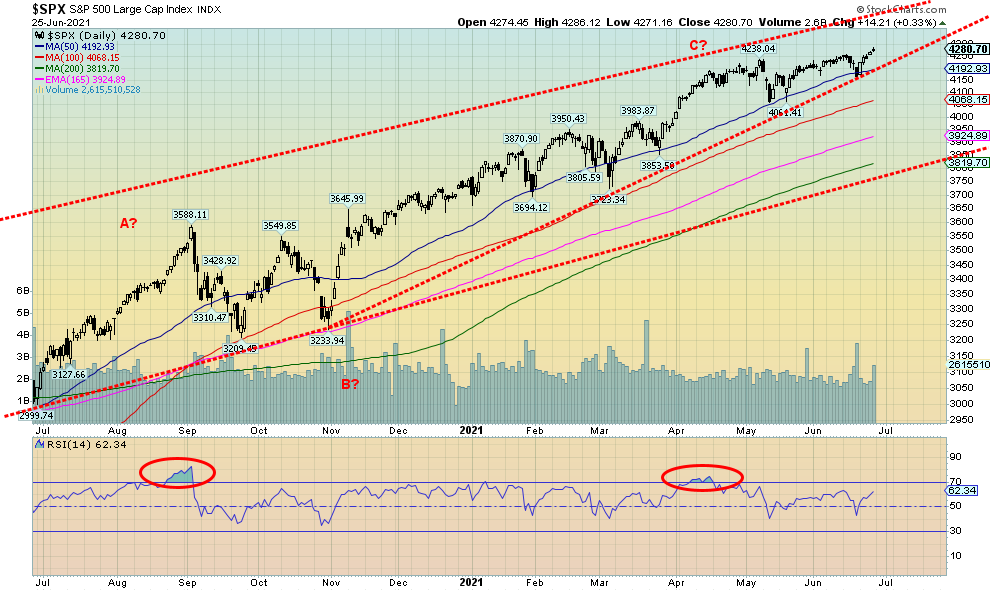
Thoughts of a pullback in the stock market are fading with the S&P 500 making new all-time highs once again this past week with a gain of 2.7%. The market may be overbought, but does the market really care as long as the Fed stays benign and they keep pumping the money into the financial system. So, instead of a June high, a July high now becomes the possibility. Not everyone joined the S&P 500 in making new all-time highs. The NASDAQ did with a gain of 2.4%. But that was it for the major indices. The Dow Jones Industrials (DJI) did gain 3.4% and the Dow Jones Transportations (DJT) was up 2.4%, but neither made new all-time highs, a divergence. Another divergence was with the S&P 500 equal weight index that did gain 3.3% but failed as well to make new all-time highs.
But some others did make new all-time highs: notably, the NASDAQ 100, the S&P 100 (OEX), the Wilshire 5000, and the three Russell’s 1000, 2000, and 3,000. The Russell’s were benefitting from re-balancing as stocks were moved between the three 1000, 2000, and 3000. AMC in the 2000 helps. Elsewhere, the TSX Composite did not make new highs but gained 1.2%. The TSX Venture Exchange (CDNX) was up a small 0.2%. The MSCI World Index was down 0.7%. In the EU, the London FTSE gained 1.9%, the Paris CAC 40 was up 0.8%, and the German DAX jumped 1.0%. None of them made new all-time highs. And neither did the major Asian exchanges as China’s Shanghai Index (SSEC) was up 2.3% and the Tokyo Nikkei Dow (TKN) gained 0.4%. Maybe the most telling on the week was Bitcoin and the cryptos. Bitcoin fell 10.6%. Our favourite Dogecoin was down 14.7%. A break for Bitcoin back under $30,000 could start its decline to targets in the low $20,000’s.
While stories abound how the 2020s are going to be the Roaring Twenties, the signs that we are seeing are not exactly pointing to a robust economy. Next week’s June job report could be telling. And, of course, it could surprise as well but the signs we are seeing are not positive for a big jump in employment. The market is rotating, a sign that it is getting tired. The market is being driven by Fed largesse with QE, despite the ongoing reverse repo programme that is soaking up excess liquidity. But it is also preventing interest rates from going negative.
With the markets moving higher, all we can do is draw the potential line in the sand that we would not want to see crossed. For the S&P 500 it is at 4,060 although trouble starts under 4,185. For the DJI it is at 33,250. For the DJI above 34,800 new highs are possible. The S&P 500 appears as a rising triangle as does the NASDAQ. The S&P 500 does have potential to rise to over 4,400. That cannot be ruled out. However, the markets are getting tired. We didn’t have a June high but the potential for a July high instead is rising. But no crash. Not yet, anyway.
Source: www.stockcharts.com
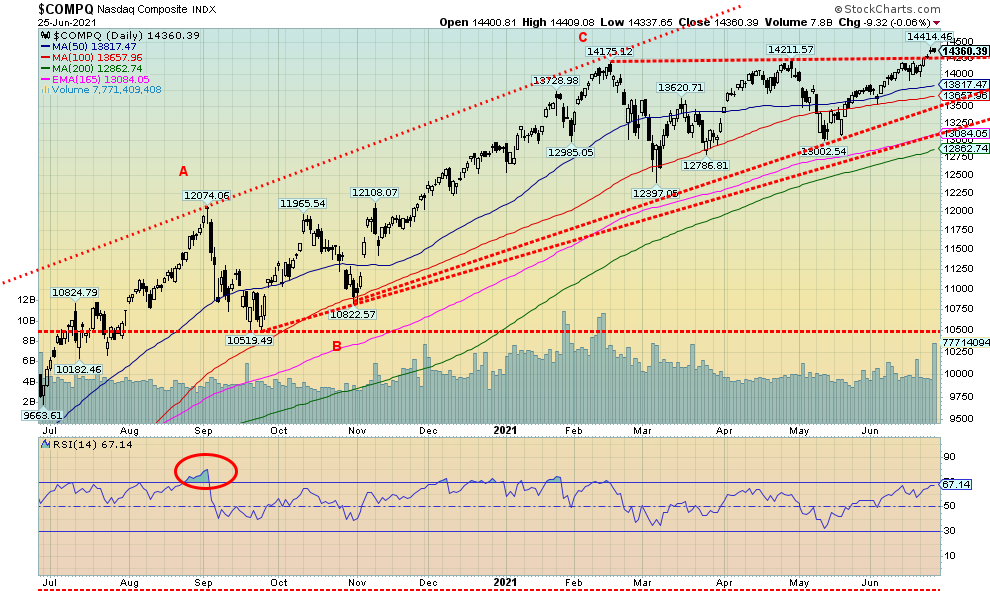
After a number of weeks lagging the other major indices, the NASDAQ made new all-time highs this past week, gaining 2.4%. As the Fed indicated more benign inflation and eased thoughts about tapering, the switch was on to sell value and buy growth. For the most part the FAANGs rose on the week. Facebook gained 3.6% to new all-time highs, Apple was up 2.0%; Amazon, however, was a loser, down 2.5%, Google gained 1.1% and Netflix was a star, up 5.3%. Microsoft made new all-time highs up 2.2%, Tesla soared up 7.8%, and Twitter soared more up 11.6% while Baidu gained 8.8%, Alibaba was up 7.6%, and Nvidia made all-time highs up 2.1%. Great week for tech. Berkshire Hathaway, the biggie value stock gained 1.6%. The breakout for the NASDAQ to new all-time highs will have the bulls chortling. Potential targets could even be up to 16,000, based on what appears to be an ascending triangle pattern. Failure would come only if the NASDAQ slipped below 14,000 once again and a breakdown would be confirmed below 13,500. The result of all of this has put thoughts of a pullback on hold, at least. And the potential is now there for even higher highs.
U.S. Personal Income and Personal Spending 2016-2021
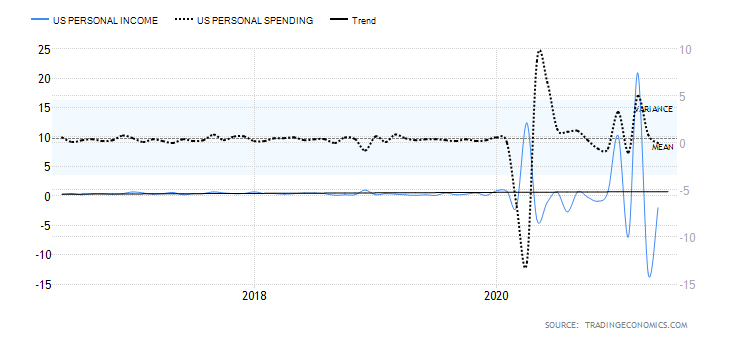
Source: www.tradingeconomics.com
Personal income in the U.S. fell 2% in May month over month. Actually, that was better than expected as the market had anticipated a 2.5% drop. In April, PI was down 13.1%. Stimulus cheques fell along with other social benefits and support payments. Unemployment insurance was also down as pandemic compensation programs were cut back or wore down. So, what does that mean for spending?
Personal spending was unchanged in May. But it was below expectations of a 0.4% increase. Goods spending fell but services spending rose. If personal income keeps falling as it did in April and May, then what does that say about personal spending going forward? Consumer credit rises?
But what about inflation?
Personal Consumption Expenditures (PCE) Index 1959-2021
Percent Change Year-Over-Year
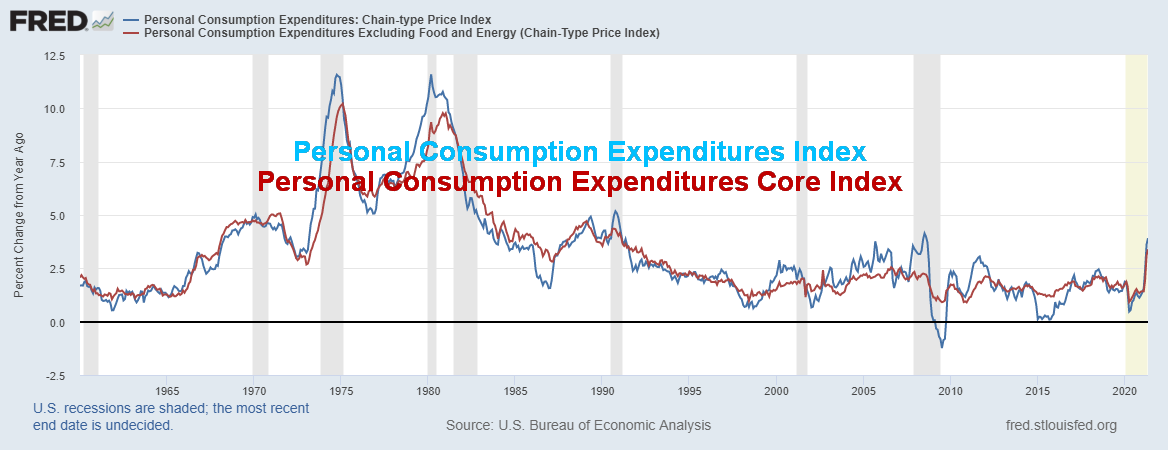
Source: www.stlouisfed.org
The PCE Index rose 0.4% in May, down from a rise of 0.6% in April. That was below the market expectations of 4.2%. Year over year it was up 3.9% again, below expectations of a rise of 4.2%. The core PCE rate was up 0.5% vs. 0.7% in April and up 3.4% year over year vs. an expectation of a rise of 0.6% and 3.5% year over year. The softer than expected PCE rate helped steady the gold market as inflation was not as high as many expected. Still, it was fastest growth for the PCE since the early 1990s.
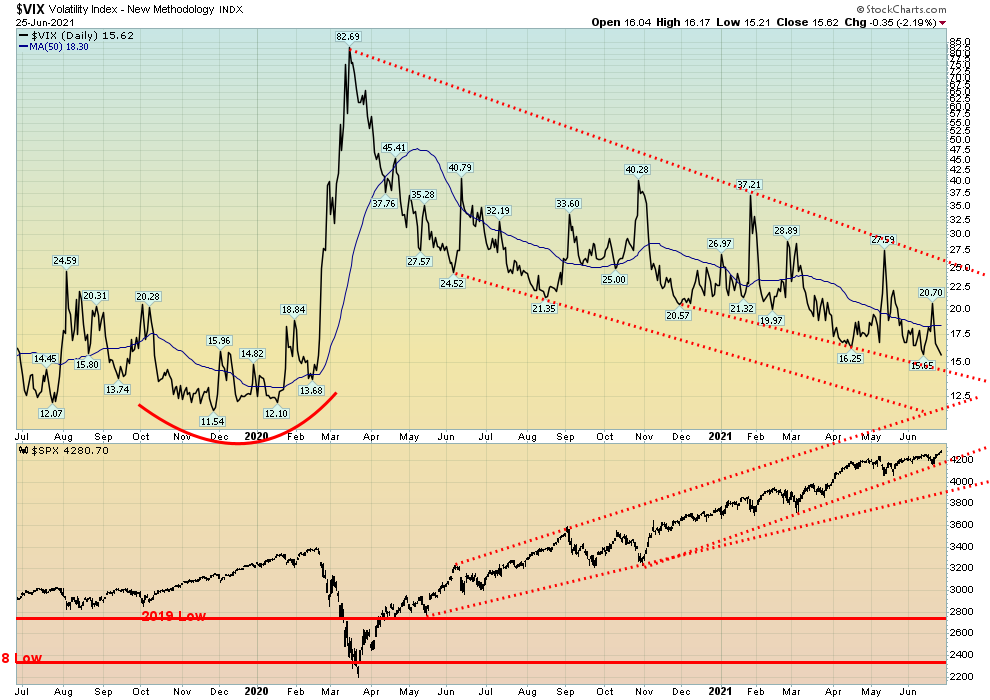
Source: www.stockcharts.com
The VIX Volatility indicator continues its downward trend, even as the S&P 500 makes new highs. Still, the VIX remains above the lows seen in late 2019 before the March 2020 pandemic crash. A falling VIX is a sign of complacency in the market, but again, until we see signs that the market is bottoming, it is merely a warning, not the confirmation of a high.
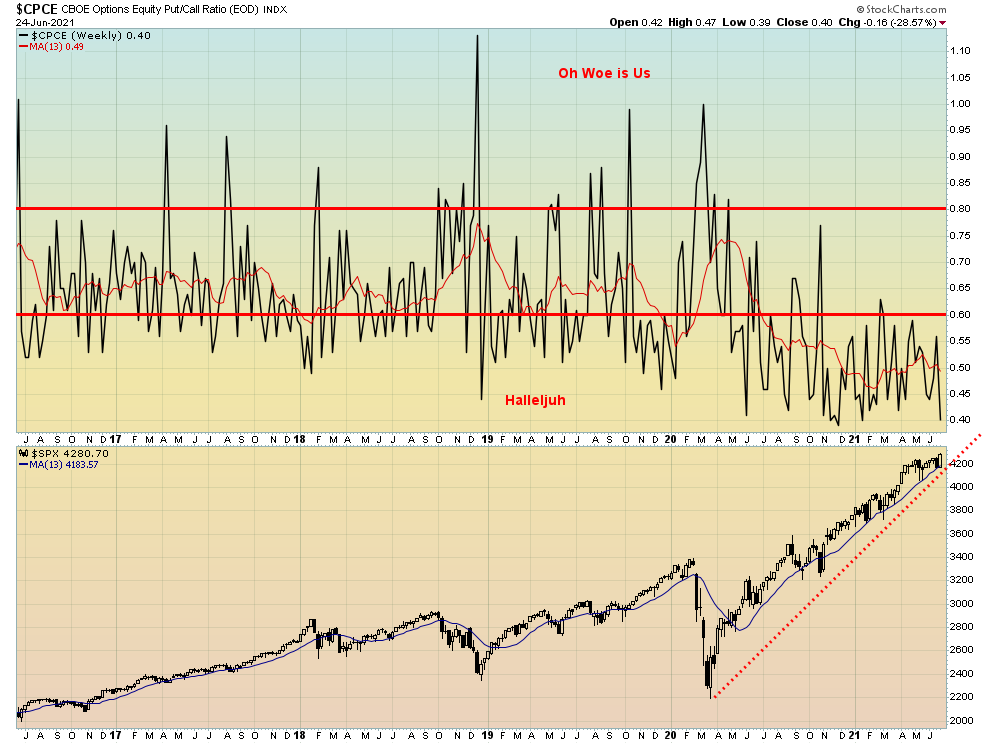
Source: www.stockcharts.com
We were somewhat surprised to see that the CBOE put/call ratio fell once again to the 0.40 level. The bullishness of the market is remarkable and it just keeps going up. As we have so often noted, there are warnings, but that does not guarantee that the market will drop. It is merely a sign of over-bullishness. Only a confirmation of breaking down under certain points can potentially confirm a top in the market.
Source: www.stockcharts.com
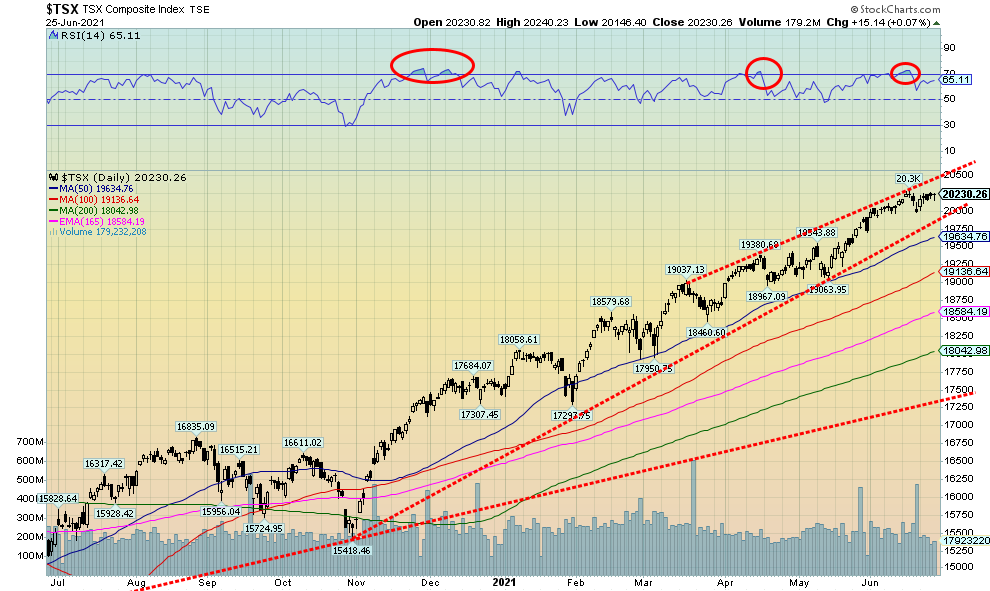
For the first time in seven weeks the TSX Composite did not make new all-time highs. The TSX did gain 1.2% to keep the uptrend firmly alive. The TSX continues its relentless upward climb. The TSX Venture Exchange (CDNX) also gained up 0.2%. Ten of the 14 sub-indices were up on the week led by Energy (TEN), up 5.4% and followed by Health Care (THC) +4.8%. Other good gains were seen for Consumer Discretionary (TCD) +2.2% and Metals & Mining (TGM) +2.6%. The big loser was Golds (TGD), down 1.4%. Overbought conditions have eased, but the TSX remains on a remarkable run, up 81% from the March 2020 crash low and up 16% in 2021. The TSX just climbs relentlessly higher but momentum is fading, suggesting a pullback could occur. However, as we have too often seen, that is not a guarantee and the bulls remain firmly in charge. The TSX’s first sign of trouble is under 20,000 and a breakdown under 19,850 could signal lower prices ahead. Long-term support is seen down to 18,000. A number of indicators continue to make negative divergences, suggesting a pullback could occur, at least. The TSX Bullish Percent Index (BPTSE) is currently at 72.73, high, but not at the highest ever seen. The indicator is diverging negatively with recent highs, meaning the TSX makes new highs but the indicator does not. These divergences are being seen across a number of indicators. They are warnings, but they do not guarantee a drop.
U.S. 10-year Treasury Bond/Canadian 10-year Government Bond (CGB)
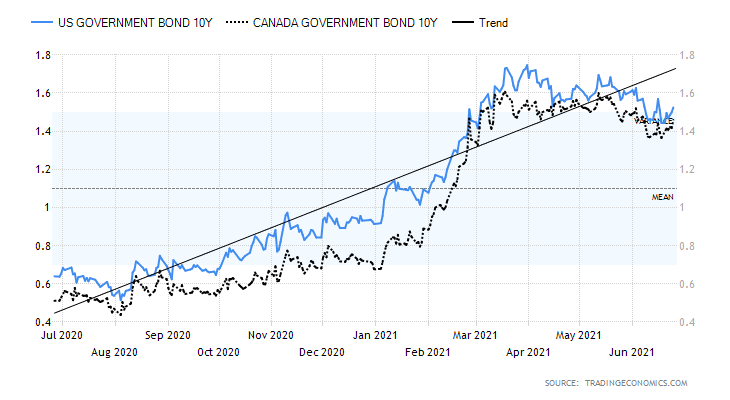
Source: www.tradingeconomics.com, www.home.treasury.gov, www.bankofcanada.ca
With inflation still raising its ugly head, the 10-year U.S. treasury note rose this past week back to 1.52%, up from 1.45% the previous week. This helps confirm for the bond bears that higher yields are in the works. A move back above 1.70% would tell us that new highs are probable and that we could then be on our way to 2.00%. A move that takes the 10-year below 1.35%–1.40% would suggest that instead of going higher the 10-year is headed lower once again towards 1.20% and even 1.00%. Right now, the patterns appear to support higher yields (lower prices as prices move inversely to yields). While the PCE inflation prices were below expectations, they were still high enough to keep the inflation hysteria crowd (“I told you so”) alive. Personal income and spending, which we also covered, were somewhat benign. The Fed spoke soothing words and seem to ease some thoughts of any tapering to come. The Michigan Consumer Sentiment Index came in at 85.5, slightly below the expected 86.5 but still above May’s 82.9. Q1 GDP growth was 4.3% vs. the previous (Q4 2020) 1.9%. The GDP number was right on target. Initial jobless claims remain high at 411 thousand vs. 418 thousand the previous week but above the expected 380 thousand. This coming Friday, July 2 are the nonfarm payrolls. The market is expecting a gain of 675 thousand vs. 559 thousand in May. However, the nonfarm payrolls have been notoriously off-target lately, usually lower than expected. The unemployment rate (U3) is expected at 5.7% vs. 5.8%. Watch the participation rate. Other numbers this past week showed new home sales fell 5.9% in May, below the expected 2.1% decline. However, the Markit Manufacturing Index came in at 62.6, slightly above the expected 61.5 and last month’s 62.1. All eyes will be on the job numbers this coming week and that in turn could help determine the next move for bond yields.
Source: www.stockcharts.com
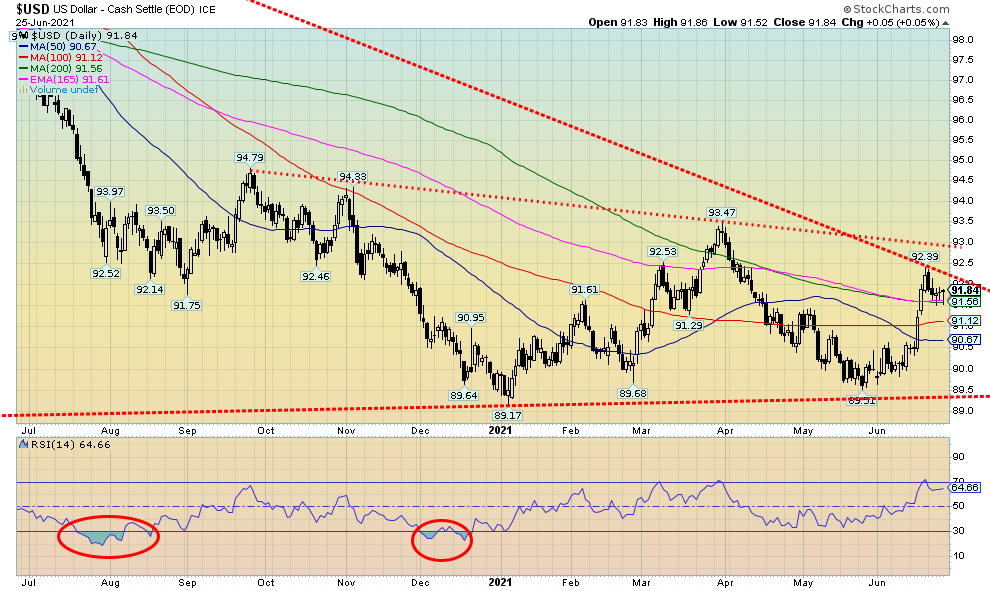
Is the US$ Index finished its recent rebound? After a big jump the previous week, the US$ Index saw little follow-through this past week. It faltered and was down on the week by 0.4%. The currencies rose as the euro was up 0.6%, the Swiss franc gained 0.6%, the pound sterling rose 0.6%, but the Japanese yen fell 0.5%. The Canadian dollar was the star once again, rising 0.9%. The U.S. dollar was negatively impacted by some weaker than expected economic numbers and the benign response from the Fed following the release of the PCE prices which were below expectations. With initial claims also below expectations, some are revising their expectations of the nonfarm payrolls for June due out next Friday as being lower. Grant you, the US$ Index is not out of the woods yet. A move now back above 92.30 would be negative and move above 93 would definitely suggest higher levels for the US$ Index. A move above 94.80 could suggest that a major bottom is in and targets to the upside could be up to 100.00. A stronger US$ Index is negative for gold. The points just above 200-day MA (currently at 91.56) have stopped the rally before. But the reality is that the US$ Index must drop once again below 91 and preferably under 90.50 to confirm to us that the downtrend has resumed.
Source: www.stockcharts.com
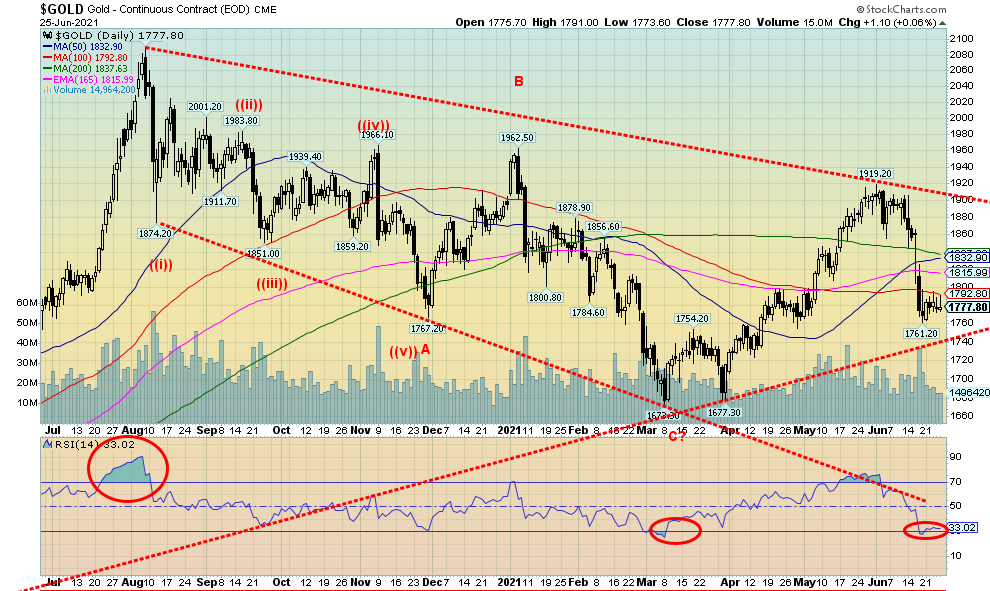
A more benign inflation report (PCE prices) and a more circumspect Fed helped to steady gold prices this past week. As a result, gold rose roughly 0.5% as did silver. Both platinum and palladium enjoyed a strong week with platinum up 6.0% and palladium up 6.8%. Copper recovered as well, gaining 3.2%. All these ended small losing streaks. However, the trend remains to the downside and the risk remains to the downside as long as gold remains under $1,800/$1,830. A move back above $1,830 would be positive and suggest that gold could once again move towards $1,900. Above $1,900 new highs are very probable above $1,919, the May high. The Fed’s soothing words plus an inflation number (PCE) that was below expectations have helped a bit in easing thoughts of tapering and Fed rate hikes. That has tempered the inflation hysteria at least a little bit. With mixed signals from the Fed, gold (and silver) have steadied. Still, with the gold stocks down again this past week, there remains some potential for lower prices first before any rise gets underway. There is support down to $1,760 and $1,750, but below $1,730 there is big trouble as the potential for a move to new lows under the March low of $1,673 rises sharply. Given the oversold levels, any further drop might be tempered but we need to respect the $1,730 line. The most recent COT is encouraging (see next page) so that is a positive. Strength in platinum, palladium, and copper this past week is also positive for gold. With the stock markets looking a little shaky still, one is reminded that it is not unusual for gold to fall along with the stock market. Gold does, however, usually outperform. That silver is maintaining relative strength against gold is another positive. The one bugaboo has been the gold stocks that have underperformed gold. Even in a downtrend like this our bullish preference is that the gold stocks hold relative strength like silver. They haven’t and that is a bit of concern. However, the gold/HUI ratio and the gold/TGD ratio have both reached overbought levels in favour of gold so a top could soon be seen. Another consideration for the current weakness is that the 31-month cycle low which was due centered in April 2021 could still be influencing the market. While the low so far was in March, the effects could be felt 5 months on either side of April 2021. That’s why we need to remain patient and await a clear sign that a bottom could be in. So far, we’ve seen little sign. The question on our mind is, once that 31-month cycle is confirmed, what will be the strength of the rebound? We remain cognizant of the coming 7.83-year cycle low and the 23–25-year cycle low. The question is, was August 2020 the top of the cycle? Recall that only gold made new all-time highs. Neither silver nor the gold stocks joined gold, a potentially significant negative divergence. We continue to believe, however, that the 7.83-year cycle low and the 23–25-year cycle low would not be seen until the 2022–2025-time frame, at least. So, our expectations are at least one more good run to the upside. However, will we see new highs above August 2020? That is the question.
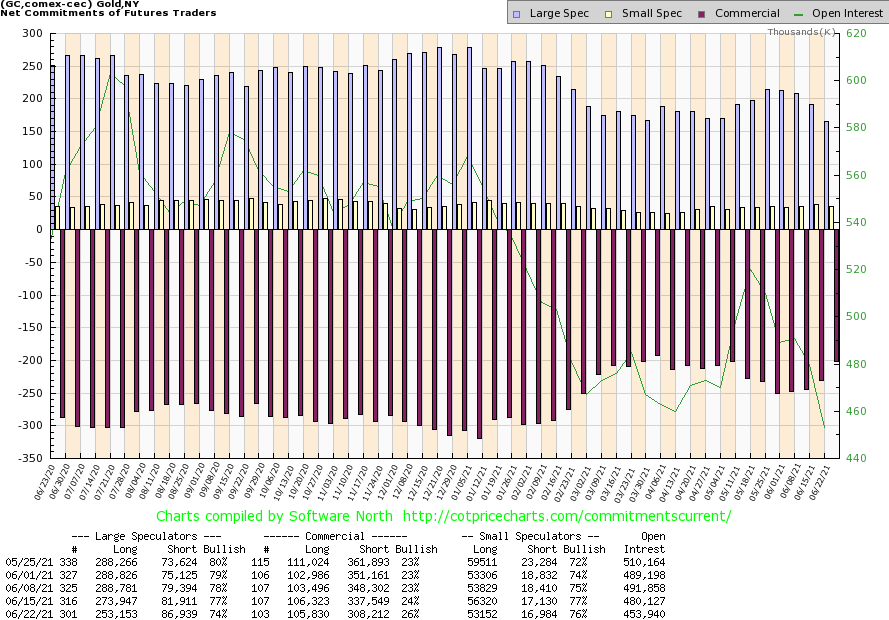
Source: www.cotpricecharts.com
The commercial COT (bullion companies and banks) continues to improve. The commercial COT for gold rose to 26% this past week from 24% the previous week and 23% the week before that. Long open interest was mostly flat on the week but short open interest fell by just over 29,000 contracts. That implies that the shorts were covering. The large speculators COT (hedge funds, managed futures, etc.) was down to 74% even as they shed over 20,000 longs while adding roughly 5,000 shorts. Overall, open interest fell over 26,000 contracts on a fairly flat week. The COT is improving; it’s not quite where we say bullish yet but we are getting there. Encouraging for the bulls.
Source: www.stockcharts.com
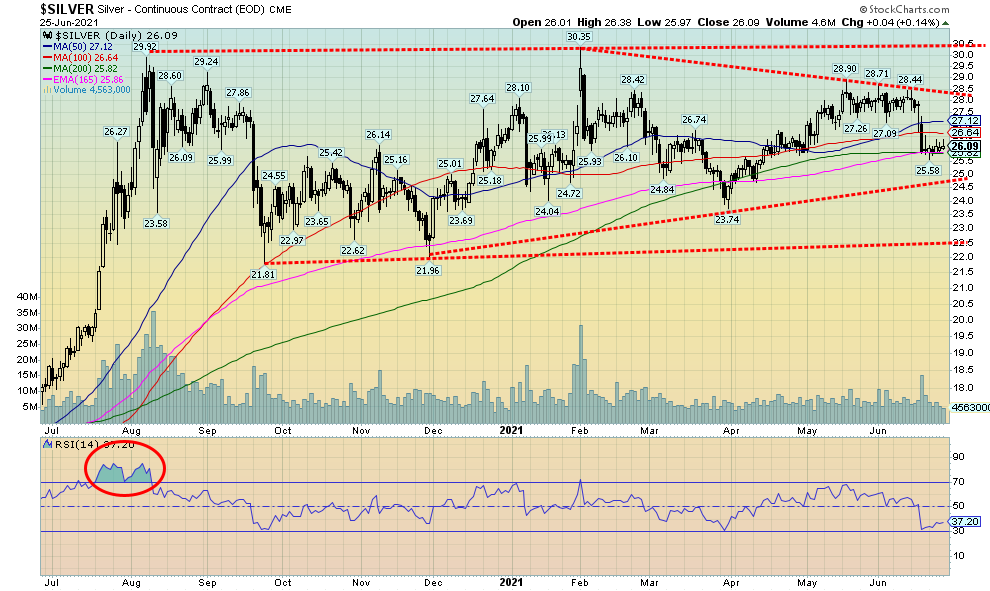
As with gold, silver was responsive to a potentially more benign Fed and gained almost 0.5% on the week. Small but significant. Silver has shown more relative strength than gold as the gold/silver ratio remains under 70 and area that is now resistance. The gold/silver ratio would be making new lows under 63, but a move back above 70 and especially above 75/77 would suggest that silver’s relative strength advantage was waning. Silver continues to make what appears to be some sort of triangular pattern. Except this pattern could be a top or it could be bottom, a problem with an ambiguous-looking chart. Silver breaks down under $25 but could break out to the upside above $28.50. Above $29 the highs at $30.35 could fall. Below $23.80 new lows under $22 are highly probable. The COT is showing some strength (see next page), so that’s a positive. Overall, the pattern still appears to us as bullish, but it is quite important that silver hold the $25 area if a rally is to develop.
Source: www.cotpricecharts.com
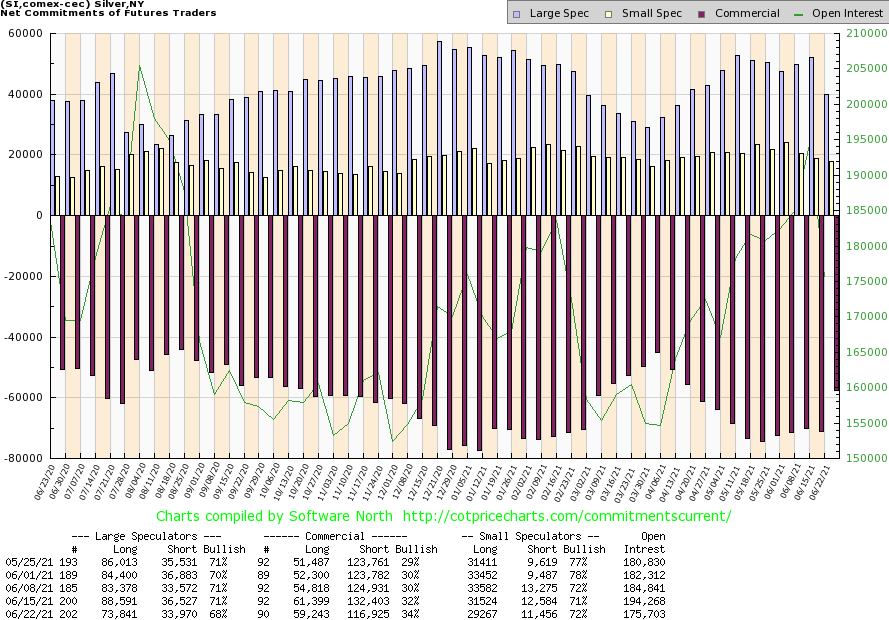
The silver commercial COT improved again this past week to 34% from 32% and 30% two weeks ago. Encouraging if you are a bull. Long open interest fell around 2,000 contracts but short open interest fell almost 16,000 contracts. The large speculators COT fell to 68% from 71% as they shed almost 15,000 long contracts but also shed almost 3,000 short contracts. Overall, open interest was down roughly 19,000 contracts. As with gold, this is encouraging and becoming more bullish as it is the best we’ve seen since the March 2021 low.
Source: www.stockcharts.com
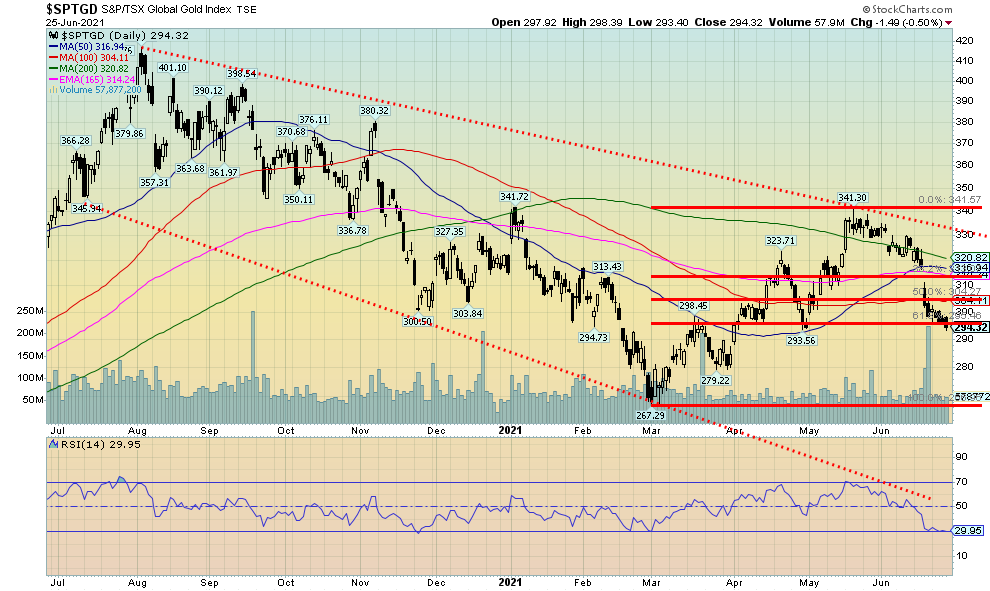
The gold stocks continue to struggle. Despite gold and silver both being up (small) on the week, the gold stocks finished in the red once again. The TSX Gold Index (TGD) fell 1.4% while the Gold Bugs Index (HUI) was off 0.8%. Both are down on the year by 6.7% and 10.2% respectively. All of this keeps the trend for the gold stocks to the downside. With RSIs under 30 at least on the dailies (short term), the gold stocks may attempt to try and find a bottom. Nonetheless, until a clear signal comes to tell us that the downtrend is over, one has to continue to respect that downtrend. The TGD has retraced just over a Fibonacci 61.8% of the up move from 267 in March to the high at 341 in May. The danger point comes if the TGD breaks down under 284. For the HUI, that point is at 266. Both points are just below current levels, thus highlighting the risk. Under those levels, the probability that the March lows will fall becomes high. Grant you, confirmation from both gold and silver would be helpful but the metals themselves appear to be less vulnerable. To the upside, the TGD needs to regain above 316 and preferably above 320 to convince us that the downtrend is most likely over. Above 330 new highs are probable. Volume rose sharply on the recent plunge. Given the oversold levels, a bounce could materialize, but the reality is the above points must be regained if there is any credibility of rebound to take hold. The bottom of that channel is way down at 240, almost 20% away from current levels.
Source: www.stockcharts.com
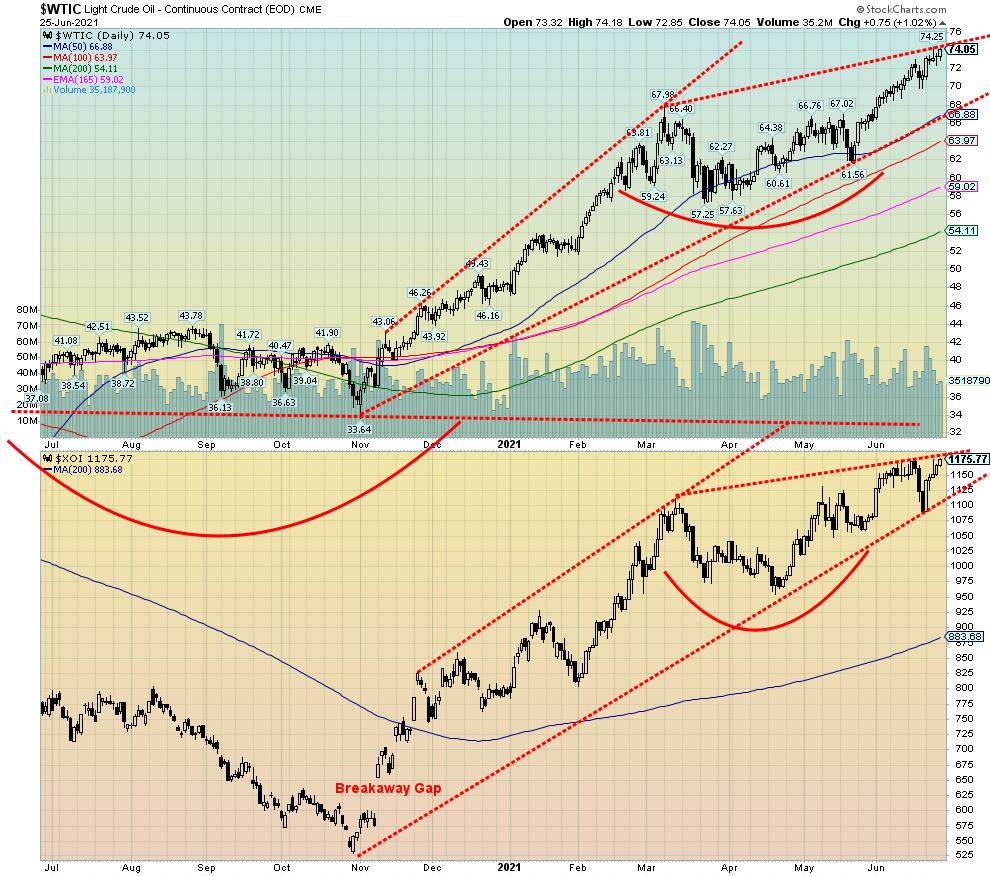
Concerns that OPEC might hike production output and Iran would be back in the game were brushed aside as oil prices surged to new 52-week highs once again this past week. WTI oil gained almost $3, up 3.9% and up 52.6% so far in 2021. It has been quite the spectacular recovery from 2020 when oil was the worst performer. Rising oil prices which negatively impacts anywhere from gasoline to heating oil and other refined products are raising the fears of out-of-control inflation.
However, OPEC is potentially preparing production hikes and Iran is already in the game as they are selling oil to China despite U.S. sanctions. The rise in oil prices this past week extended into natural gas and the energy stocks as well. Natural gas (NG) gained 9.7% to $3.52 and new 52-week highs as well. NG is up 38.6% so far in 2021. The Arca Oil & Gas Index (XOI) rose 7.8% while the TSX Energy Index (TEN) was up 5.4%. Neither index made fresh 52-week highs. Gains on the year are 48.4% for the XOI and 55.9% for the TEN. They have been the best-performing sub-indices.
With an RSI now over 70 WTI oil is overbought. But overbought is just a state, a warning. It does not necessarily mean that a top is in. WTI oil is fast approaching the high of October 2018 at $76.90. That should act as a resistance zone. One would have to go back to 2014 to find WTI oil prices higher than that. Given the steep rise, only a move back under $70 would suggest that a possible top is in. A breakdown under $67 would confirm that a top is in.
The energy stock indices fell just short of making fresh 52-week highs. That could happen this coming week. The breakdown for the XOI is under 1,100 and for the TEN under 133 and under 129. Otherwise, the trend is up and both appear poised to go higher.
Oil production remains below pre-pandemic levels and, despite some uptick in demand, no one is expecting a return to 2019 levels any time soon. As the price moves higher, shale and oil sands oil start to become more possible. However, Saudi Arabia with considerable slack in production has the room and wherewithal to help keep a lid on prices and even push them lower to help market share.
Copyright David Chapman, 2021
|
Charts and commentary by David Chapman Chief Strategist, Enriched Investing Inc. Phone: 416-523-5454 Email: david@davidchapman.com dchapman@enrichedinvesting.com Twitter: @Davcha12 June 28, 2021 |
Disclaimer
|
GLOSSARY Trends Daily – Short-term trend (For swing traders) Weekly – Intermediate-term trend (For long-term trend followers) Monthly – Long-term secular trend (For long-term trend followers) Up – The trend is up. Down – The trend is down Neutral – Indicators are mostly neutral. A trend change might be in the offing. Weak – The trend is still up or down but it is weakening. It is also a sign that the trend might change. Topping – Indicators are suggesting that while the trend remains up there are considerable signs that suggest that the market is topping. Bottoming – Indicators are suggesting that while the trend is down there are considerable signs that suggest that the market is bottoming. |
David Chapman is not a registered advisory service and is not an exempt market dealer (EMD) nor a licensed financial advisor. We do not and cannot give individualised market advice. David Chapman has worked in the financial industry for over 40 years including large financial corporations, banks, and investment dealers. The information in this newsletter is intended only for informational and educational purposes. It should not be considered a solicitation of an offer or sale of any security. Every effort is made to provide accurate and complete information. However, we cannot guarantee that there will be no errors. We make no claims, promises or guarantees about the accuracy, completeness, or adequacy of the contents of this commentary and expressly disclaim liability for errors and omissions in the contents of this commentary. David Chapman will always use his best efforts to ensure the accuracy and timeliness of all information. The reader assumes all risk when trading in securities and David Chapman advises consulting a licensed professional financial advisor before proceeding with any trade or idea presented in this newsletter. David Chapman may own shares in companies mentioned in this newsletter. We share our ideas and opinions for informational and educational purposes only and expect the reader to perform due diligence before considering a position in any security. That includes consulting with your own licensed professional financial advisor.
About the author


Website: https://www.enrichedinvesting.com
Disclaimer: David Chapman is not a registered advisory service and is not an exempt market dealer (EMD) nor a licensed financial advisor. We do not and cannot give individualised market advice. David Chapman has worked in the financial industry for over 40 years including large financial corporations, banks, and investment dealers. The information in this newsletter is intended only for informational and educational purposes. It should not be considered a solicitation of an offer or sale of any security. The reader assumes all risk when trading in securities and David Chapman advises consulting a licensed professional financial advisor before proceeding with any trade or idea presented in this newsletter. David Chapman may own shares in companies mentioned in this newsletter. We share our ideas and opinions for informational and educational purposes only and expect the reader to perform due diligence before considering a position in any security. That includes consulting with your own licensed professional financial advisor.