
- Soft Landing, RIP
- Mild and Brief
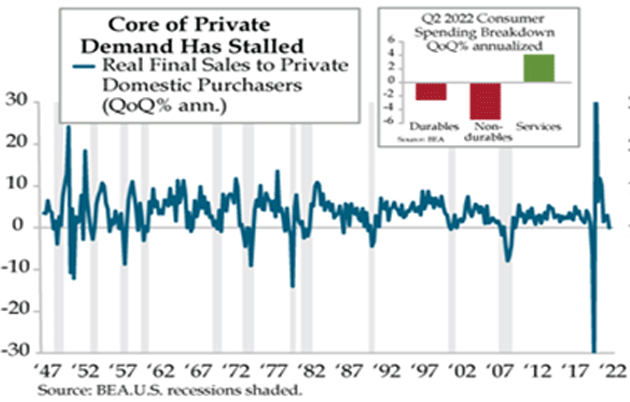
- Consumer Shift
- Longer and Deeper
- Productivity Problem
- Cleveland and British Columbia
Professional economists, perhaps tired of being asked, years ago formed a committee to officially mark the beginning and end of recessions, the NBER (Nation Bureau of Economic Research) committee considers a variety of data, but its final decision is subjective.
Many of those who pay attention prefer a more objective rule, such as “two consecutive quarters of declining Gross Domestic Product.” That’s as good as any, but of course GDP itself is a flawed statistic.
This week’s initial estimate for Q2 GDP, coming after a -1.6% decline in Q1, showed another -0.9% drop, both annualized. This was an advance estimate that will be revised, but there can be revisions years later as well.
While it’s likely we are already in an as-yet-undeclared recession, it’s a very weird one if so . I have lived through quite a few of them and I don’t recall any other recession coinciding with record-low unemployment, plentiful job openings, and jammed airports.
That said, recessions vary in depth and duration. Some recessions are deep and hard to escape. This chart from my friends at Bain Macro Trends Group shows recessions by depth since WW2.
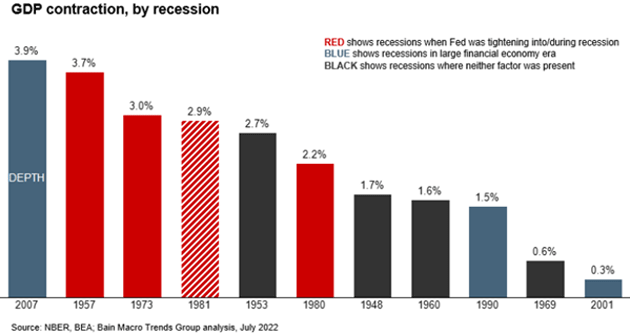
Source: Bain & Co.
Note that the recessions in red are when the Fed was actually tightening into or during a recession. Also, the chart shows the average for the entire recession, not the worst single quarter.
Whether the economy is in recession now or enters one soon, this isn’t the usual boom-bust pattern; it’s more of an intentional slowdown. The Federal Reserve needs to get inflation under control, which means reducing aggregate demand, which means higher interest rates.
But that’s not where we are. Consumer prices are climbing significantly faster than wages, including essentials like food and energy. Wages are rising, which ironically adds to inflation. The Fed has to “do something” to bring them down. Interest rates and bank liquidity are its only tools. It is therefore tightening both.
In theory Fed officials could do this without triggering recession. In practice, I don’t think they can avoid it, which makes the hoped-for “soft landing” unlikely. Even good friend Barry Ritholtz finally threw in the towel.
“For the first half of this year, I have steadfastly refused to join Club Recessionista . I have not believed we were already in a recession, and I was hopeful that a moderate Fed gradually raising rates to throttle inflation could execute that soft landing.
“No longer .
“As I mentioned to Tom Keene last week, Nick Timiraos in the Wall Street Journal revealed the Fed’s intention to raise rates 75 basis points brought a reckoning to my hopes of a non-recessionary growth slow down.
“A soft landing is now officially RIP .”
I was in the hard landing camp early on, as a Fed raising rates enough to fight 9% inflation is the stuff hard landings are made of. And there are plenty of signs this is happening.
Dave Rosenberg included this in his latest chartbook. It shows spikes in the food and energy portion of PCE typically coincide with recession. The current spike is the highest since 1980.
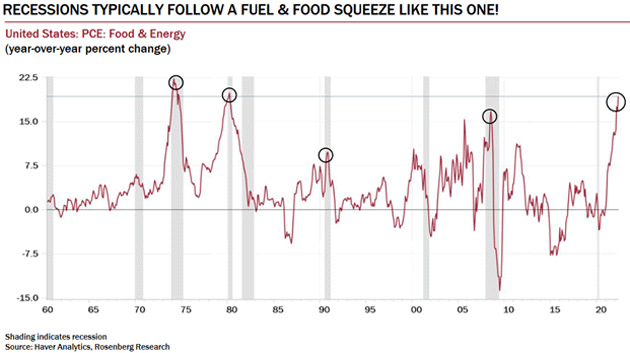
Source: Rosenberg Research
In all those cases, prices fell because rising unemployment and tighter Fed policy combined to reduce demand, which made prices fall. That isn’t yet happening this time. Why not? Maybe because monetary policy alone can’t reduce demand quickly enough. The Fed needs “help” in the form of mass layoffs that force large numbers of consumers to cut their spending. (Note heavy sarcasm.)
The labor market is softening slightly, but only from historically strong levels. Many employers still want to hire and can’t find qualified workers. We may not see the kind of cyclical unemployment that was normal in past recessions. That would point toward this one being milder than usual.
Here is the latest initial jobless claims data. We see a gentle rise in recent weeks, but it still leaves benefit claims about where they were in 2019.
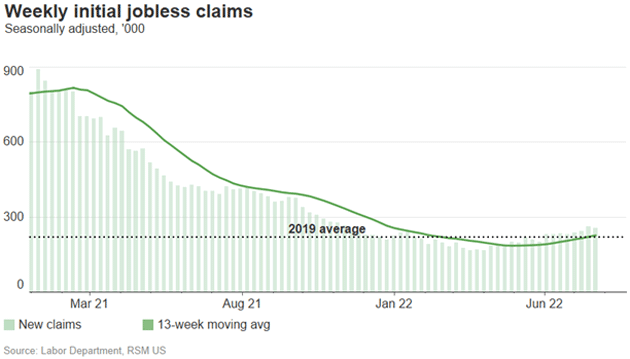
Source: RSM
Watch this data closely, as it will help determine the recession’s severity.
Let’s look at a very well-done analysis by my friend Doug Kass. He expects: a “mild and brief” recession. In a recent letter he cited a number of “buffers” he thinks will prevent a worse scenario. Among others…
- “The absence, in large part, of the sort of leveraged positions and segments of the economy that have characterized previous deep economic down cycles.
- Unlike 15 years ago, and in other previous economic downturns, our banking system is far less levered and has sizeable cushions of liquidity and capital.
- There is over $2 trillion of excess consumer savings.
- There is a cushion of sizeable unrealized/imbedded gains in the nation's housing stock and large unrealized gains in the US Stock Market.
- The US has a very strong industrial/corporate base that has generally improved their balance sheets by rolling over into inexpensive debt over the last five years, and that have maintained high profit margins.
- We have a robust and tight labor market—with solid wage increases a highlight of the last several years. Importantly in the last 60 years the US has never had a recession without a preceding spike in initial jobless claims.
- The US unemployment rate stands at 3.6%—the lowest level since the start of the pandemic and only 0.1% above the 50-year low of February, 2020.
- Some important components of inflation are moderating—the prices of most commodities have fallen considerably over the last 2 1/2 weeks.”
All good points but let me add a caveat. Things can be true in the aggregate but painfully different in specific cases. Yes, household savings are up, but not for everyone. Half the country has less than $400 in savings. One-bedroom apartment rents are near $1,500 in many places.
Ditto for businesses. The average company has a better balance sheet, but many aren’t average.
Consumer Shift
The real question mark here is consumer spending—how much it drops and how it drops. We are in the thick of earnings season and reports from retailers aren’t good. Walmart (WMT) is widely watched, not just by its own investors, but as a consumer health indicator. Its sheer size and national scope reveal a lot about the economy.
Walmart’s latest is partly unsurprising: People are spending more on food and fuel. The haunting part is they’re also spending less on things like apparel, furniture, and other non-essential goods. Worse, those happen to be the same goods that had been scarce due to supply chain snarls. Now that they’re finally on the shelves, people don’t want (or can’t afford) them. Retailers are overstocked and cutting prices on slow-moving goods even as they raise prices on others.
The bigger point here is that consumer preference is changing… again. Recall what happened with COVID: People shifted their discretionary spending from services to goods because the services were unavailable or perceived as risky.
Now the opposite is happening. Retailers are finally getting adapted to new demand patterns just as the demand goes away. Meanwhile airlines and vacation spots, which had suffered as so many people stayed close to home, are clogged with more customers than they can handle.
Consumer woes are also business woes. Bruce Mehlman summed it up with this from his latest slide deck.
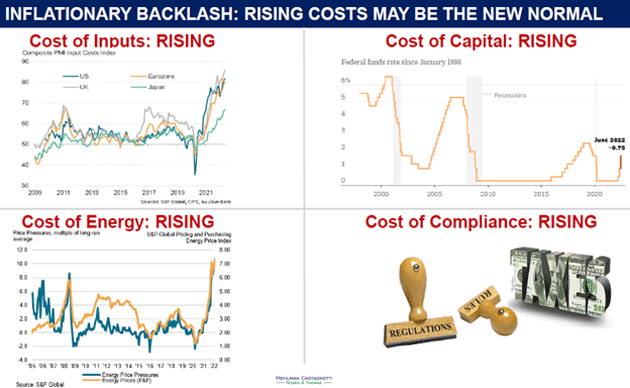
Source: Bruce Mehlman
All that looks bad, and it is, but keep it in perspective. Businesses can meet rising costs in several ways. The most common is to cut some other kind of less essential cost or try to shift it onto your suppliers. That’s harder than it used to be; many companies were already running pretty lean after going into COVID survival mode. This from Quill Intelligence:
Source: Quill Intelligence
Note the upper right box. Consumers are switching from goods to services.
As for squeezing suppliers… right now they’re happy just to have suppliers. I saw a story from Japan that Toyota is skipping its normal semiannual review and won’t press suppliers for lower prices. In some cases, it may actually pay more to make sure the essential suppliers stay in business.
The other alternatives are to raise selling prices—which can easily backfire when customers are already stretched—or accept lower profit margins. That looks increasingly likely for many companies. Coca-Cola, McDonald’s, Proctor & Gamble, and Kimberly-Clark are continuing to raise prices.
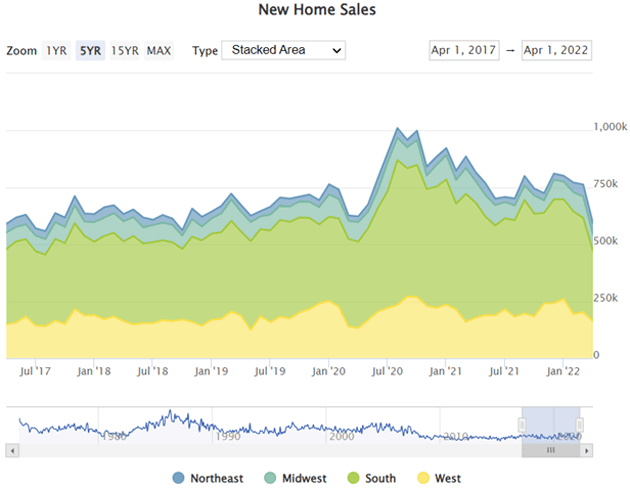
The worst-hit businesses will be those most exposed to higher interest rates on top of all the other rising prices. Yes, that means housing. That boom may not turn into a crash, but it has room to soften quite a bit, and seems to be in the early stages of doing so. It’s starting to show in both existing and new home sales.
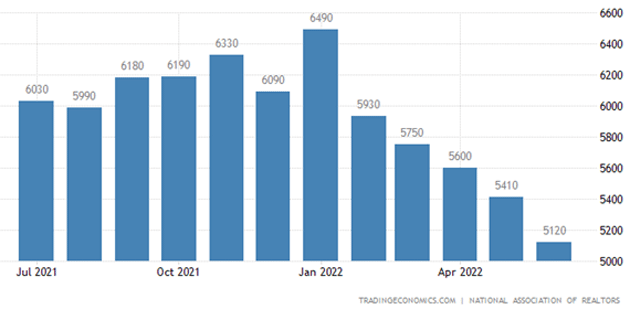
Source: Trading Economics
Source: Mortgage News Daily
And Pending Home Sales are plunging.
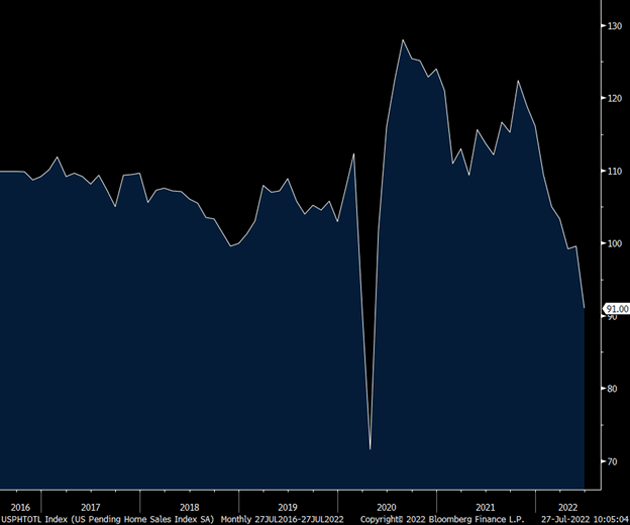
Source: Peter Boockvar
Note that housing drives many other segments like furniture, paint, appliances, etc. These also suffer when home sales drop.
All this is consistent with a mild recession scenario, which is what we seem to be experiencing so far. Consumer spending softer but not too much. Unemployment rising but mostly in financing-dependent segments like housing and autos. Energy prices are staying high, but people learn to manage them. None of this is good but it could be far worse.
Unfortunately, that not-so-bad near-term outlook collides with some broader forces that are still coming. It is likely that the third quarter will be even softer than the previous two, as the Fed will continue to raise rates at the next three meetings.
|
Today I spoke with economist and agriculture expert Dan Basse of AgResource . The discussion was more than I expected—the US and the world are facing serious food security issues. Dan goes into great detail during our discussion on:
|

Bain Macro Trends Group makes the case that this recession will be most like the 2007 recession. Here’s a bit from their longer report.
“As we discussed in the first piece in this series, the current macroeconomic climate bears a notable similarity to the climate preceding the recession of 2007–2009. This is also the only recession in recent history that resembles (in depth, duration, and pace) those of previous high-inflation eras in which the Fed tightened into the contraction (e.g., 1973 and 1981). As Figure 2 illustrates, the recessions of 1973, 1981, and 2007 are a cluster by themselves with respect to duration and severity. [Note: The 1981 recession is almost hidden in this cluster graph by the 1973 recession. It’s there.]
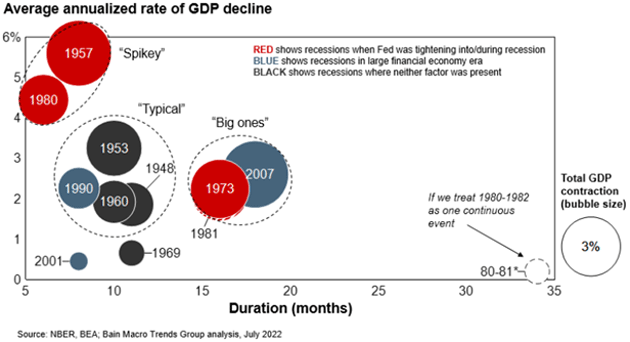
“Because of these similarities, we believe companies must take seriously the possibility that this recession may repeat key elements of the recession of 2007–2009.”
Investors are looking at the “dot plots” to see when the Fed might stop tightening and maybe even ease, as that would be a signal to buy. Maybe yes, maybe no. From David Rosenberg (flagged by Peter Boockvar):
"Remember this: The Fed went on hold in February 1989, and while there was a nice tradable rally, the reality is that the low in the equity market wasn't turned in until October 1990—twenty months after the pause. The Fed stopped tightening in May 2000, and the market low didn't come until October 2002, over two years later. And the Fed moved to the sidelines in June 2006, and the lows didn't come until March 2009." I'll add this, the Fed started cutting rates in January 2001 and the market bottomed in October 2002. The Fed started slashing rates in September 2007 and the market bottomed in March 2009.”
One final thought. We use GDP as a proxy for economic growth. What it really measures (with a lot of flaws) is output , or production. That’s the “P” in GDP: Gross Domestic Product .
At the most basic level, GDP is simply the number of workers a country has times the average worker’s output. That’s what we call productivity . A worker takes something—knowledge, building materials, whatever—and adds value by producing something new. Combine all that new value and you get GDP growth.
If you want more GDP, math says you need some combination of more workers and/or more per-worker productivity. Postwar US economic growth happened for both reasons, but mainly productivity growth.
With population growth slowing, GDP has been more dependent on productivity growth. This is becoming a problem. Edward Chancellor explained why in the interview I mentioned last week. Here’s another part I didn’t quote:
“By aggressively pursuing an inflation target of 2% and constantly living in horror of even the mildest form of deflation, they not only gave us the ultra-low interest rates with their unintended consequences in terms of the Everything Bubble. They also facilitated a misallocation of capital of epic proportions, they created an over-financialization of the economy and a rise in indebtedness. Putting all this together, they created and abetted an environment of low productivity growth.”
Businesses have an interest in making their workers as productive as possible. They do this in various ways, including skill training and labor-saving technology. That doesn’t have to mean fewer workers. If adding robots to your factory triples production without having to hire more people, it also triples productivity. That’s good; it keeps prices down and helps more jobs emerge elsewhere.
But as Chancellor says, the Fed’s persistently low interest rates discouraged this process. We see it in the data. The Bureau of Labor Statistics measures productivity quarterly. Here’s the beginning of their last report on June 2. (The next one is August 9, by the way.)
Nonfarm business sector labor productivity decreased 7.3 percent in the first quarter of 2022, the US Bureau of Labor Statistics reported today, as output decreased 2.3 percent and hours worked increased 5.4 percent. This is the largest decline in quarterly productivity since the third quarter of 1947, when the measure decreased 11.7 percent.
They’re talking about a quarter when GDP actually fell, so it’s no surprise output decreased. The surprise is that more work hours produced less output. That’s not how it should go. And that this was the worst since 1947 should concern us.
Here’s a slightly different view, again thanks to Dave Rosenberg. He illustrates the change in productivity growth on a per-hour basis. By that measure it’s the worst since 1982.
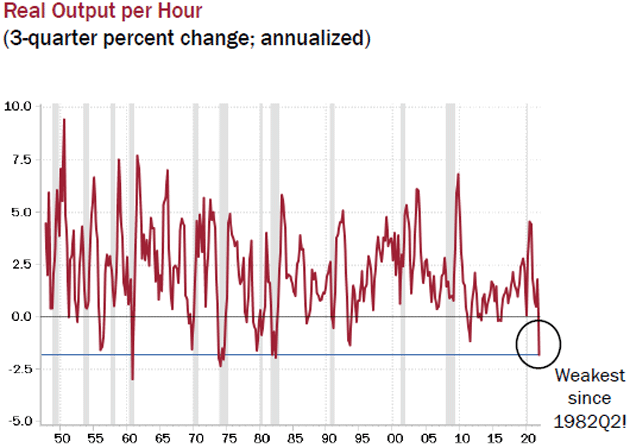
Source: Rosenberg Research
That’s a noisy chart but if you take out the last two recession spikes, it looks like productivity has been broadly declining since the mid-1990s. What might have caused that?
As they say, correlation isn’t necessarily causation. But it may be relevant that this is about when the “Greenspan Put” went from a novel surprise to something traders simply expected. The 1997 Asian debt crisis and 1998 Long-Term Capital Management bailout confirmed we had a new kind of Fed. So I think Chancellor is right to pin productivity declines on the Fed, at least in part.
Now, add in the demographic factors that are shrinking the workforce. And on top of that, add the not-insignificant number of pandemic-driven early retirements and “Long COVID” disabilities. That means we need more productivity from the remaining workforce.
This is looking like a challenge. United Airlines CEO Scott Kirby said in a recent interview that sickness-related absenteeism is now so high, he thinks airlines will have to permanently add 4%‒5% more workers just to accomplish the same amount of work. That’s staggering and, if correct, I see no reason to think it won’t apply in many other industries.
If a company now needs, for example, 105 workers to produce the same output that used to be possible with 100 workers, it is negative productivity growth. Not good for profits and certainly not good for GDP.
Could automation help? In some cases, probably so. But between microchip shortages and higher financing costs, that’s not getting any easier. Nor does it solve every industry’s problem. McDonald’s CEO Chris Kempczinski talked about automation on the company’s last earnings call.
“We’ve spent a lot of money, effort, looking at this. There is not going to be a silver bullet that goes and addresses this for the industry… The economics don’t pencil out.”
If any restaurant chain could make automation work, it would be McDonald’s. The CEO says it isn’t a silver bullet. That means his company—and many others—will stay dependent on human workers, who are on average getting less productive per hour worked.
Where does that lead? Nowhere good. I have faith our human ingenuity will find solutions, but meanwhile productivity is a giant problem.
It’s likely going to cap GDP growth at a level none of us will like—which is also what you would expect with the massive US debt load. Everywhere debt rises (Japan, pick a country in Europe, the US), GDP slows. Which is precisely what Lacy Hunt and I and others have been saying for years.
Looking back at the period between the 2008 crisis and COVID in 2020, we all wondered why GDP seemed stuck so low. That era’s sluggish growth wasn’t a recession, per se, but it was unlike past recoveries.
Now, I wonder if we’ll have a similarly extended period of even lower growth. After we get through this recession, GDP growth may slow to 1%. That would be a recession/recovery like no other in memory.
At the rate weird things are happening, I wouldn’t rule it out.
Cleveland and British Columbia
I’m scheduled to be at the Cleveland Clinic with Dr. Mike Roizen and team for at least two days in mid-August. They will check out my body doing every rude thing known to man: tubes, scopes, lasers, oh my. COVID delayed my check-up in 2020 so I’m overdue. My body feels it.
At the end of August, I get to check off one of my bucket list fantasies and go salmon fishing in British Columbia at a private camp, reachable only by helicopter. But the pictures look exciting. I’m looking forward to 40+-pound Chinook. I’m told they are catching nice-sized halibut at the same fishing holes. I’m not quite sure of the rules, but I hope to bring some flash-frozen fish home.
It's time to hit the send button. I left more good material on the cutting room floor this week than I have in a long time. There is really a lot more to say on this topic. Maybe next time.
Have a great week and spend some time with friends and family! And as always, don’t forget to follow me on Twitter!
Your wondering how weird this recession will really be analyst,

|
|
John Mauldin |

P.S. Want even more great analysis from my worldwide network? With Over My Shoulder you'll see some of the exclusive economic research that goes into my letters. Click here to learn more.
About the author
