
In the next fifteen months, it will be difficult to predict the pace of the rise of gold, silver, and copper, not the actual rise. I have been predicting gold price and silver price trends since 2004.
The most difficult year to predict will be 2027. We all know that gold price will trade over $2800-$3200 zone but predicting the pace of the rise or the pace of the fall is the key, not the actual price move.
Silver has two questions for 2027. (i) Will spot silver break and trade over $70.00? (ii) Will spot silver manage to trade over $36.00?
The good thing is that FOMO is not there for bullion, particularly silver. Retail FOMO buying or Retail FOMO selling creates price moves which is extreme.
Retail FOMO is there in copper for 2027 among all the actively traded metals. Fundamentally, there are no alternatives to copper and aluminum to meet every rising global electricity demand. Sodium-ion batteries are the future. It will impact demand for all metals except copper and aluminum.
Even the so-called expected global slowdown will reduce speculative longs but not the real demand in a big way. Every country needs to upgrade its electricity grid infrastructure to meet the demand of AI data centres and increasing per capital usage of electricity.
In spite of and despite all the crash (in gold and silver), I am bullish on bullion. The pace of rise could be very slow. Short-term speculators and punter interest could be less than the long-term average in bullion. However, every Tom, Dick, and Harry is waiting for a significant crash to increase investment in physical gold and physical silver.
MY PERFORMANCE IN 2026 – SELF ANALYSIS
I had predicted correctly the crash in gold and silver at the beginning of the year. Gold analysis was overall perfect.
In silver, I failed as I did not detect the crash below $50.00. In fact, I had invested in physical silver around $62.00. I failed to detect the silver price manipulation by JP Morgan and Deutsche Bank. India increasing customs duty on gold and silver and also banning silver imports were the reason for the silver crash. I had expected the world to ignore reduced Indian demand.
Instant betting website like Polymarket and Kalashi and their impact on bullion price was ignored by me. Retail money went to political betting on these instant betting websites and also to bullion price bets. The amount of money in Political betting for the US Senate election is unthinkable for this year. The trend started in 2026 of political betting is just the beginning and not the end. We need to look into the same seriously.
BACK TO 2026
This year, crude oil-induced inflation resulted in a very sharp rise in global bond yields and the inflation outlook. Bullion only enemy are a rising bond yield trend and interest rate hike outlook due to rising inflationary pressure.
Iran War and the losses suffered by the USA and its allies were a big surprise. Yet the US Dollar Index did not crash. Asian currencies sank to historical lows versus the US dollar. Crude futures zoned out, but WTI/Nymex failed to break $120.
Asian stock markets plunged (except South Korea and Japan) due to global focus on AI trade.
US President Donald Trump and his Republican Party have lost the US Senate elections. Trump, as president of the USA, has dictatorial powers; he can do a lot of things before Christmas.
Every country has witnessed mass protests, mass riots, and mass looting. Governments fell. Fear, police state, and anarchy are there in most countries.
2027 factors.
- Central banks will continue to increase gold reserves.
- European elections: France, Greece, Italy, and Poland are all important for bullion price and the US Dollar Index.
- In India, the state elections of Uttar Pradesh and Punjab will impact usd/inr and the style of functioning of the Modi government.
- An inverse correlation will be there between US bond yields and gold prices.
- Trend of AI stocks. The world is bullish on AI stocks for 2027 as well.
- Volatility will be very high in all asset classes due to rising geopolitical fear and change in political leadership.
- End of the Iran War. Any stalemate in the Iran war will increase inflation pressure, with phases of extreme volatility in industrial raw materials.
X FACTOR FOR 2027
- Interest rate hikes by the Federal Reserve and most central banks are already factored in by traders. If crude oil sees a sustained fall, then the theme will change to interest rate cuts.
- Crude oil price trend.
- More than two quarters of global slowdown.
- Food prices and cost of survival. In two years of Trump presidency, he has made sure that the masses do not even eat properly. Cost of survival is rising at an unthinkable pace.
- Hongkong and Singapore are in a competition to replace London for bullion storage and bullion trade.
- Trump is withdrawing all forms of customs duties on non-ferrous metal imports in the USA. This (if any) can case a short-term bearish phase.
|
24 MONTH SIMPLE MOVING AVERAGE |
||||
|
SPOT GOLD |
|
SPOT SILVER |
|
|
|
$3,772.74 |
|
$51.42 |
|
|
|
CME GOLD |
|
CME SILVER |
|
CME COPPER |
|
$3,776.49 |
|
$5,120.20 |
|
$530.10 |
|
|
|
|
|
|
|
LME COPPER |
|
LME ZINC |
|
LME ALUMINUM |
|
$11,360.10 |
|
$3,155.10 |
|
$2,889.30 |
The above prices are the key support or key resistance for the next twelve months.
BULLISH TREND WILL BE DEPENDENT ON THE ABILITY/INABILITY TO BREAK AND TRADE OVER THE ABOVE PRICE.
I am taking 2 years monthly simple moving average so that distortion are not there.
Period for MA: October 2024 to October 2026.
50 DAY SIMPLE MOVING AVERAGE VERSUS CLOSING PRICE – CME GOLD AND CME SILVER
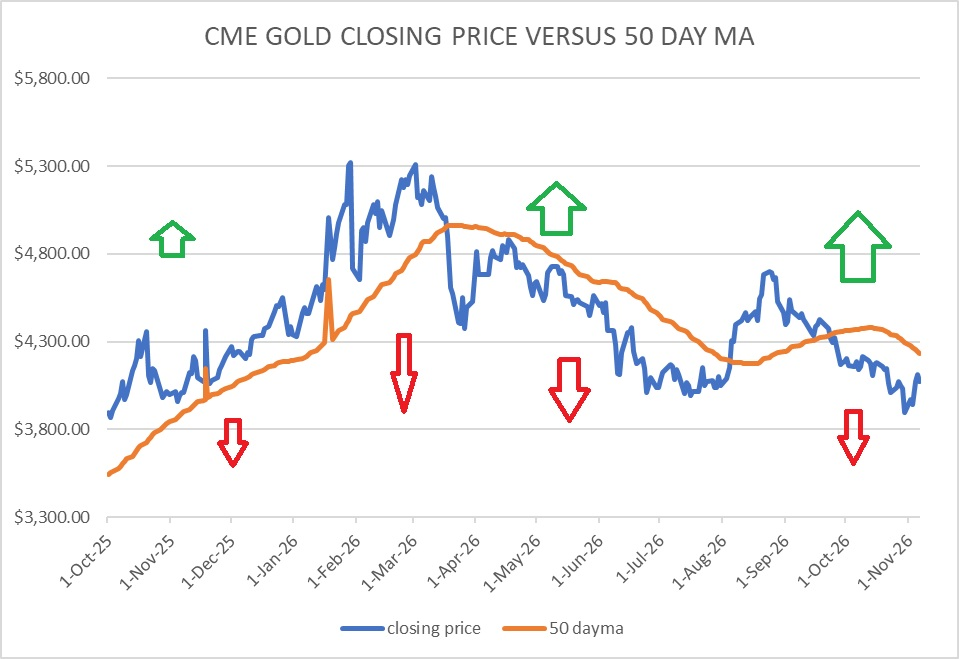

- CME gold has always moved into short term bearish phase whenever it has trades below 50 day simple moving average on daily closing basis for atleast a week.
- If we do not have the time as can compare 50 day ma versus closing price at the last trading day of the week to get an idea. However this is not a conclusive way to get the trend.
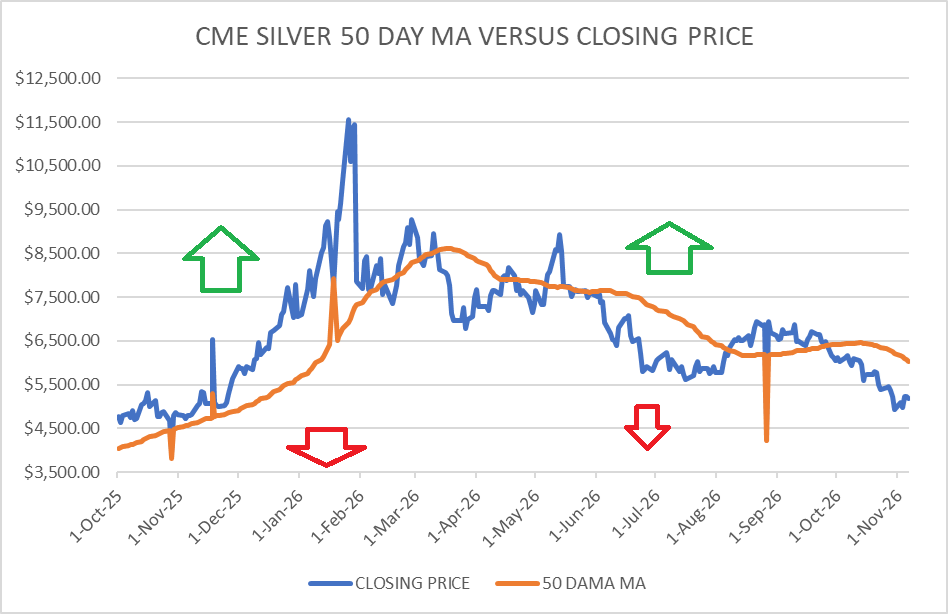
- Price wise silver has a bigger impact if daily closing price trades below 50 day simple ma for a sustained period of time.
- Silver daily closing price also takes a lot of time to trade over 50 day simple moving average. (as compared to gold.)
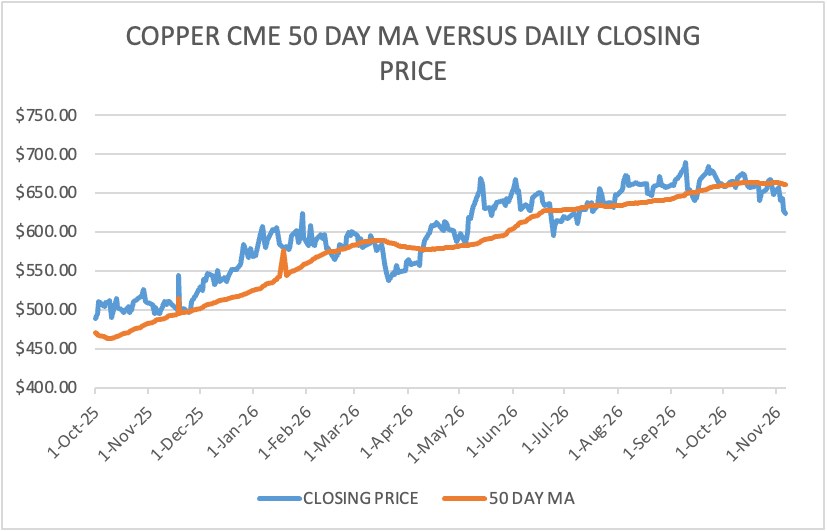
- CME copper daily closing price has mostly traded over 50 day simple moving average in the last twelve months.
- This is indicative of bullish trend and bullish sentiment in the world.
- In 2027, the price gap between 50 day ma and daily closing price will need a close watch. Any sustained convergence can spark an instant crash. This will be the biggest risk to short term bullish trend in copper.
200 VERSUS MA VERSUS DAILY CLOSING PRICE
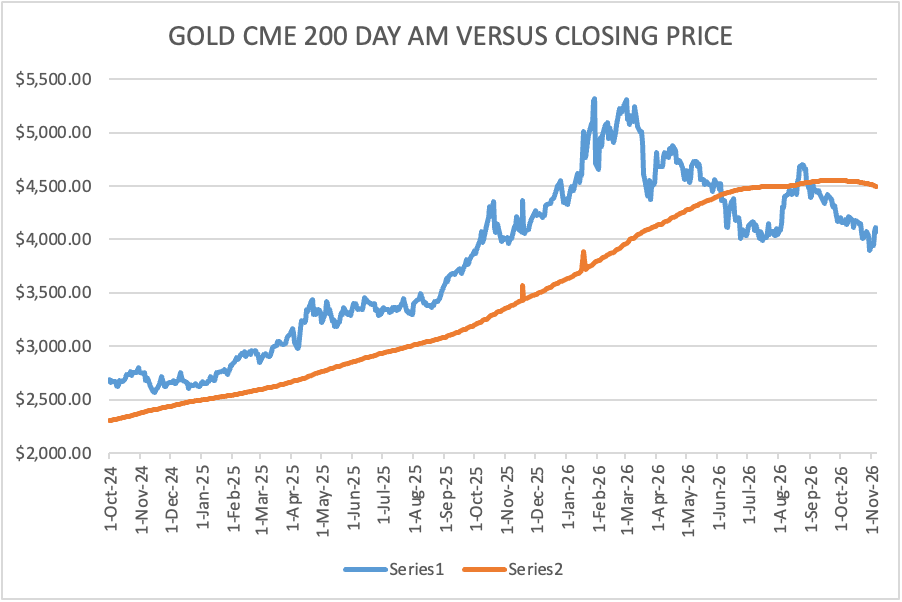
- CME GOLD NEAR-DATED FUTURE CLOSING PRICE VERSUS THE 200-DAY SIMPLE MOVING AVERAGE.
- PERIOD: OCTOBER 2024 TO 6TH NOVEMBER 2026
- Bullish trend is there as long as gold price trades above the 200-day simple moving average.
- The wider the gap, the better.
- Any convergence consistently indicates to close the long position, avoid investment, and look at other technicals for a short-term short-selling position.
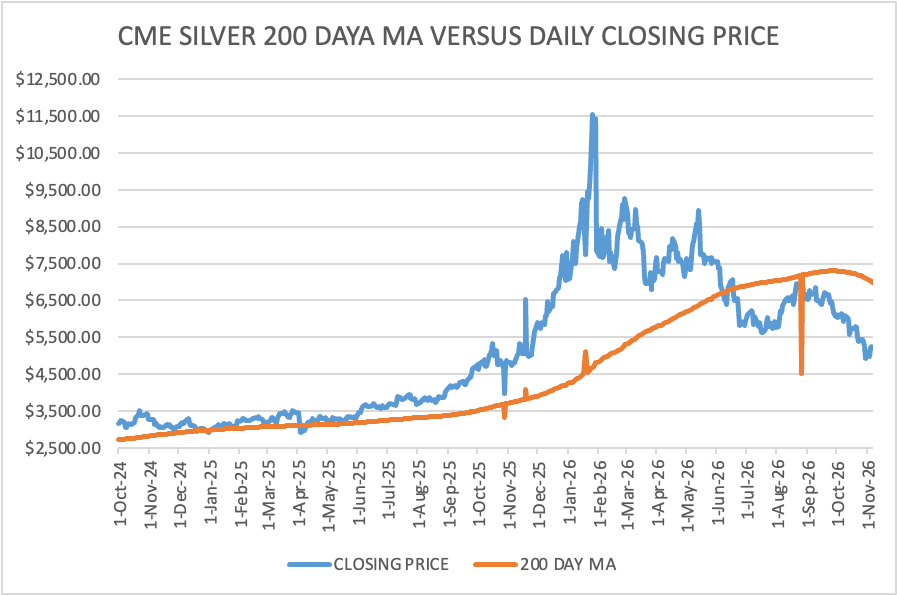
- CME SILVER NEAR-DATED FUTURE CLOSING PRICE VERSUS THE 200-DAY SIMPLE MOVING AVERAGE.
- PERIOD: OCTOBER 2024 TO 6TH NOVEMBER 2026
- Silver crashes more when there is a divergence between the 200-day simple ma and the daily closing price.
- It is better to close long positions if silver's daily closing price converges with the 200-day simple MA.
- Short selling strategy needs to be combined with momentum indicators and other technical.
I personally use the 600-day simple moving average (of the past six hundred trading sessions) versus the daily closing price to decide on my long-term investment strategy. I believe that for any investment, if the price trades below the 600-day simple moving average, then it is backed by weak fundamentals and very short sellers rule it.
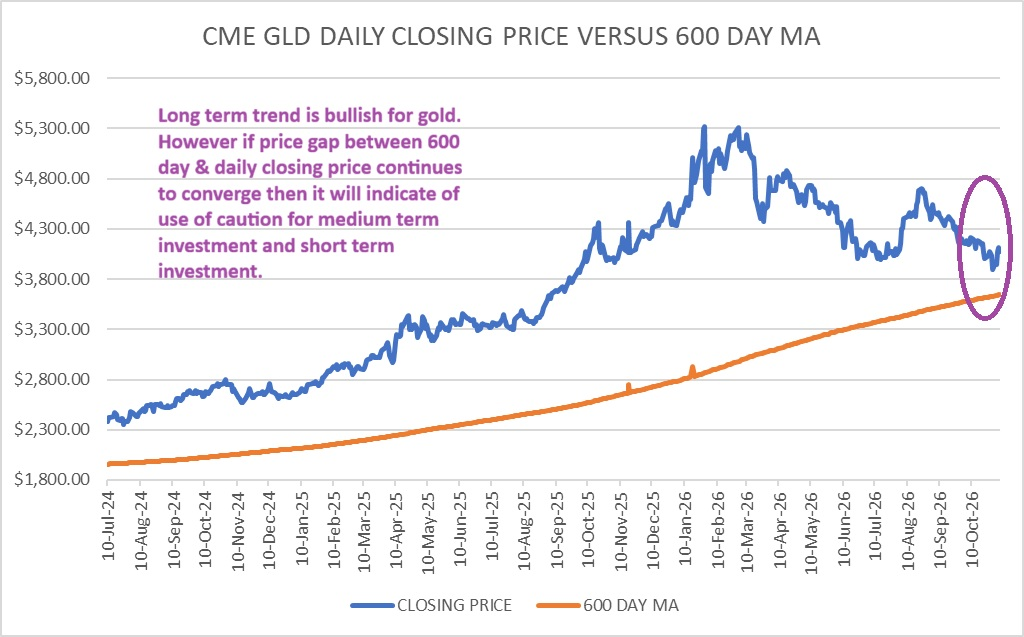
- CME GOLD NEAR-DATED FUTURE CLOSING PRICE VERSUS THE 600-DAY SIMPLE MOVING AVERAGE.
- PEROID: 10th JULY 2024 TO 6TH NOVEMBER 2026
- The convergence in October 2026 till 6th November 2026 needs close watching for the rest of 2026. If price continues to converge daily by $2-$3 continuously for two weeks to three weeks, then the chance of a long-term technical breakdown will be very high. (ignoring other factors).
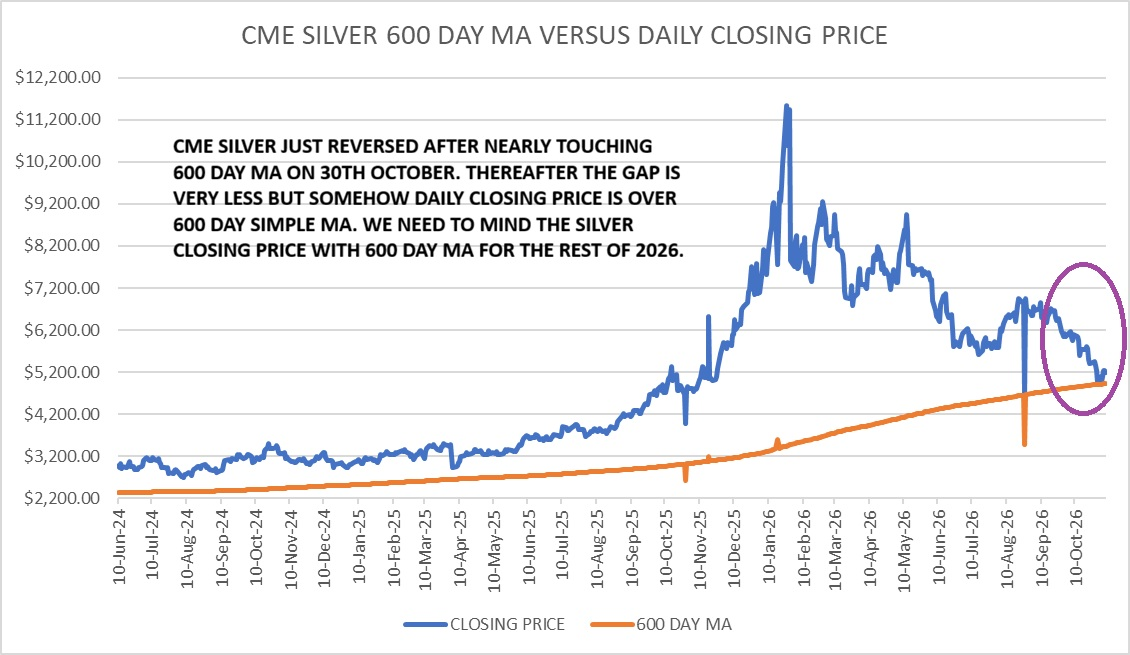
- CME SILVER NEAR-DATED FUTURE CLOSING PRICE VERSUS THE 600-DAY SIMPLE MOVING AVERAGE.
- PEROID: 10th JULY 2024 TO 6TH NOVEMBER 2026
- The convergence in October 2026 till 6th November 2026 needs close watching for the rest of the 2026. If price continues to converge daily even $2-$3 continuously for two weeks to three weeks then chance of a long-term technical breakdown will be very high. (ignoring other factors).
- A daily closing price with the 600-day MA needs to show a rising trend for at least four continuous weeks for a FOMO rally. If not, then the long-term price trend will move in an unpredictable fashion.
MY VERDICT OR MY PRICE FORECAST FOR 2027
China's central bank, the People's Bank of China (PBOC), added 830,000 ounces (approximately 25.8 metric tonnes) of gold to its reserves in October. This purchase marks the 24th consecutive month of official gold accumulation by China. The PBOC accelerated its buying pace during the October month making it the largest single-month increase in its reserves in over three years.
China has been the largest accumulator of physical gold among all central banks since 2003. China had stopped its gold production numbers. China is anti- USA and anti -NATO. Trump could not bully China partly due to its vast gold reserves.
Trump 2.0 has accelerated gold buying among all central bank. Some had to sell gold this year to stabilize economy after Iran war. I am confident that selling central bank will rebuy gold once geopolitical risk subsides.
Gold for the long term. Less return, slightly negative return for a year or two does not change the bullish view for physical gold. One should not be bothered with the crash in gold price after January 2026. Patience, and I am sure decent bullish run on or from June 2027 onwards.
Silver: I'd better not comment. The trend of silver price from now till the first week of April next year is the key. Spot silver has to trade over $51.00 till first week of April next year to retest the 2026 highest price.
The world is bearish or not so bullish in silver prices for the next two years. Historically, silver price takes two years or more to test the last highest price whenever there is a crash of over fifty percent. Retail traders and retail investors will avoid investing in silver after this year's pump-and-dump price move.
Spot Gold
- 100 WEEK MA : $3882.20
- 50 MONTH MA: $2957.30
- 200 day ma: $4348.10
- 100% RETRACEMENT: $3683.20 AND $3245.50. (These are the long-term support.
- VIEW TILL END DECEMBER 2027: Spot gold has to trade over $3443.80 (till end December) on a daily closing basis to rise to $4689, $5386, and $5697 and more.
- A crash or sell-off or sustained bearish trend will be there if spot gold does not break $4689 by 31st March 2027.
- A daily close below the 100-week simple moving average of $3382.20 for ten consecutive trading sessions will be highly bearish for spot gold.
- Please treat gold as an investment (Two years to five years or more) and not to make fast money.
Spot Silver
- 100 WEEK MA: $53.40
- 50 MONTH MA: $39.40
- 50 MONTH MA: $39.60
- 100% RETRACEMENT: $38.07 & $45.54
- 200 day ma: $66.21
- 100 day ma: $60.97
- VIEW TILL END DECEMBER 2027: Spot silver has to trade over $45.54 (till end December) on a daily closing basis to rise to $71.06, $82.91, and more.
- Crash or more sell off will be there if spot silver trades below $48.00 for three full weeks continuously.
- Spot silver will see a new wave of sell-off if it does not break the one-hundred-day simple MA of around $60.97 by the first week of March 2027 to $38.07 and more.
- Not an easy time for silver traders. The price trend till the first week of March 2027 is very crucial from a long-term trend perspective.
CONCLUSION
The world knows the technical support in gold and silver with every fall. They are hesitant or not so confident on the ability/inability to break the resistance.
Inflation, the interest rate cycle of the Federal Reserve, geopolitical shifts, and the respective expectations will increase volatility (from 2026 volatility levels)
Most of the forecasts by large hedge funds and the World Bank are not so bullish on bullion price for the next two years.
Gold will continue to find buyers on every fall of $300 or more till $2800.00. Short traders will short sell gold as long as gold does not show signs of a sustained break of $4600-$4700 levels.
The big question among silver investors is whether it will break $60.00 and trade over $60.00 for a long period of time. Lots of skepticism over the ability of spot silver to break $60.00 is there among traders as of now.
Personally, I am least bothered about my physical silver investment around $62.00. I am confident that my silver purchases around $62.00 will give a very good return in 2028, if not in 2027. I will continue with my monthly physical SIP investment. I also intend to average out my physical silver investment around $62.00 whenever I see a long-term bottom being formed.
US President Donald Trump moves after the losses in the US Senate election will decide the pace of rise or pace of fall in gold and silver.
Intraday traders can make very good profit in bullion trading in the next fifteen months. I am not sure for traders who invest for a two- to three-month time period.
Bearish trend in AI stocks (if any) in 2027 will be bullish for bullion as funds are rotated to bullion and Asian equities.
HAPPY DIWALI AND HAVE A GREAT YEAR AHEAD.
DISCLAIMER: The investment ideas provided are purely an independent viewpoint and are solely for collective learning and for academic interests. There is no commercial benefit accruing or deemed to accrue to me from providing such investment ideas.
The investment ideas shared here cannot be construed as investment advice or so. If any reader is acting on this advice, they are requested to apply their prudence and consult their financial advisor before acting on any of the recommendations made here. I am not responsible to anybody in the event of profits and losses (if any) upon acting on such advice.
I hope that our reader is aware about this well aware of the risk involved in trading in commodity derivative trading.
Disclosure: I trade in India's MCX commodity exchange. I have open positions in India's MCX commodity future. I do not trade in CME future or OTC spot gold and spot silver.
NOTES TO THE ABOVE REPORT
- ALL VIEWS ARE INTRADAY UNLESS OTHERWISE SPECIFIED
- Follow us on Twitter @chintankarnani
- PLEASE NOTE: HOLDS MEANS HOLDS ON DAILY CLOSING BASIS
- PLEASE USE APPROPRIATE STOP LOSSES ON INTRA DAY TRADES TO LIMIT LOSSES.
- THE TIME GIVEN IN THE REPORT IS THE TIME OF COMPLETION OF REPORT
- ALL PRICES/QUOTES IN THIS REPORT ARE IN US DOLLAR UNLESS OTHERWISE SPECIFED.
- ALL NEWS IS TAKEN FROM REUTERS NEWSWIRES.
- TECHNICAL ANALYSIS IS DONE FROM TRADINGVIEW SOFTWARE
About the author