
One week ago we herein opened with this query: “Is Gold’s near-term correction completed?” Given the yellow metal’s upside price action since then, we can now answer in the affirmative, (which for you WestPalmBeachers down there means “Yes”).
As for employing the word “Another” in this week’s title, ’twasn’t that long ago in milestone missive No. 700 (15 April 2023 with Gold then 2018) we wrote “Gold: The Next All-Time High is Nigh“, which of course obviously came to pass, indeed on 16 daily occasions since then. Now Gold is merely on go to do it again.
Our Mighty Metal settled at an All-Time Weekly Closing High yesterday (Friday) at 2420, just -29 points shy of the most recent All-Time Intra-Day High of 2449 this past 12 April. Further, given Gold’s “expected daily trading range” (per the website’s Market Ranges page) is 36 points, price is within such range of reasonably reaching above 2449 as soon as Monday, (just in case you’re scoring at home).
True, a week ago — at least technically — we were reserved about Gold’s then imminent direction, price having completed a perfect Golden Ratio retracement, from which at 2386 it swiftly sank in the new week to 2338. To wit as we penned in Wednesday’s Prescient Commentary: “…until the former clears … the Golden Ratio retracement … the recent near-term correction would technically remain in place…” But having then since risen higher still, there’s really not that much pricing congestion now between here (2420) and there (2449).
“And so the question becomes ‘How high is high?’, right mmb?“
That is a critical knowledge point there, Squire. To be sure, Gold has already surpassed our forecast high for this year upon achieving 2375 this past 09 April; (recall such prognosis having been made last 30 December in “Gold – We Conservatively Forecast 2375 for 2024’s High”).
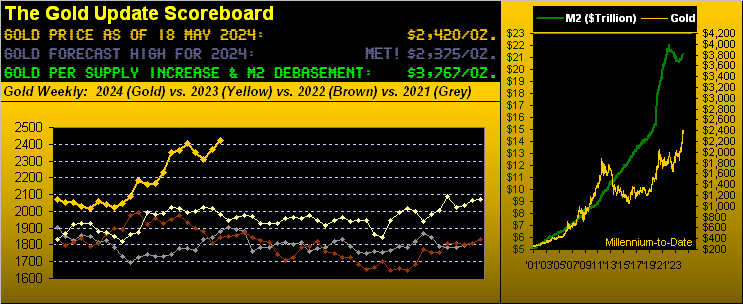
Yet to Squire’s query as to “How high is high?” — at least fundamentally — we can see per the opening Gold Scoreboard that by Dollar debasement (even accounting for the annual increase in the supply of Gold itself), we’ve the yellow metal’s value at 3767, or +56% above today’s “lowly” price at 2420.
But given this ceaseless Investing Age of Stoopid wherein — save for central/sovereign banks — Gold is considered “passé”, determining the inevitable “when” for 3767 (and beyond) is subjective. The art of designing Fibonacci retracements per our prior missive may be one thing: but, the art of future Fibonacci extensions we leave to you “seers” out there.
Either way, ’tis a pleasant gaze at the past via this view of Gold’s weekly bars from one year ago-to-date, again the rightmost nub being an All-Time Weekly Closing High. Indeed through these first 20 trading weeks of 2024, this past one ranks fifth-best by both points (+53) and percentage (+2.2%) gains. As for the more skeptical amongst you — and the price is arguably “too high” above the rising dashed regression trendline — we’ve again depicted the green-bounded 2247-2171 structural support zone, within which is the current “flip to Short” price of 2236. (But let’s not go there…)
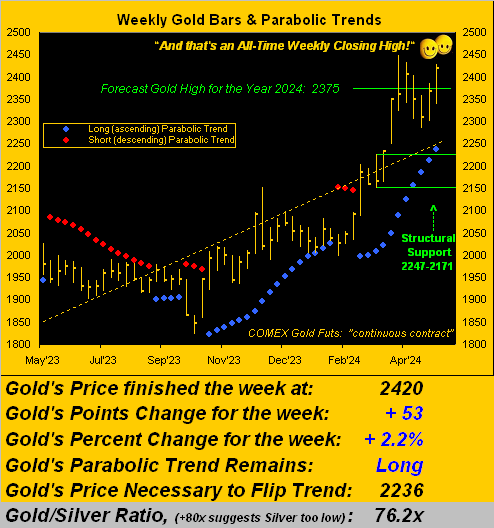
And no, that Gold/Silver ratio at the foot of the above graphic is not a typo: 76.2x champions Silver’s stellar week wherein price rose +3.27 points (+11.5%), the white metal’s best weekly gain by both measures since that ending 07 August 2020. ‘Tis why we oft quip: “Don’t forget Sister Silver!”
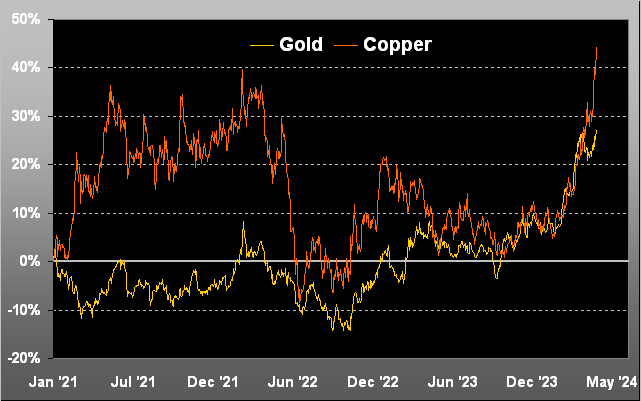
Whilst speaking of metals, surely you saw Copper having reached its own All-Time High at $5.128/pound this past Wednesday, which may give further boost toward Gold’s next All-Time High. For be it lore, or substantively more, ’tis said the red metal leads the yellow metal. Here are their respective daily percentage tracks decade-to-date: just one of those things that makes you go “Hmmmm…”
But next, we go to something guaranteed to make you go “Ugghh…”: the stagflating StateSide Economic Barometer. Its outright dump just in this past week is the worst for such stint since April a year ago. Moreover: for the nearly 26 calendar years that we’ve maintained the Econ Baro, such five-day fall ranks in the 99th percentile of worst plunges. Here’s the year-over year view:
‘Course, this can make Gold quite happy, for now the Federal Reserve must be forced to cut its Bank’s Funds rate … except that April’s just-reported inflation numbers belie that notion. First at the wholesale level (Producer Price Index) the 12-month summation is spot-on the Fed’s +2.0% target … except that April’s pace annualized was +6.0%. Second at the retail level (Consumer Price Index), it slowed by one percentage pip … except that the 12-month summation is well above target at +3.2% (and +3.7% core), with April alone annualized at +3.6%. And by now you well know the formula:
- Inflation + Shrinkage = Stagflation
“But mmb, is it really fair to say the economy is actually shrinking?“
As opposed to its growth merely slowing, Squire? We shan’t see the Bureau of Economic Analysis’ first read of Q2 Gross Domestic Product until late July. And already per their initial Q1 read, the annualized pace fell from +3.4% to just +1.6%. As well, the Conference Board’s “U.S. Leading Economic Index” (which we regularly quip is in fact “lagging” given the Econ Baro is always well ahead of it) has reported only one month of growth (for February of this year) since March of 2022(!) Is it any wonder the broad tilt of the above Baro is negative? No, ’tisn’t.
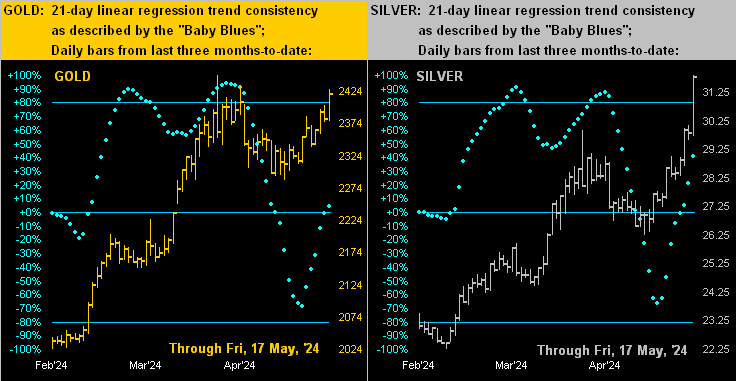
However, we sense what “is” is a fresh Gold high soon nigh. Let’s go to the two-panel graphic of Gold’s daily bars from three months ago-to-date on the left and same for Silver on the right. Therein per the baby blue dots of trend consistency, our thought is that present upside price momentum can pull the “Baby Blues” for both precious metals up above their respective +80% axes. Again, “Follow the Blues…”:
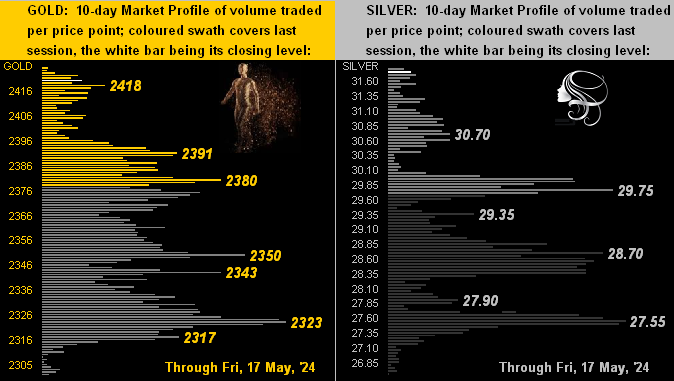
Also we’ve the two-panel graphic of the 10-day Market Profiles for Gold (below left) and Silver (below right). Whether marching or looking up toward higher highs, ’tis what our analysis implies:
Let’s wrap with our assessment of Q1 Earnings Season. As just ended “by the calendar”, for the S&P 500 — which also set a record high on Thursday at 5325 — we count 439 constituents having reported. Of those, 64% improved their bottom lines over Q1 of a year ago, (meaning that 36% did not so do). Excluding the four COVID quarters of 2020, the average year-over-year improvement runs ’round 69%: thus this past Earnings Season might be couched as rather sub-par. Yet upon its start back on 08 April, the S&P was 5204 and its “live” price/earnings ratio 46.1x. Today they are respectively 5303 and 39.9x: so some relative progress was made there in getting the p/e down a bit. Yet by any historical yardstick — especially in this positive interest rate environment — the p/e of 39.9x remains treacherously (understatement) high.
‘Course, ’tis made all the more complicated by this, (hat-tip Hedgeye’s hilarious Bob Rich):
So goodness gracious, with a new high nigh, stay gripped to Gold … and Silver bold!
Cheers!
…m…
About the author
