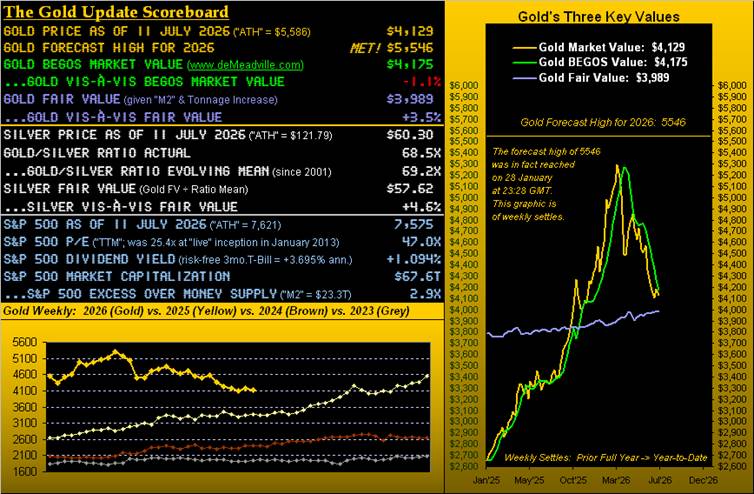
We commence with this week-ago sentence:
“Let’s see if near-term Gold tests its mid-panel high at 4404 and that for Silver at 71.65.”
Now a week on, Gold has traded no higher than 4216 before dropping to 4033 in settling yesterday (Friday) at 4129. Similarly for Silver, she reached up to 63.73, then down to 57.61 for the week’s settle at 60.30
“So both of ’em are far below your near-term price ideas, eh mmb?”
So far that is correct, Squire. ‘Course as you well know, “near-term” is indicative of up to four if not six weeks, (“medium” being some three to six months, and “broadly” being a year and beyond). The current key is the near-term impetus remaining in place for the precious metals to further bounce.
For that, we straightaway go to our two-panel graphic of daily bars across the three last months for Gold on the left and for Silver on the right. And said impetus for higher levels are both metals’ rising “Baby Blues” of regression trend consistency. To be sure by the diagonal red trendlines, Gold and Silver remain in negative 21-day linear regression: but the rising blue dots are the leading indication that the downtrends are becoming less so, (which for you WestPalmBeachers down there means less steep), toward the trend rotating back to positive. Through 25+ years of testing, ’tis the rule rather than the exception:
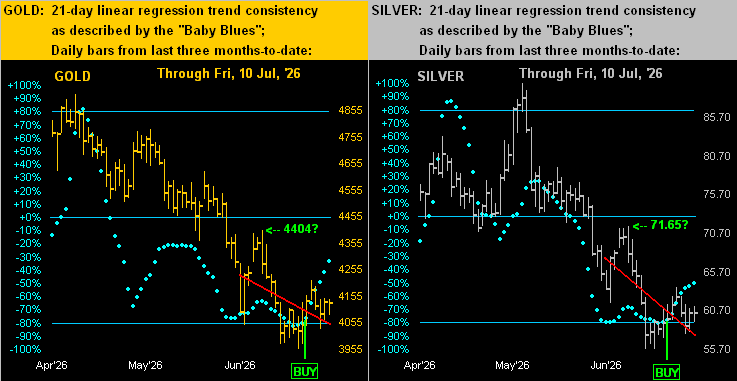
Thus as herein depicted a week ago, the “Baby Blues” signals to buy arrived upon the dots confirming having moved above their respective -80% axes. For those of you scoring at home, these buy points were for Gold per the open on 02 July at 4049, and for Silver a day earlier per her open on 01 July at July 59.25. Too, as above shown, we’ve placed an arrow for both near-term possibilities as stated. Yes: both metals are at present above their buy points. No: there’s not a lot of “grunt in the lump” (a little F1 lingo there meaning “power”)
For in the current day, war keeps getting in the way. And contrary to conventional wisdom — following Gold’s initial war spike back on 28 February when that day’s first trade gapped up +64 points (i.e. “Shorting Gold is a bad idea”) — attempts to further rise have occurred when the war has actually been cooling, only to further fall when actually re-heating.
In this case, the latter is perfectly in tune with the past week, the StateSide Executive Branch declaring termination of yet another USA/IRN “ceasefire”, upon which the metals resumed  “Southbound”
 –[The Allman Brothers Band, ’73].
Again, it all sounds backwards; however through recent years we’ve graphically demonstrated Gold’s tendency to “spike n’ plunge” with respect to geo-political events. Notably so is the case with this current war, as it affects the world’s economic engine known as Oil, for which the U.S. Dollar is tendered, the Buck thus getting the bid, in turn making Gold skid.
Regardless, as you long-time readers know, Gold plays no currency favourites. Rather, ’tis ultimately about the weight and purity. Hat-tip Cecil B. DeMille per recounting from the 13th century B.C. Dathan saying to Rameses II “But for ten talents of fine gold, I’ll give you the wealth of Egypt.” That equates to some $45M today. ‘Twas quite the bargain given the country’s GDP is now $430B.
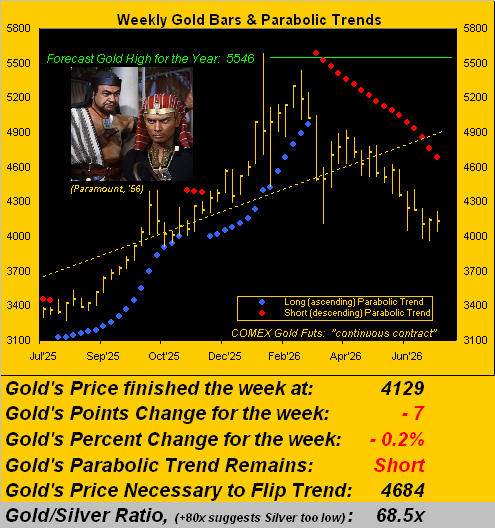
Either way, we segue to Gold’s weekly bars from one year ago-to-date, the red-dotted parabolic Short trend continuing to pound its way down. But “upon further review” price is significantly below the still-positive, dashed regression trendline, such that if the prior week’s low (3955) can hold, again we sense higher days near-term for Gold. You tell ’em, Yul:
“But if the Fed raises on the 29th, mmb?”
Indeed, Squire, ’tis just 13 trading days until the Federal Reserve’s Open Market Committee releases its next Policy Statement. As you well know — given the rampantly running inflation as we’ve herein depicted ad nauseam — we opine they really ought vote to raise the Bank’s Funds rate from the current 3.50%-3.75% range to 3.75%-4.00%. But there is banter about that because today’s inflation is more “supply-push” rather than “demand-pull”, ‘twould be better for the FOMC to sit on its hands. And should they so sit, then to higher prices Gold may swiftly commit.
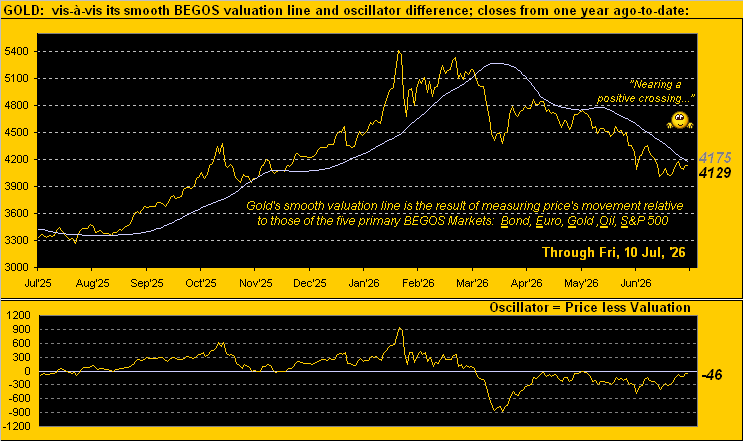
Also supportive of higher near-term Gold is price vis-à-vis its BEGOS Market Value. As we next see here by the day since this time last year, a positive crossover appears ever so near. Indicated as well in the opening Scoreboard, price is now just -46 points (-1.1%) below this method of valuation: and because Gold’s expected daily trading range is 109 points, confirmation of an upside cross could come as early as Monday’s settle. Century-to-date, there’ve been 240 upside crosses with an “average maximum” price increase during a signal’s life of +4.3%: in that vacuum alone from here, Gold would reach 4300 in as soon as two weeks. On verra…
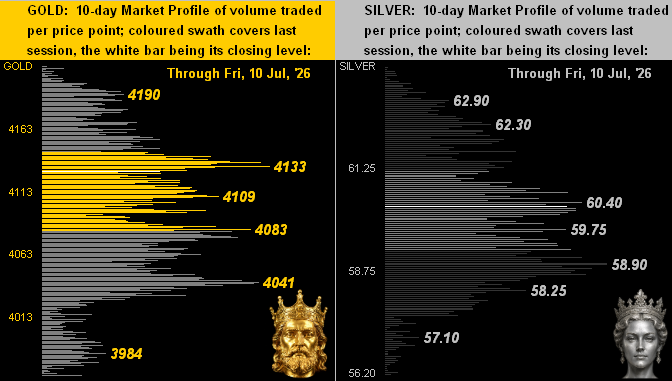
As to nearby support and resistance, here are the 10-day Market Profiles for Gold (below left) and for Silver (below right). Both metals have come off their recent lows and are fairly profile-centered, the volume-dominant trading apices as labeled:
With respect to the aforementioned Fed, as well as the StateSide economy and the “so-overvalued-that-we’ve-run-out-of-adjectives” S&P 500, let’s turn to the Economic Barometer from a year ago-to-date. Emphasizing that we merely do the math, we at times have to laugh. To wit this from the “They’re Just Figuring This Out Now? Dept.”: a popular FinMedia-favoured market strategist stated this past week that the economy is positively “turning a corner”. To be honest, it actually “turned the corner” literally one year ago to this date per the leftmost first pixel print of the Baro’s blue line, from which clearly the trend has been mostly upward, albeit (as we’ve been herein saying) slowing a bit from June onward:
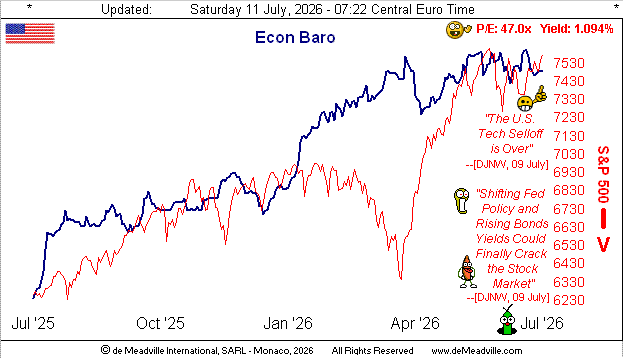
And yes, those two embedded Dow Jones Newswires headlines came displayed online one right after the other: even the FinMedia is hedging! Let’s see how next week’s incoming load of 18 Econ Baro metrics — plus Q2 financial entities’ earnings — plus the on-again off-again on-again war — affect it all. As for our recently math-measured case for a -10% correction in the S&P 500, instead, the mighty Index now at 7575 is within a day’s trading range of another record high, which would be above 7616. (No, we’re not shelving our -10% correction notion).
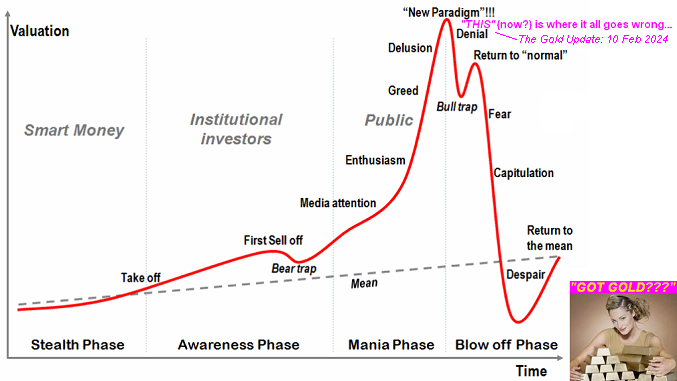
Which puts us in mind of this classic graphic included in The Gold Update of 10 February 2024, the S&P 500 then -34% lower than ’tis today. (Yes, really). Why re-post it now as ’twas then, rather than update it? Because the theorized “stock market” red line would be well above the chart’s available frame space:
“Very funny, mmb, yeah I remember it…”
Squire, we also remember this from the same missive as regards the price/earnings ratio of the S&P:
- The day before the Garzarelli Crash of ’87 the P/E was 20.3x;
- The day before commencement of the DotComBomb of ’00-’02 the P/E was 29.3x;
- The day before the start of the FinCrisis of ’07-’09, the P/E was 18.7x.
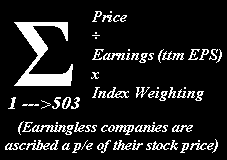
Today (per the opening Scoreboard) the S&P 500’s P/E is 47.0x. “Whoopsie!”
Just do the math yourself, of which at times we’ve cited “AI” (“Assembled Inaccuracy”) is incapable:
Indeed, Got Gold?”
Cheers!
…m…
www.TheGoldUpdate.com
www.deMeadville.com
and now on “X”: @deMeadvillePro
deMeadville. Copyright Ⓒ 2010 - 2026. All Rights Reserved.
About the author