
First published on Seeking Alpha on Friday Sep 3, 2021:
On any day of the week, one is always able to find some ridiculous presentation by the media and market pundits as to why the market is moving.
For example, recently I saw the title “Stock futures tick higher with Biden infrastructure plan in doubt.” Let that sink in for a minute. Do you see how ridiculous and contradictory this sounds? Yet, I am quite certain some readers will comment below and provide us with the mental gymnastics needed in order to “splain” how this makes sense.
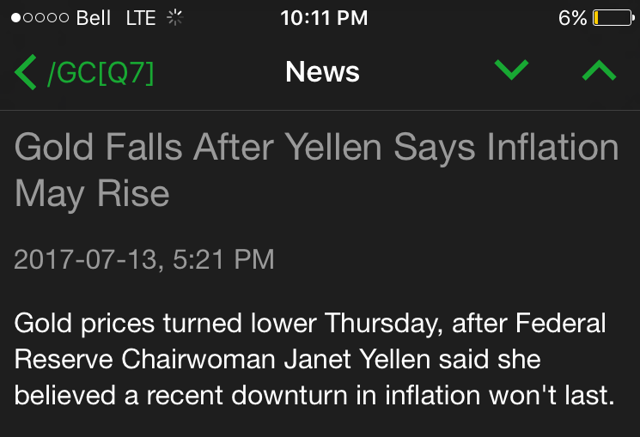
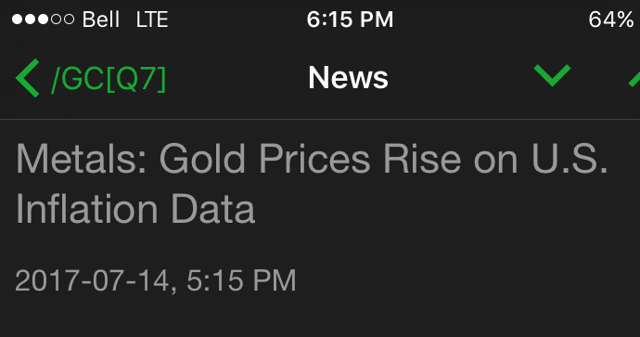
Next, I saw how the pundits blamed a $100+ gold decline upon the FDA providing emergency vaccine approval to battle COVID. Yet, when the same vaccine received full approval last week, gold rallied $25.
It actually reminds me of these two posts from several years ago which show how gold rose and declined within 24 hours after basically the exact same type of inflation news:
Yet, there are so many of you that rely upon this information to make your investment and trading decisions? That has always amazed me. But, I guess that is no different than most people today who make decisions based upon very superficial understandings of that upon which they decide.
As far as I am concerned, this market has been rather predictable and has rallied within our general expectations. As we came into 2021 and the market was at 3750SPX, most people thought that the market had gone too far too fast, and were certain of a bigger pullback. We heard calls of 10% pullbacks almost all year, if not calls for outright crashes. Yet, I was expecting at least a 20% rally in 2021, with a minimum target high of 4600SPX. We have now exceeded my 20% minimum and are now a stone’s throw away from 4600SPX.
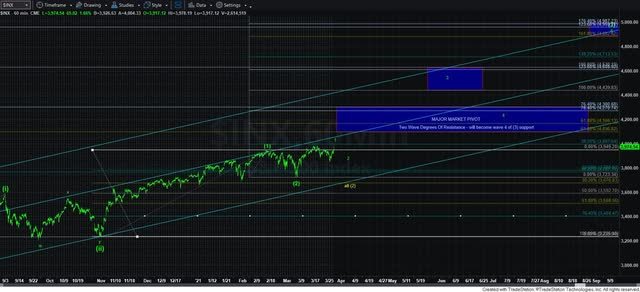
You can see my general expectations presented earlier this year from this chart, with my target box outlined between 4440-4600SPX many months ago:
In fact, at the end of last year, I explained to the members of ElliottWaveTrader.net that I saw a lot of similarities between the 2016-2017 market and the 2020-2021 market. Therefore, I expected that the market would provide us with a strong 2021 as well.
But, as of late, I have been reiterating my expectation for a 200-300 point pullback over the last month or two before we head to my next major target in the 4900-5000SPX region. Yet, as I said quite some time ago, I was unsure whether that pullback would be seen from the 4440SPX region or from the 4600SPX region. While I wish I can be certain about all my market calls, there is no such thing as certainty within this non-linear market.
For those who have tried to learn our Fibonacci Pinball method of Elliott Wave analysis, I will add a bit more of a detailed explanation. Once waves [1] and [2] within wave [iii] off the March 2020 low were in place, the market targets wave 3 of [3] between the 1.00 extension of waves [1] and [2], and the 1.236 extension of waves [1] and [2]. The 1.00 extension of waves [1] and [2] is 4440SPX (which is why I was confident we should at least see that target before a bigger pullback begins), with the 1.236 extension residing just north of the 4600SPX region.
While the market had a setup I outlined two weeks ago for the pullback I have wanted to see, it never triggered that setup, as it broke out over the resistance I outlined in my last update before it could trigger that downside setup. And, this is the main reason I strongly advise those willing to listen that it is not wise to short during a 3rd wave rally, as surprises tend to come to the upside during that rally phase.
Clearly, we're now within striking distance of 4600SPX. So, it would suggest that we could still see a 300 point pullback from the 4600SPX region. Should the market reach the 1.236 extension of waves [1] and [2] within the 4600SPX region, then the ideal target for the pullback is in the .764 extension of waves [1] and [2], which is the 4240-70SPX support region.
The most interesting point you may be able to glean from these expectations I have presented many months ago is that we really do not need the news to accurately follow the market. Have you taken note of how many people expected the market to decline due to the Delta variant, or for many other reasons being cited week after week? In fact, I got a chuckle yesterday when I heard a financial television newscaster proclaim the following about the market: “When you think about the world in which it has been performing, you would not expect it to have rallied as it has.”
Yet, we continue to follow the path laid out for us many months ago by Mr. Market.
Now, there is no question that I may be wrong about the pullback that I still think we can see before we continue to rally on to our next major target in the 4900-5000SPX region. And, if the market is able to strongly extend through the 4630SPX region in the coming weeks (without breaking back down below the 4520/50SPX region - which would become the new support), then that would be a strong signal that we are heading directly toward the 4900SPX region, and the 160-point pullback we got in mid-July was all we will see until 4900SPX. Clearly, that type of decline does not meet the standards we normally see, so that is not my expectation at this point in time. Yet, I need an objective perspective as to when my expectation for more of a pullback is simply wrong.
This is the main reason I strongly advise against shorting during a 3rd wave in a bull market. They are often strongly trending structures, and that is what we have seen since early March of this year. And, the only analysis methodology that I know of which can provide us such context for such market expectations is Elliott Wave analysis. In fact, I do not recall anyone else calling for 4600SPX as we came into this year at 3750SPX, with most analysts only recently following suit.
Again, I want to reiterate that my preference would be to see the market pull back down towards the 4240-70SPX support region in the coming weeks. Moreover, my next main target zone for the SPX is in the 4900-5000SPX region over approximately the next half a year. But, should we break out in a more direct fashion through 4630SPX, then the standard pullback I normally would expect from here is not likely going to be seen, and we will be on our way to our next target zone in a more direct fashion.
Now, I know there will be some foolish comment below claiming that I am saying that the market is either going to go up or down. But the market is not linear, therefore, we must approach it with a non-linear methodology. So, if anyone takes the time to read my analysis carefully, I simply provide to you an if/then analysis as to how the market will react, and I provide very specific levels and targets within such analysis. So, if you choose to take a very superficial view of my analysis, I would challenge you to find anyone who offers as specific a guidance as do I.
In the bigger picture, the market is bullish. I am still looking for a rally to the 5500-6000SPX region as we look out over the next two years, especially as long as we respect the major floor in the market between 4100-4165SP. But, I will warn you that as we move into 2022, the long side will not be as easy as we have seen since 2020. There will be much more volatility, but with an upward bias toward our long-term target. Yet, 2022 will likely see the largest pullbacks we have seen since we began this rally in 2020.
Many who have followed me through the years are probably asking how I can make such bold statements about the potential for future price action? Well, it’s based upon the same methodology that told me down in the 2200SPX region that we were about to embark on a rally to at least 4000SPX, with an ideal target in the 6000SPX region.
I know that many are still quite skeptical of our ability to accurately track markets using Fibonacci mathematics, as this person recently noted:
“I'm still skeptical about fibonacci pinball, Elliott waves and so forth, but it's an empirical fact that this man is able to call market tops and bottoms with surprising consistency.”
You see, our methodology simply ranks probabilistic market movements based upon the structure of the market price action, which we calculate based upon Fibonacci mathematics. But, even more importantly than providing us high probability turning points in the market, our analysis methodology tells us quite early on when our initial assessment is wrong. But here is the most important part of the analysis: We also provide you with an alternative perspective at the same time we provide you with our primary expectation, and let you know when to adopt that alternative perspective before it happens.
As I have said many times before, this is no different than if an army general were to draw up his primary battle plans, and, at the same time, also draws up a contingency plan in the event that his initial battle plans do not work in his favor. It is simply the manner in which the general prepares for battle. We prepare for market battle in the same manner.
So, while I will never be able to tell you with certainty how the market will move in the coming weeks, months, and years, I present you with enough information to know where my primary perspective is wrong so that you can adjust in order to take account for the alternative situation. And, until such time that the market proves our primary perspective is wrong, we will continue to follow our primary perspective, which at this time is pointing us to much higher levels in the coming years.
By now, I hope you recognize the difference in our analysis approach, other than the accuracy thereof. We strive to view the market, and utilize our mathematically based methodology, in the most objective fashion as possible, no matter how crazy it may sound. Moreover, it provides us with objective levels for targets and invalidation. So, when we are wrong in the minority of circumstances, we are able to adjust our course rather quickly, rather than fighting the market like many others you may read have been doing during this entire rally off the March 2020 lows.
So, while I hope I am helping many of you in maintaining an objective perspective within this non-linear environment we call the stock market, I want to wish you all well in your future trading and investment endeavors. As of now, I maintain my long-held expectation to see the market in the 6000SPX region in the coming years, of course, unless the market tells us otherwise. But, please approach the market with the respect that a bull market deserves, as surprises usually come to the upside, and we likely have much higher to go before this bull market ends.
Housekeeping Matters
I will not be writing as many public articles over the coming month as I will be observing the Jewish High Holidays. So, if you would like my thoughts during the coming month as we set up to rally to 5000SPX, feel free to join us at ElliottWaveTrader.net. And, to all that are also observing, I want to wish you and your families a happy and healthy new year.
Avi Gilburt is a widely followed Elliott Wave analyst and founder of ElliottWaveTrader.net, a live trading room featuring his analysis on the S&P 500, precious metals, oil & USD, plus a team of analysts covering a range of other markets.
About the author
