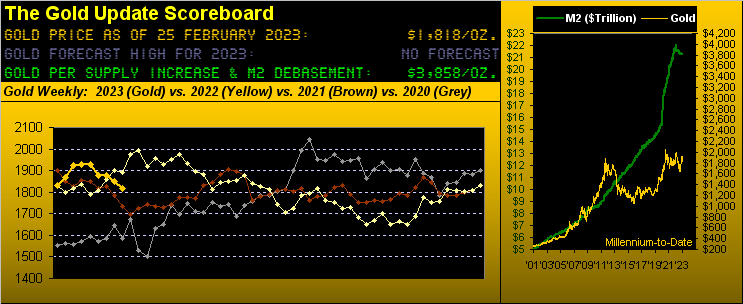
With but two trading days remaining to complete this year's second month -- a year which finds Gold repeatedly being hyped to the heavens -- price is actually now -0.7% for 2023 in settling out this past week yesterday (Friday) at 1818, not having had (as yet) an up year since 2020. Gold's rather demure mid-pack presence is seen here in our year-to-date standings of the BEGOS Markets:
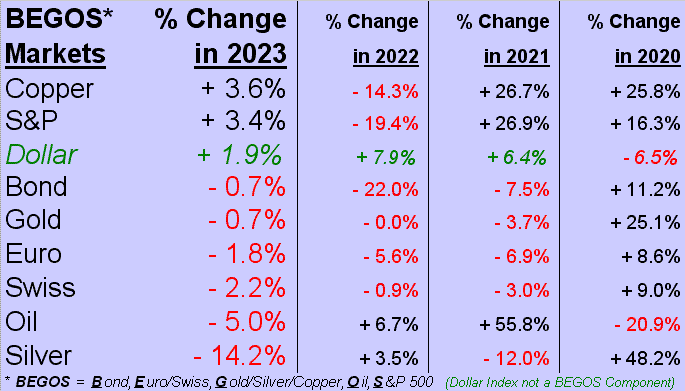
'Course, the monumental shocker therein is Silver, -14.2%: for with precious metal Gold essentially "unch" and industrial metal Copper leading the pack +3.6%, clearly we'd expect Silver to be somewhere between the two. But no! Instead, Sister Silver has shed both her precious metal pinstripes and her industrial metal jacket toward (temporarily) playing the role of an earningless "Me!-Me!" stock gone bad.
With a century-to-date average Gold/Silver ratio of 67.3x, 'tis at present 87.7x -- a four-month high -- and implicit at the average for a Silver price today +23% higher (than the present 20.74 level) at 27.00. Appropriately, let us cue The Who from back in '71: "I'd call that a bargain, the best I ever haaaaad..."
Gold, too, has a bargain hue. In turning to the yellow metal's weekly bars from a year ago-to-date, whilst all around are exuding red within the fresh parabolic’s Short stead, should support as noted hold (1851-1798), 'tis a bargain we behold. Or to reprise one of the fine quips from the late great Richard Russell: "There's never a bad time to buy Gold", especially when today at 1818 'tis trading at but 47% of the opening Gold Scoreboard's 3858 debasement valuation:
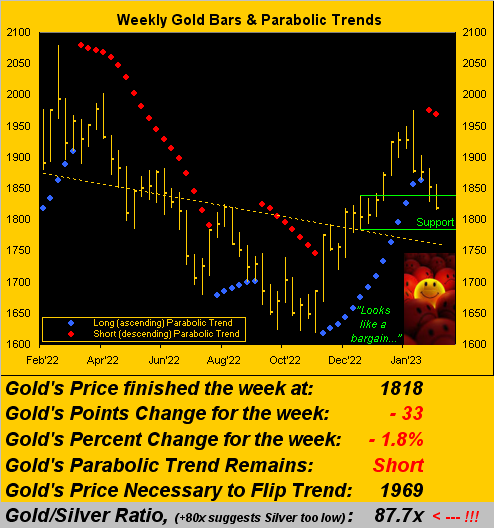
Yes, we remain realistic on this run for the lower 1700s (would support be thwart and the typical downside follow-through for this parabolic Short trend ensue). Yet should that eventuate, our sense for an All-Time High this year above 2089 further looks great ... if you've the common sense to have n' add Gold to your plate.
Oh to be sure, the "conventional wisdom" making the rounds is that Gold shan't rise as the Federal Reserve tightens its vise. 'Course you long-time readers are more the wise in thinking back to the three-year stint from 2004-2006 whilst as FedFunds rose from 1.00% to 5.25% Gold itself gained +59%. For the more they raise, the closer we come to an inevitable HQE ("hyper quantitative easing") phase; (see 2008-2009 when Gold then piled on another +31%).
"But as you call it, 'The Now' is not pretty, mmb..."
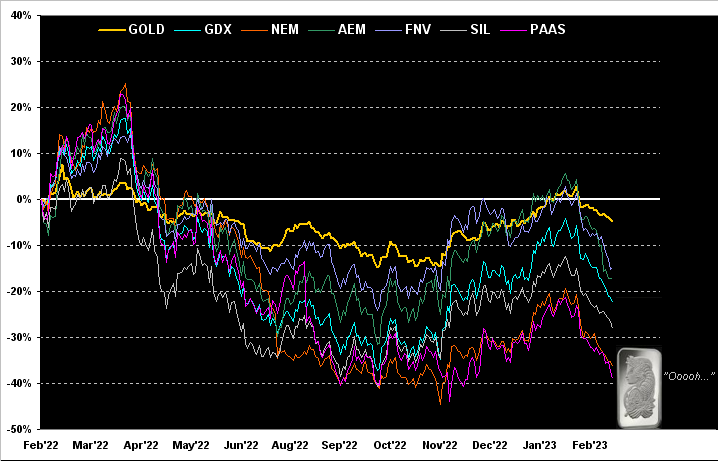
And yet, Squire, beauty (i.e. "bargain") is in the eye of the beholder, or better stated, in the brain of the bright. For as we go to Gold and several of its key equities brethren from one year ago-to-date, the rightmost declining percentage tracks may suggest one not wait. Regardless, here's the stance of each negative gait: Gold itself is -5%, Franco-Nevada (FNV) is -15%, Agnico Eagle Mines (AEM) is -17%, the VanEck Vectors Gold Miners exchange-traded fund (GDX) is -22%, the Global X Silver Miners exchange-traded fund (SIL) is -28%, Newmont (NEM) is -36% and Pan American Silver (PAAS) is -39%. (Pssst: and with respect to PAAS, its median "beta" to changes in Silver itself from 2001-to-date is 299%, i.e. basically triple: thus by the aforementioned Gold/Silver ratio, given Silver today "ought be" +23% higher than 'tis, we might too deduce PAAS "ought be" +69% higher ... just in case you're scoring at home):
Meanwhile from the "Ovation for Inflation Dept." comes the ever-recovering Economic Barometer. No doubt you took in Thursday's mild initial downside revision to Q4's StateSide annualized Gross Domestic Product from +2.9% to +2.7%, a Quarter for which the Econ Baro basically declined, (yes "hmmm..."). But then yesterday came January's Fed-favoured inflation gauge, wherein Core Personal Consumption Expenditure Prices after increasing +0.4% in December accelerated by 50% to +0.6%. Can you say "50 basis-points FedFunds increase on 22 March"? We think so. Here's the Baro:
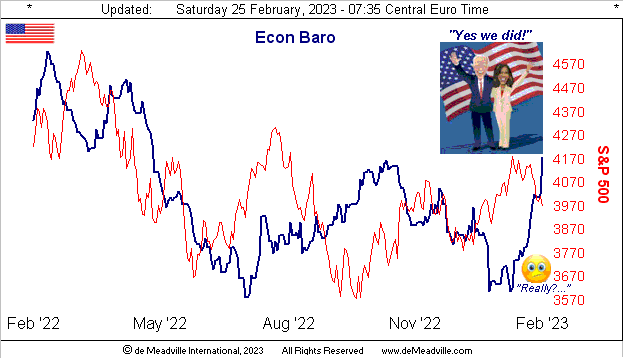
That noted however, recall a week back Richmond FedPrez Tom "Barkin'" Barkin's inference in sticking with 25 basis-point FedFunds increases, thus affording the private bank more flexibility, (i.e. rate increases to infinity or until the aforementioned "HQE" ... whichever comes first).
And obviously "HQE" shall come first per this EconCheck: Walmart -- the physical store where America buys everything -- is not expecting an optimistic 2023 per CFO John Rainey as the public’s liquidity ever tightens.
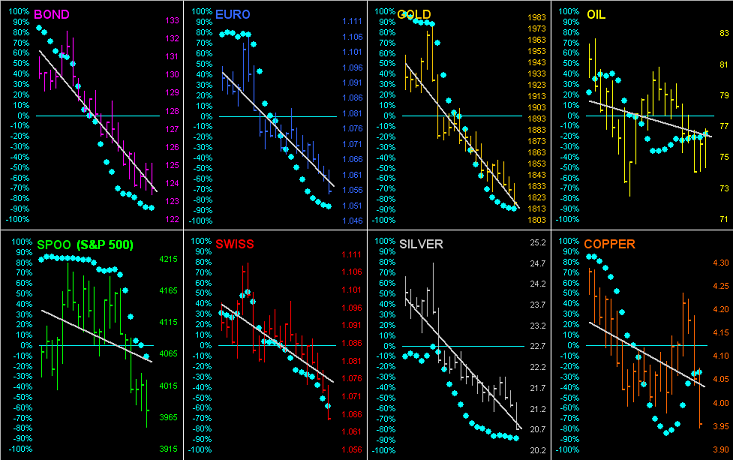
Neither optimistic are the near-term trends for any of our eight BEGOS Markets. Here we go 'round the horn for the whole bunch across the past 21 trading days (one month), the grey diagonal trend lines all in decline. Notably therein for the S&P 500 (lower left) the "Baby Blues" of trend consistency are accelerating to the downside. "Still got stock?" Ouch:
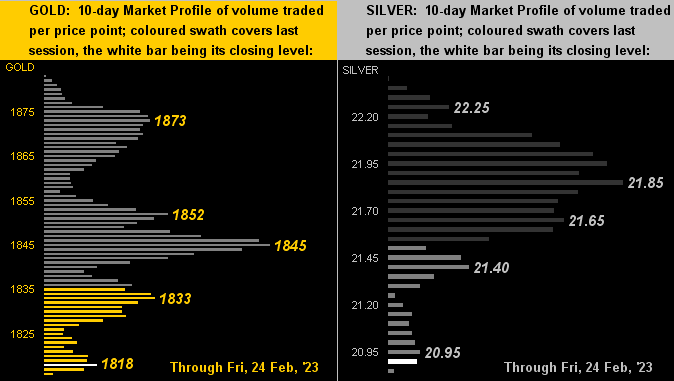
And "Double-Ouch" seems apropos for the precious metals as next we've their 10-day Market Profiles for Gold on the left and for Silver on the right. Yet as earlier mused, does cellar-dweller infer bargain basement? "Watch this space..."
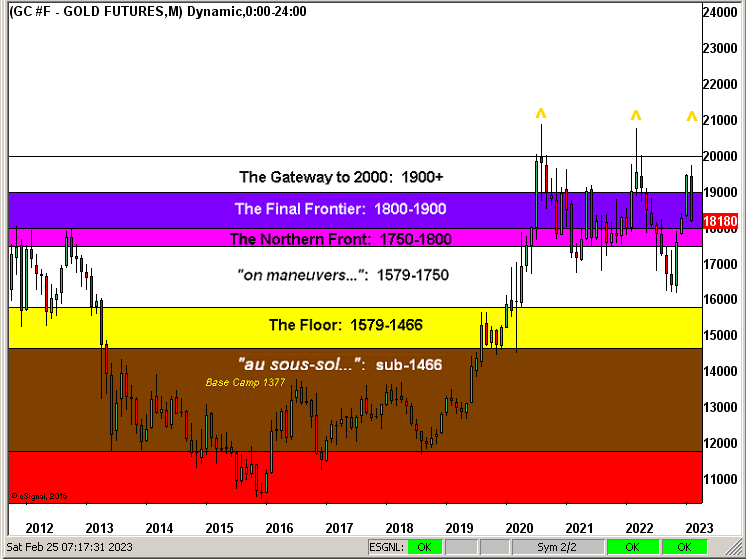
As for February being all but in the books, let's bring up Gold's Structure by the month across these past dozen years. Indeed Gold for the fourth consecutive calendar year is battling about in the three strata as labeled. Nonetheless, we've added three Gold "peak" markers, just to spice it all up with a little traders' lore, an expression you may well know: "Triple Tops are meant to be broken"; again we so think during this year:
We close with this from the "Depends Upon Who's Counting What Dept."
Bloomy reported this past week via their Markets Live (MLIV) Pulse Survey that a global query of 553 "investors" (however they may be defined) puts the "comfortable" retirement savings level in the $3M-to-$5M range ... so let's call it $4M. Naturally, we then checked various sources for the average StateSide retirement savings level at age 65, and the number comes in 'round $400k ... which is but 10% of what said "investors" opine as "comfort". Ex-Social Security (the age 65 maximum payout being $44k per year), from whence comes the other 90%? Or inclusive of SS for 10 years (i.e. $440,000 to age 75), from whence comes the remaining 78%? Perhaps one just keeps working well past 65 (don't suggest that to our neighbouring French friends), in which case one's SS payments are -- yes -- taxed! You can't make this stuff up.
At bargain prices, best to up one's holdings of Gold, and certainly Silver too!

Cheers!
...m...

