The big gold-ETF buying that catapulted gold higher into early August has gone missing in action. That’s why gold stalled out since, drifting sideways flirting with a correction. To continue powering higher, gold needs these major stock-market-capital inflows via exchange-traded funds to resume. The near-term fortunes for the precious-metals complex are heavily dependent on how American traders position in gold ETFs.
For better or worse, exchange-traded funds are increasingly dominating gold’s price trends. Their relative importance has been mounting for years, and cannot be overstated. Major gold ETFs are becoming the global gold market. Despite lingering concerns about gold ETFs’ physical bullion holdings, speculators and investors keep flocking to them. They are the easiest way to get gold portfolio exposure, quick and cheap.
The World Gold Council’s latest quarterly fundamental data on global gold supply and demand yet again revealed gold ETFs’ dominance. The WGC’s Q2’20 Gold Demand Trends report showed global demand being gobbled up by gold ETFs like Pac-Man! Gold surged 12.9% in Q2, which enjoyed one of the most-bullish psychological backdrops ever. A worldwide pandemic raged, which had just spawned a stock panic.
Last quarter uncertainty and worry were off the charts, as governments’ draconian national lockdowns to slow the spread of COVID-19 deeply scarred economies. You’d think gold demand would explode in that kind of extreme anomalous environment, right? According to the WGC, which gathers the best-available data on gold’s fundamentals, Q2 global demand was actually weak. It fell 10.7% YoY to 1015.7 metric tons!
Every major demand category collapsed except for gold ETFs. Jewelry demand, which is normally about half of the world total, crashed 52.5% YoY to 251.5t! Even traditional investment demand for physical bars and coins plummeted 32.0% YoY to 148.8t. Central-bank demand cratered 50.5% YoY to 114.7t. And technology demand plunged 17.5% YoY to 66.6t. Make no mistake, Q2 gold demand was a total disaster.
Added together these major demand categories imploded a mind-boggling 45.2% YoY to 581.6t! After accounting for 93% of total gold demand in Q2’19, they caved to just 57% in Q2’20. The sole bright spot in worldwide gold demand last quarter was gold-ETF buying. Stock traders’ demand for gold-ETF shares was so extreme that the physical gold bullion these ETFs had to buy skyrocketed 470.5% YoY to 434.1t!
Those towering gold-ETF-demand levels shattered the previous record high of 341.1t in Q1’16. There’s no doubt gold prices would’ve fallen hard last quarter if it wasn’t for that epic gold-ETF-share demand. And two American gold-ETF giants utterly dominate worldwide gold-ETF demand, the GLD SPDR Gold Shares and IAU iShares Gold Trust. Following their holdings is essential for gaming gold trends today.
Every quarter the WGC ranks the world’s biggest physically-backed gold ETFs by their bullion holdings. At the end of Q2, GLD and IAU commanded 32.5% and 12.6% of all the gold held by all the world’s gold ETFs! Their next-largest competitor trading in the UK is a distant third at just 6.3%. And GLD’s and IAU’s combined 45.1% world share actually understates their importance, because they are so actively traded.
From Q1’20 to Q2’20, total global gold-ETF holdings surged 13.7% sequentially to 3620.7 metric tons of physical gold bullion. That was a record 435.9t quarterly build. But the Q2 builds in GLD and IAU really outpaced the world total, seeing their holdings soar 21.9% or 211.9t and 16.6% or 64.9t. That massive 276.8t total from these two American behemoths was almost 64% of the entire global build in gold ETFs!
So gold demand and thus gold prices would’ve collapsed if not crashed last quarter if not for epic gold-ETF demand, and together GLD and IAU accounted for nearly 2/3rds of that. So everyone interested in the price trends of gold, silver, and their miners’ stocks have to closely watch GLD and IAU. The precious metals can’t materially rally without major inflows of stock-market capital into these increasingly-dominant ETFs.
The gold-ETF dynamics behind this are simple yet not widely understood. The mission of gold ETFs is to track the underlying gold price. But the supply of and demand for gold-ETF shares is independent of gold’s own. So when gold-ETF-share buying or selling outpaces or lags that in gold, ETF-share prices will decouple from gold’s and fail their tracking missions. There’s just one way to maintain that critical link.
Excess supply or demand of gold-ETF shares has to be directly shunted into underlying physical gold, on a near-real-time basis. That equalizes supply-demand differentials, synchronizing gold-ETF-share prices with gold’s. When ETF-share buying exceeds gold’s, share prices threaten to decouple from gold to the upside. Gold-ETF managers avert this by issuing enough new shares to offset that differential demand.
They immediately plow the capital raised from selling those shares into buying more physical gold bullion. So when gold ETFs’ holdings are rising, stock-market capital is flowing into gold. Naturally that normally helps lift its price. The opposite is true when gold-ETF shares are being sold faster than gold, which soon breaks gold ETFs’ gold-price mirroring to the downside. Again gold-ETF managers have to act to prevent this.
They sell enough gold bullion to raise sufficient money to buy back the excess gold-ETF-share supply. Thus when gold ETFs’ holdings are falling, stock-market capital is flowing back out of gold. Since GLD and IAU both report their physical-gold-bullion holdings daily, tracking their trends reveals whether American stock traders are buying or selling gold via these dominant ETFs. That’s the key to gold’s fortunes.
As this first chart shows, differential GLD and IAU buying has gone missing in action since gold peaked in early August. The gold price in red is rendered under GLD’s and IAU’s total daily holdings shown in dark blue, GLD’s daily holdings in light blue, and IAU’s daily holdings in yellow. Since IAU’s holdings are considerably smaller than GLD’s at 515.2t this week, they aren’t visible with this chart’s lower bound at 700t.
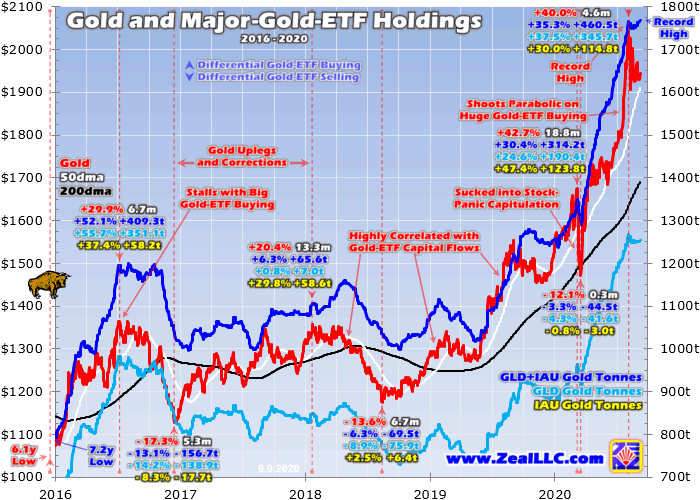
Since gold’s dazzling all-time-record high of $2062 on August 6th, it has drifted sideways to lower. At worst gold initially plunged 7.5% in a sharp correction. But that quickly stabilized into the trading range gold has been stuck in for the past 5 weeks, a high consolidation. Not surprisingly given GLD’s and IAU’s dominance over gold prices, their total holdings peaked at a record 1765.0t that same day gold crested.
Gold stalled out when American stock traders stopped aggressively buying gold-ETF shares. And if they start materially selling, gold will certainly fall into a 10%+ correction. So far the differential gold-ETF-share selling has been trivial, with these combined GLD and IAU holdings only slumping 0.9% at worst to 1749.2t in mid-August. Interestingly they gradually recovered since to a new record high of 1768.1t this week.
That masks a growing bifurcation in demand for GLD and IAU shares. As of the data cutoff for this essay at Wednesday’s close, GLD’s holdings are still down 1.2% from early August’s 7.4-year secular high. As the pioneering gold ETF launched way back in November 2004, GLD’s first-mover advantage has made it much more popular. In the middle of this week, GLD’s holdings commanded 71% of the GLD-plus-IAU total.
Lesser-hyped IAU wasn’t born much later, starting in January 2005. But it languished deep in GLD’s long shadow for much of its existence. When this secular gold bull’s first upleg topped in July 2016, GLD had holdings running 4.6x as large as IAU’s. But IAU has enjoyed superior growth since, compressing this ratio to just 2.4x this Wednesday. Since gold’s recent early-August peak, IAU’s holdings actually climbed 3.7%!
IAU is catching up with GLD because of a major selling point really appealing to institutional investors, a lower expense ratio. GLD’s managers have always charged 0.4% of that ETF’s assets annually to pay all the bills necessary to keep it running and earn profits. That includes salaries of the people as well as all the costs of physically moving and storing gold bullion. But IAU significantly undercut that charging only 0.25%.
IAU’s 15-basis-point-lower expense ratio doesn’t sound like much, but saving 37.5% on yearly gold-ETF fees is important to professional money managers running tens of billions of dollars. That realm is so hyper-competitive that they have to squeeze out returns wherever they can. They increasingly seem to be preferring IAU over GLD, driving the former’s holdings relentlessly higher with less volatility than the latter.
Given the chronic underinvestment in gold by institutional investors, which collectively have under 1% of their capital in this ultimate portfolio diversifier, IAU might not see heavy differential selling when gold corrects. But GLD certainly will, as it is much more popular with speculators and retail traders. If they start dumping gold-ETF shares faster than gold is being sold, that will almost certainly force a bigger gold selloff.
This secular gold bull has suffered three previous corrections, 17.3% into late 2016, 13.6% into mid-2018, and 12.1% into March 2020’s pandemic stock panic. American stock traders’ selling both helped fuel and exacerbated all these corrections, with the combined GLD and IAU holdings falling 13.1% or 156.7t, 6.3% or 69.5t, and 3.3% or 44.5t. It doesn’t take much gold-ETF differential selling to push gold sharply lower.
Potential catalysts abound that could spook the legions of speculators that flooded into gold-ETF shares in late July and early August forcing gold parabolic. The euphoric US stock markets could keep rallying on extreme Fed money printing, retarding gold investment demand. The deeply-oversold US dollar could surge, driven by the overbought euro falling. That would motivate gold-futures speculators to dump gold.
The US-presidential-election outcome could affect gold sentiment. Trump’s surprise victory four years ago unleashed heavy gold selling as stock markets soared on tax-cut hopes. The hot-money Robinhood crowd that loves chasing momentum may simply lose interest with gold stalled for over a month now. The herd of millennial traders is chasing big and fast gains, and is quick to move on to the next surging thing.
This gold bull’s precedent shows that once heavy differential gold-ETF-share buying flags, it generally presages coming differential selling. Traders who greedily rush into gold-ETF shares at relatively-high prices when euphoria runs rampant late in major gold uplegs rapidly suffer serious losses when gold subsequently corrects. These weak hands frantically dump their gold-ETF shares, amplifying gold’s selloffs.
But even if those late-to-the-party speculators hold, gold’s next major upleg can’t start marching higher. This bull’s precedent clearly proves gold now needs big stock-market-capital inflows via the dominant gold ETFs to fuel sustained gains! This gold bull’s four major uplegs have seen 29.9% gains into mid-2016, 20.4% into early 2018, 42.7% into early 2020 before the stock panic, and 40.0% in just 4.6 months since that.
Heavy differential demand for gold-ETF shares overwhelmingly drove this bull’s three largest uplegs, and contributed to the fourth. Sequentially they saw big combined GLD and IAU holdings builds of 52.1% or 409.3t, 6.3% or 65.6t, 30.4% or 314.2t, and 35.3% or 460.5t! Gold isn’t heading materially higher again until American stock traders resume buying gold-ETF shares much faster than gold itself is being bought.
And that seems really unlikely so soon after gold shot parabolic to extraordinarily-overbought levels in early August. That overboughtness and the resulting greedy, euphoric sentiment needs to be worked off in a normal and healthy correction before gold’s next upleg can start running. That will require a major 10%+ gold selloff, and maybe even a deeper 200dma approach. Gold isn’t out of the woods yet by any means.
The big gold-ETF buying that catapulted gold higher before and after March’s stock panic missing in action is also the reason gold-stock prices have stalled too. This next chart is updated from my essay last week explaining why the gold stocks remain in correction mode. Since their earnings greatly leverage gold prices, their stock prices tend to mirror and amplify gold’s. They haven’t made any headway since early August.
The GDX VanEck Vectors Gold Miners ETF is the most-popular gold-stock index and trading vehicle. Like usual, GDX’s price action so far this year looks just like gold’s but at a larger magnitude. Because of their total dependence on prevailing gold prices, gold stocks need differential gold-ETF-share buying just as much as gold does. Their massive post-panic upleg failed right when gold’s did on flagging gold-ETF buying.
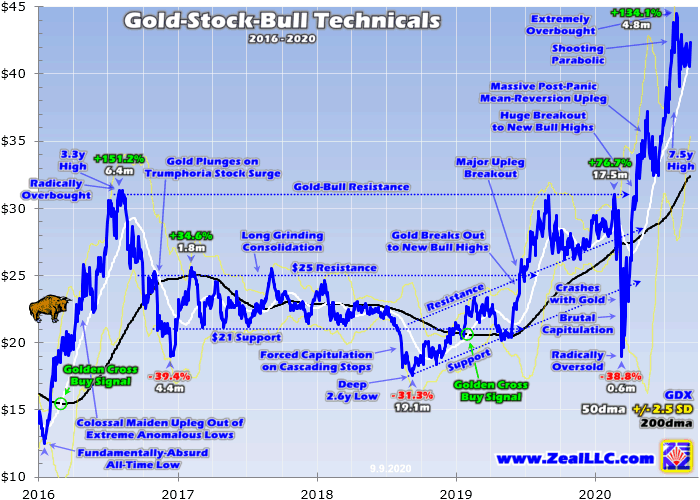
Gold-stock speculators and investors definitely need to closely follow GLD’s and IAU’s holdings, since they so powerfully drive gold price trends. As goes gold, so go the gold stocks! Whether GDX continues consolidating high, rolls over into a major correction, or resumes grinding higher totally depends on what American stock traders do with GLD and IAU. Their capital flows drive the entire precious-metals complex.
And I suspect big differential gold-ETF-share selling is more likely in the near-term than a resumption of the huge buying into early August. Gold surged too far too fast to be sustainable, hitting extraordinary levels of overboughtness. Momentum-chasing millennial traders seemed to lead that charge, as reported in since-discontinued positioning data from their favorite brokerage Robinhood which pioneered free stock trading.
Millennials were hit disproportionately hard by the widespread government lockdowns last spring as this pandemic mounted. A big fraction of them worked in the service industries, which ground to a halt. So they were stuck at home with nothing to do, collecting fat unemployment checks greatly boosted by huge pandemic stimulus spending. So many used that financial windfall to fund their first-ever forays into stock trading.
Robinhood account openings skyrocketed, and young traders enjoyed big and fast gains with the stock markets soaring on extreme Fed money printing. In just 3.0 months into early June, the Fed’s balance sheet skyrocketed an astonishing 66.3% or $2.9t higher! Millennial traders rushed to pile in to the big winners, chasing their upside momentum. They found gold in mid-July, which helped force it parabolic.
Gold’s post-panic upleg was normal and sustainable before that, climbing higher in a solid uptrend. But over the next several weeks into early August, gold soared a blistering 14.9% higher. That stretched it way up to 1.260x its 200dma, bull-slaying levels of overboughtness that killed its last secular bull! GLD’s and IAU’s holdings rocketed up 5.1% or 61.1t and 6.5% or 30.2t during that span, which is what forced gold higher.
And Robinhood positioning data showed millennial traders led the way. In those same few weeks, the total number of Robinhood users owning GLD skyrocketed 58% higher! Their IAU ownership soared 33%. And it wasn’t just those younger traders flooding in. The reason Robinhood doesn’t charge users for stock trading is it instead sells their real-time order-flow data to high-frequency-trading firms, which front run it.
So when millennial Robinhood traders were stampeding into gold via GLD and IAU, orders of magnitude more capital was rushing in from hedge funds milliseconds before those trades! That Robinhood data, from young new traders blindly chasing any momentum, was the tail wagging the vastly-larger hedge-fund dog. And once those millennials moved on from gold in early August, so did the hedge funds front running them.
Until that millennial and more-broadly retail-trader zeal for gold returns, it is hard to imagine big differential gold-ETF-share demand spinning up again. And without that, gold is dead in the water for now. If the Robinhooders and all the professional capital aping them start dumping GLD and IAU en masse, gold and thus the gold stocks will fall into much-deeper corrections. That is a real risk given gold’s flagging momentum.
Under heavy fire for the extreme speculative risks its young and naive users were taking, Robinhood ceased publishing its users’ collective positioning data soon after gold peaked! It is probably still selling it to hedge funds privately, but outside of those rarefied circles no one knows what the Robinhooders have done with their gold-ETF holdings. If they haven’t exited yet, big differential gold-ETF-share selling is still coming.
So it seems prudent to be wary of gold here, at least until early August’s epic overboughtness is mostly worked off. Again gold skyrocketed to 1.260x its 200dma at peak, and so far the lowest it has retreated is still way up at 1.143x its 200dma earlier this week. Incredibly that is still above the extremely-overbought upper resistance of gold’s relative trading range! Big gold-ETF-share selling is way more likely than big buying.
All bull markets naturally flow then ebb, taking two steps forward before retreating one step back. Their price action gradually meanders around uptrends. This normal upleg-correction pattern keeps sentiment balanced, extending bull markets’ longevity. And it is a huge boon for traders, offering excellent mid-bull opportunities to buy relatively low before later selling relatively high. That greatly expands bulls’ potential gains!
At Zeal we started aggressively buying and recommending fundamentally-superior gold and silver miners in our weekly and monthly subscription newsletters back in mid-March right after the stock-panic lows. We layered into dozens of new positions before gold stocks grew too overbought, which were stopped out recently at huge realized gains running as high as +199%! Our subscribers multiplied their wealth within months.
To profitably trade high-potential gold stocks, you need to stay informed about what’s driving gold. Our popular newsletters are a great way, easy to read and affordable. They draw on my vast experience, knowledge, wisdom, and ongoing research to explain what’s going on in the markets, why, and how to trade them with specific stocks. Subscribe today and take advantage of our 20%-off sale! Corrections are the time to do your gold-stock homework, preparing to redeploy as they pass.
The bottom line is the big gold-ETF buying that catapulted this metal higher into early August has gone missing in action since then. The major gold ETFs’ holdings have stalled out, explaining gold’s flagging momentum. With the global gold market increasingly dominated by GLD and IAU, gold can’t advance without American stock traders shifting big capital into gold through these conduits. But their buying has vanished.
This gold bull’s precedent shows differential gold-ETF-share selling usually follows soon after big and fast holdings builds exhaust themselves. Compounding these risks after gold’s recent parabolic upleg are the young traders who heavily drove it. Their modus operandi is chasing upside momentum, and once that fails they are quick to abandon trades. They may still need to exit their frenziedly-acquired gold-ETF shares.
Adam Hamilton, CPA
September 11, 2020
Copyright 2000 - 2020 Zeal LLC (www.ZealLLC.com)
About the author