
As Huey pushes his cart of rocks out of the dark and up the hill…

In NFTRH we did a lot of work managing the oncoming correction, the valid reasons behind it (these reasons are beyond the scope of this post, but don’t listen to the perma-bulls, they were more than valid and readable in advance), the now nearly 5 month old correction (technically still intact) and more recently the improved risk vs. reward after HUI hit our long-standing ‘best’ target of 280 +/-.
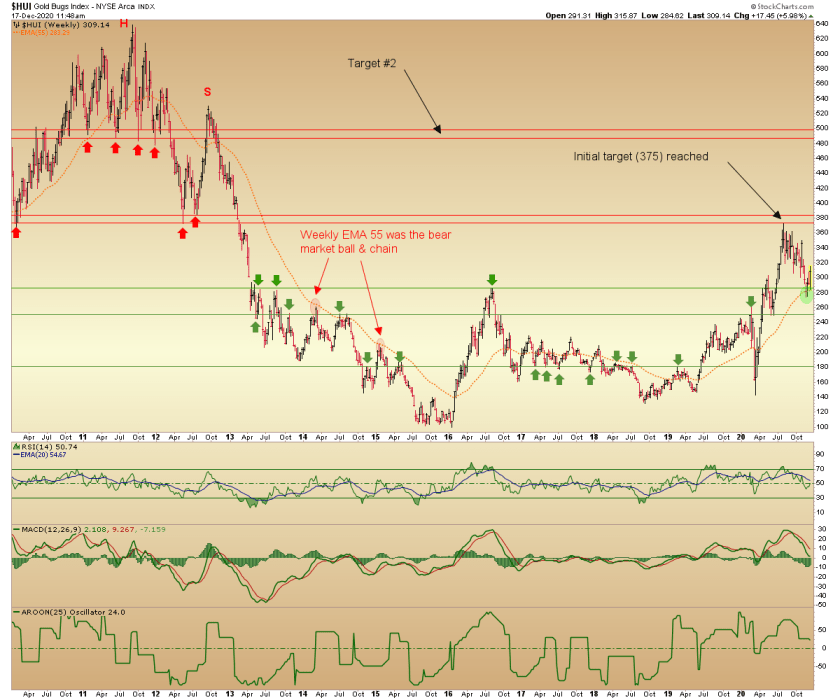
There is another downside target at 260 +/- but it may just be time for the drudgery (AKA consolidation/correction to bleed out the excesses) to end. The answer to confirm that will be left to ongoing work we do on shorter time frames, including daily charts in the weekly report and in-week updates. But for this post, I want to take a perspective look at HUI’s weekly chart.
This is an old chart we used to manage the previous bull market top and long road down to the depths of the bear, in lockdown by the 55 week EMA. With the excitement happening during FOMC week, as the Fed tells us all what we already knew (it’s funny munny for as far as the eye can see, or at least as long as the Continuum permits) it pays to have some bigger picture perspective while positioning.
I think it is a notable, if minor, positive that Huey has so far held the EMA 55 for the first time on the way up as it had held below it during the worst of the bear market on the way down. It never hurts to see things rhyme when using TA. Of more importance, HUI has held the first layer of support on the predictable pullback from all too clear resistance at 375 (a target we had loaded since mid-2019).
The 260 +/- target also includes strong weekly chart support and until the downward consolidation from August is broken that cannot be ruled out, going strictly by the nominal technicals (again, there is a multitude of other indicators in play beyond nominal charting). RSI has just ticked positive again (50+) and MACD has declined to bleed out all of the excess while remaining positive (0+). AROON continues to indicate a positive larger trend. Not bad, Huey.
The purpose of this chart is to clearly show the next target at around 500, which like 375 includes very clear long-term resistance. The first step is to negate the post-July downward handle (which keeps 250-260 in play technically as long as it is unbroken). Once that happens we’d look for a new cyclical bull market high above 375. Then, if things go the way it appears they will, 500 +/- will be like shooting fish in a barrel because there is no notable resistance between 375 and 500.
Again, this is just a simple TA article and there are a lot of other factors in play. But sometimes it’s nice to have a bigger picture road map at the ready. Against this we’ll do a lot of detailed work on a weekly basis (NFTRH update posted today, password protected for the next couple of weeks but available thereafter), including charting individual miners to confirm moves like the one noted in Hecla Mining (HL) for example, on Wednesday.
For “best of breed” top down analysis of all major markets, subscribe to NFTRH Premium, which includes an in-depth weekly market report, detailed interim market updates and NFTRH+ dynamic updates and chart/trade setup ideas. You can also keep up to date with actionable public content at NFTRH.com by using the email form on the right sidebar. Follow via Twitter @NFTRHgt.
About the author
