
In this article we are going to look at a broad range of charts which collectively suggest that a devastating pan selloff may soon occur.
Given the now parlous state of the US economy it is a testament to the concerted efforts of the Fed and the Treasury to keep US markets elevated in order to protect the interests of their elite masters, but with the economy now starting to crumble in the face of an exponentially ballooning deficit, rising interest rates and a bursting of the AI / Tech bubble, it does not look they will be able to keep this game going any longer. Evidence of impending collapse is wholesale inflation increasing at the most rapid rate since November 2022 so that the purchasing power of the currency is being destroyed and home sales collapsing. Another wild card in play is oil – if there is another attack on Iran leading to Iran destroying a lot of Gulf Infrastucture then oil will soar and this time, with oil inventories already severely depleted, markets will crash.
So now let’s proceed to see what the charts are saying and we will start with the broad US stock market.
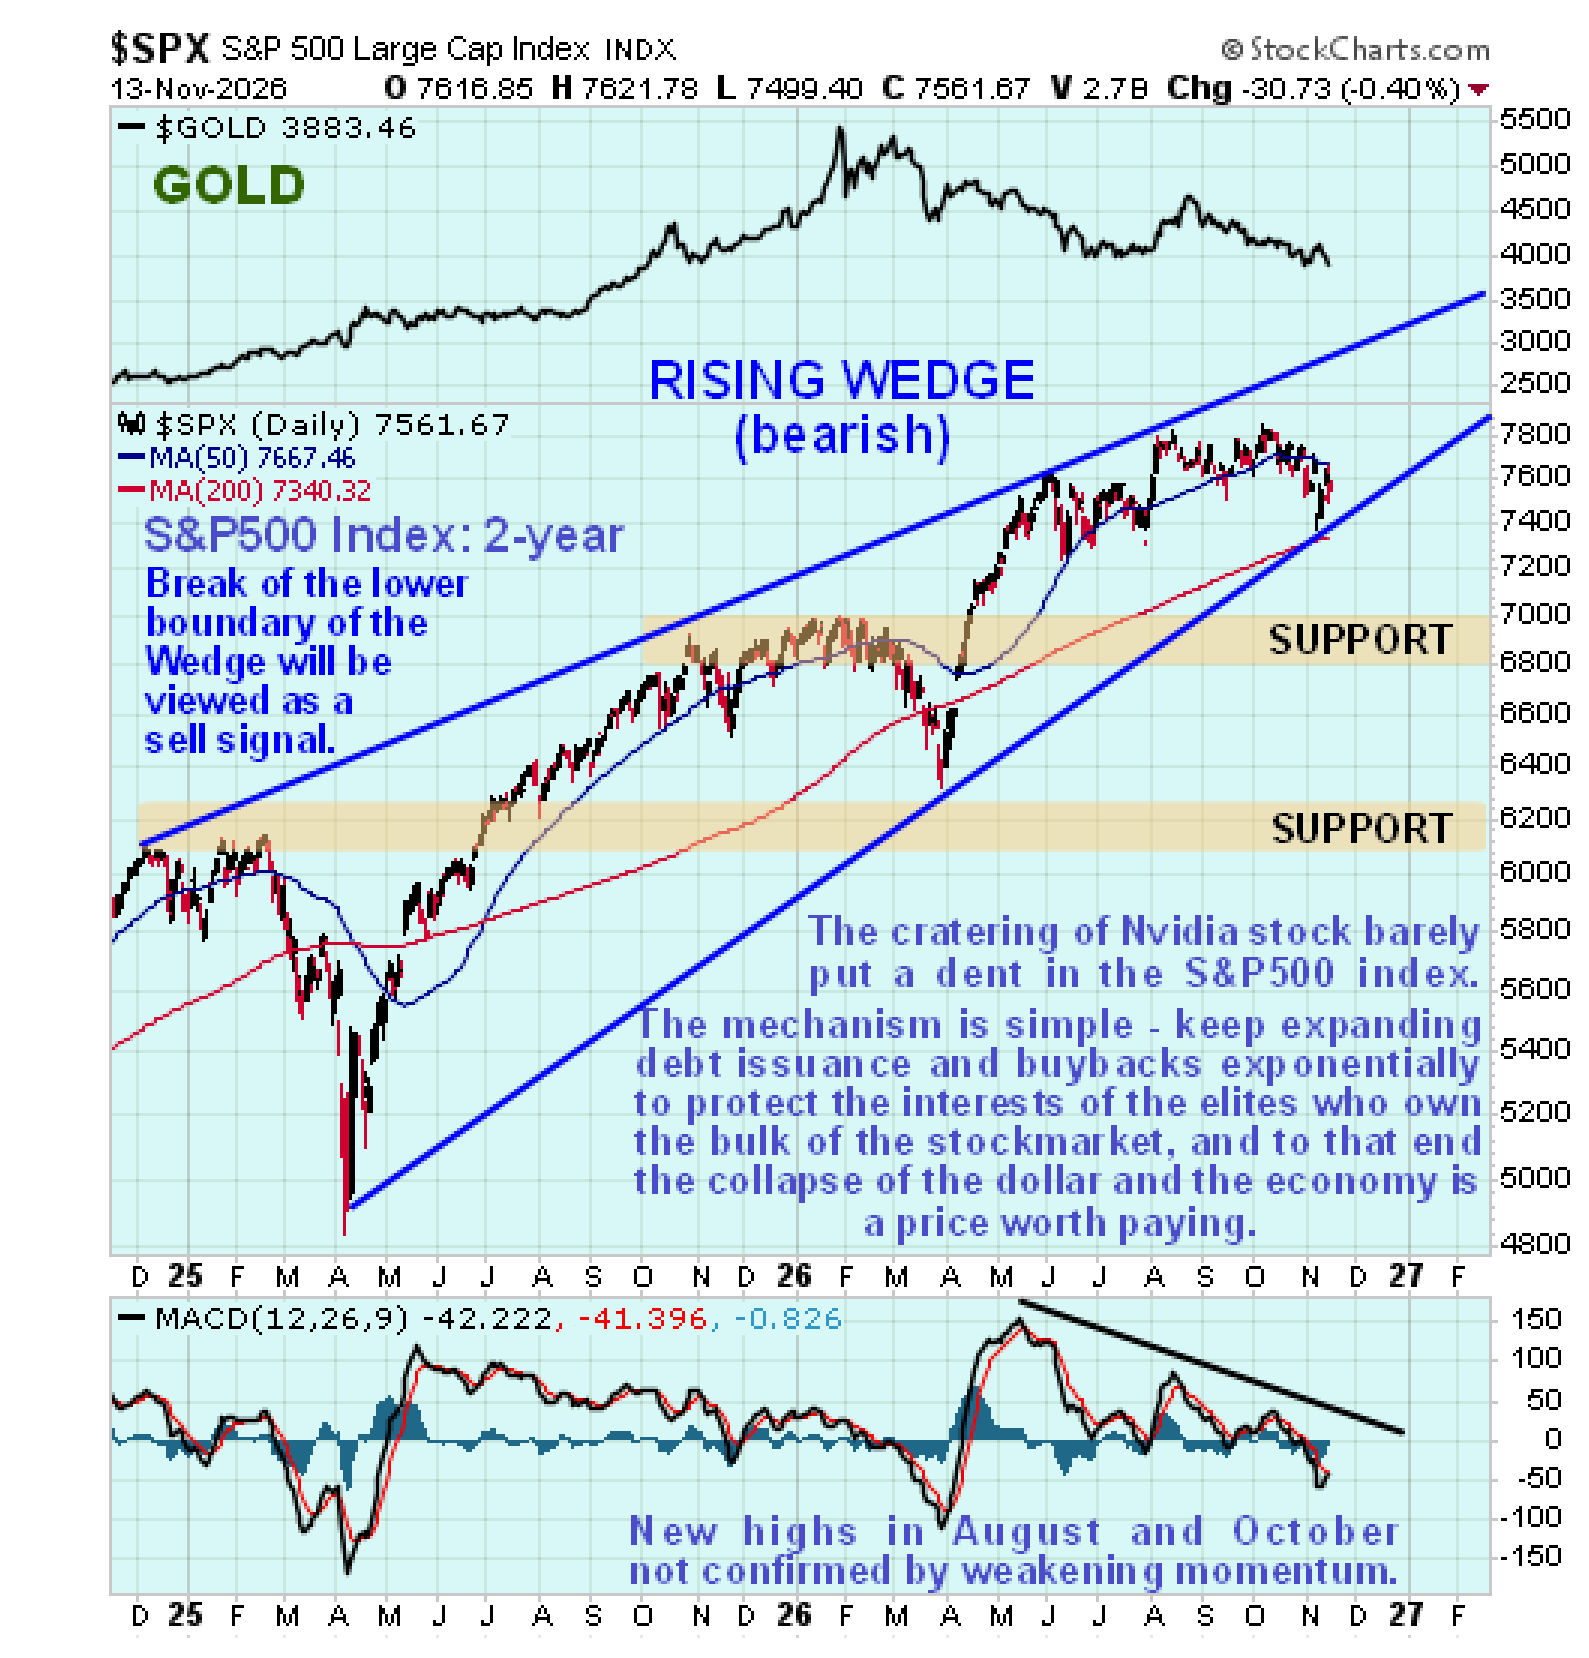
On the 2-year long chart for the S&P500 index we can see that it is pushing towards the apex of a very large bearish Rising Wedge that has been forming since late 2024. So a serious breakdown is a fast growing probability and it is rather remarkable that, even though the Nvidia collapse did put a dent in it, it didn’t break it down from this Wedge. In addition to the Wedge closing up, the index value and its moving averages are bunching together with upside momentum (MACD) rapidly weakening – there was a marked negative divergence of this indicator when the index made new highs in August and again in October, a clear sign that the uptrend is losing steam.
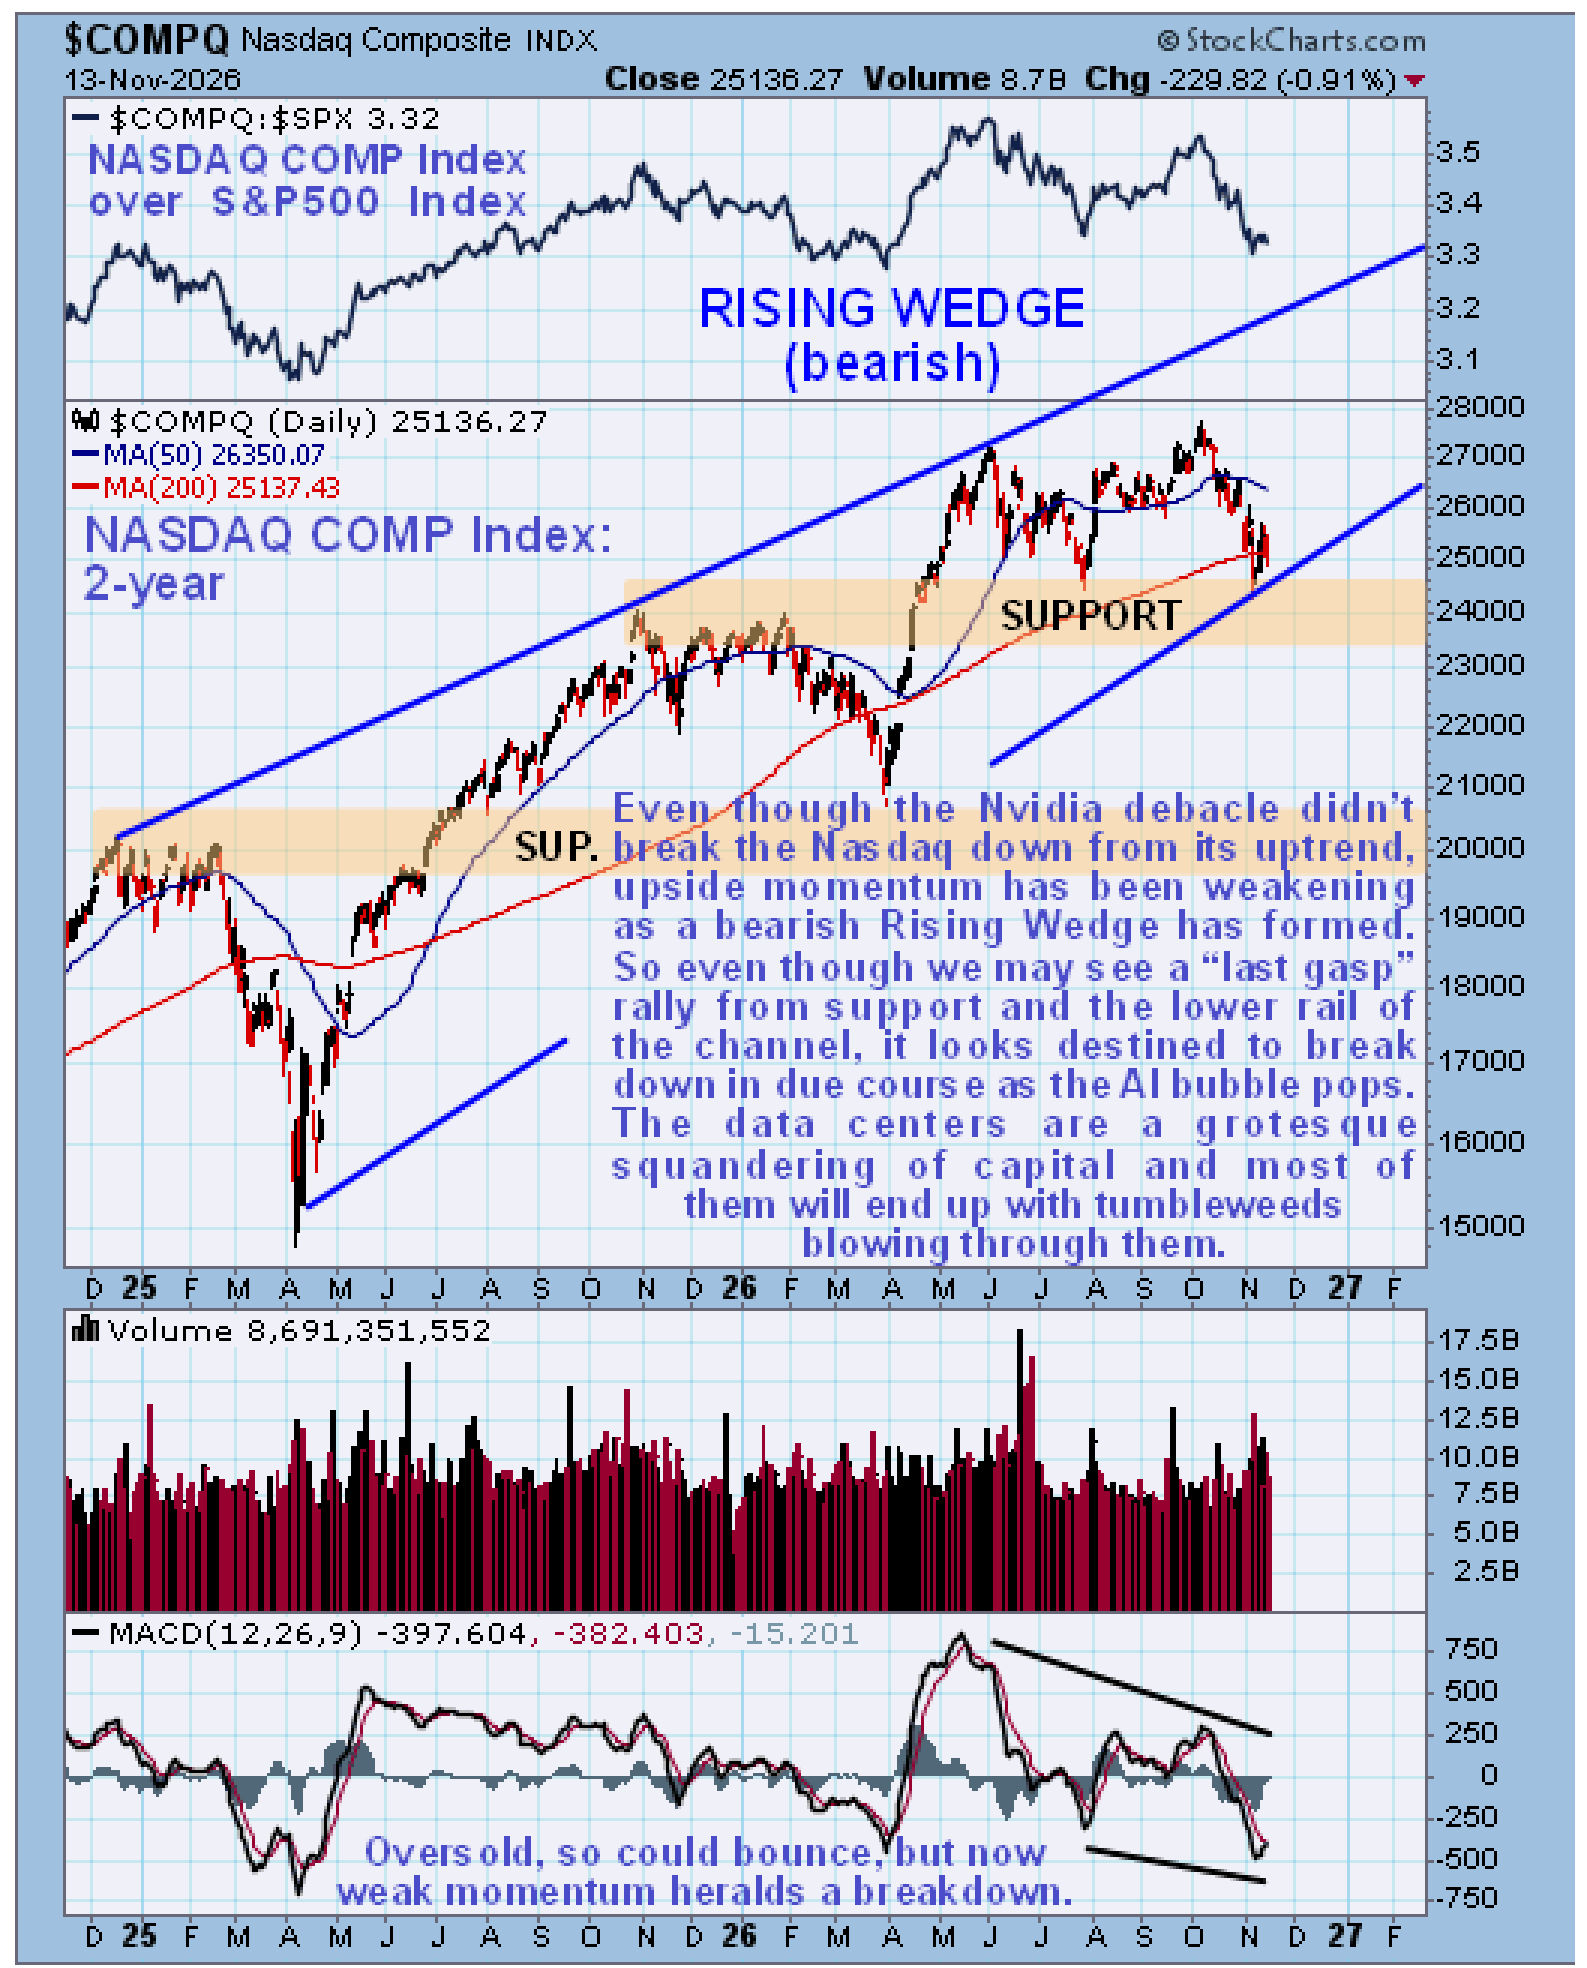
 The Tech sector being so crucial to the broad stock market and the main factor propping it up with the AI and data center buildout, etc., it is appropriate to take a quick look at the 2-year Nasdaq Composite index chart here with it placed a little below the 2-year S&P 500 chart to enable direct comparison. As we can see, the charts look very similar, with the S&P500’s bearish Rising Wedge uptrend showing more convergence, but on the other hand the Nasdaq has been weakening relative to the S&P500 in recent months, which is made clear by the ratio chart of the two shown at the top of this chart. Both indices dropped to the lower rails of their respective channels following the Nvidia debacle, and both show marked diminution of upside momentum pointing to eventual breakdown, regardless of any near-term relief rally.
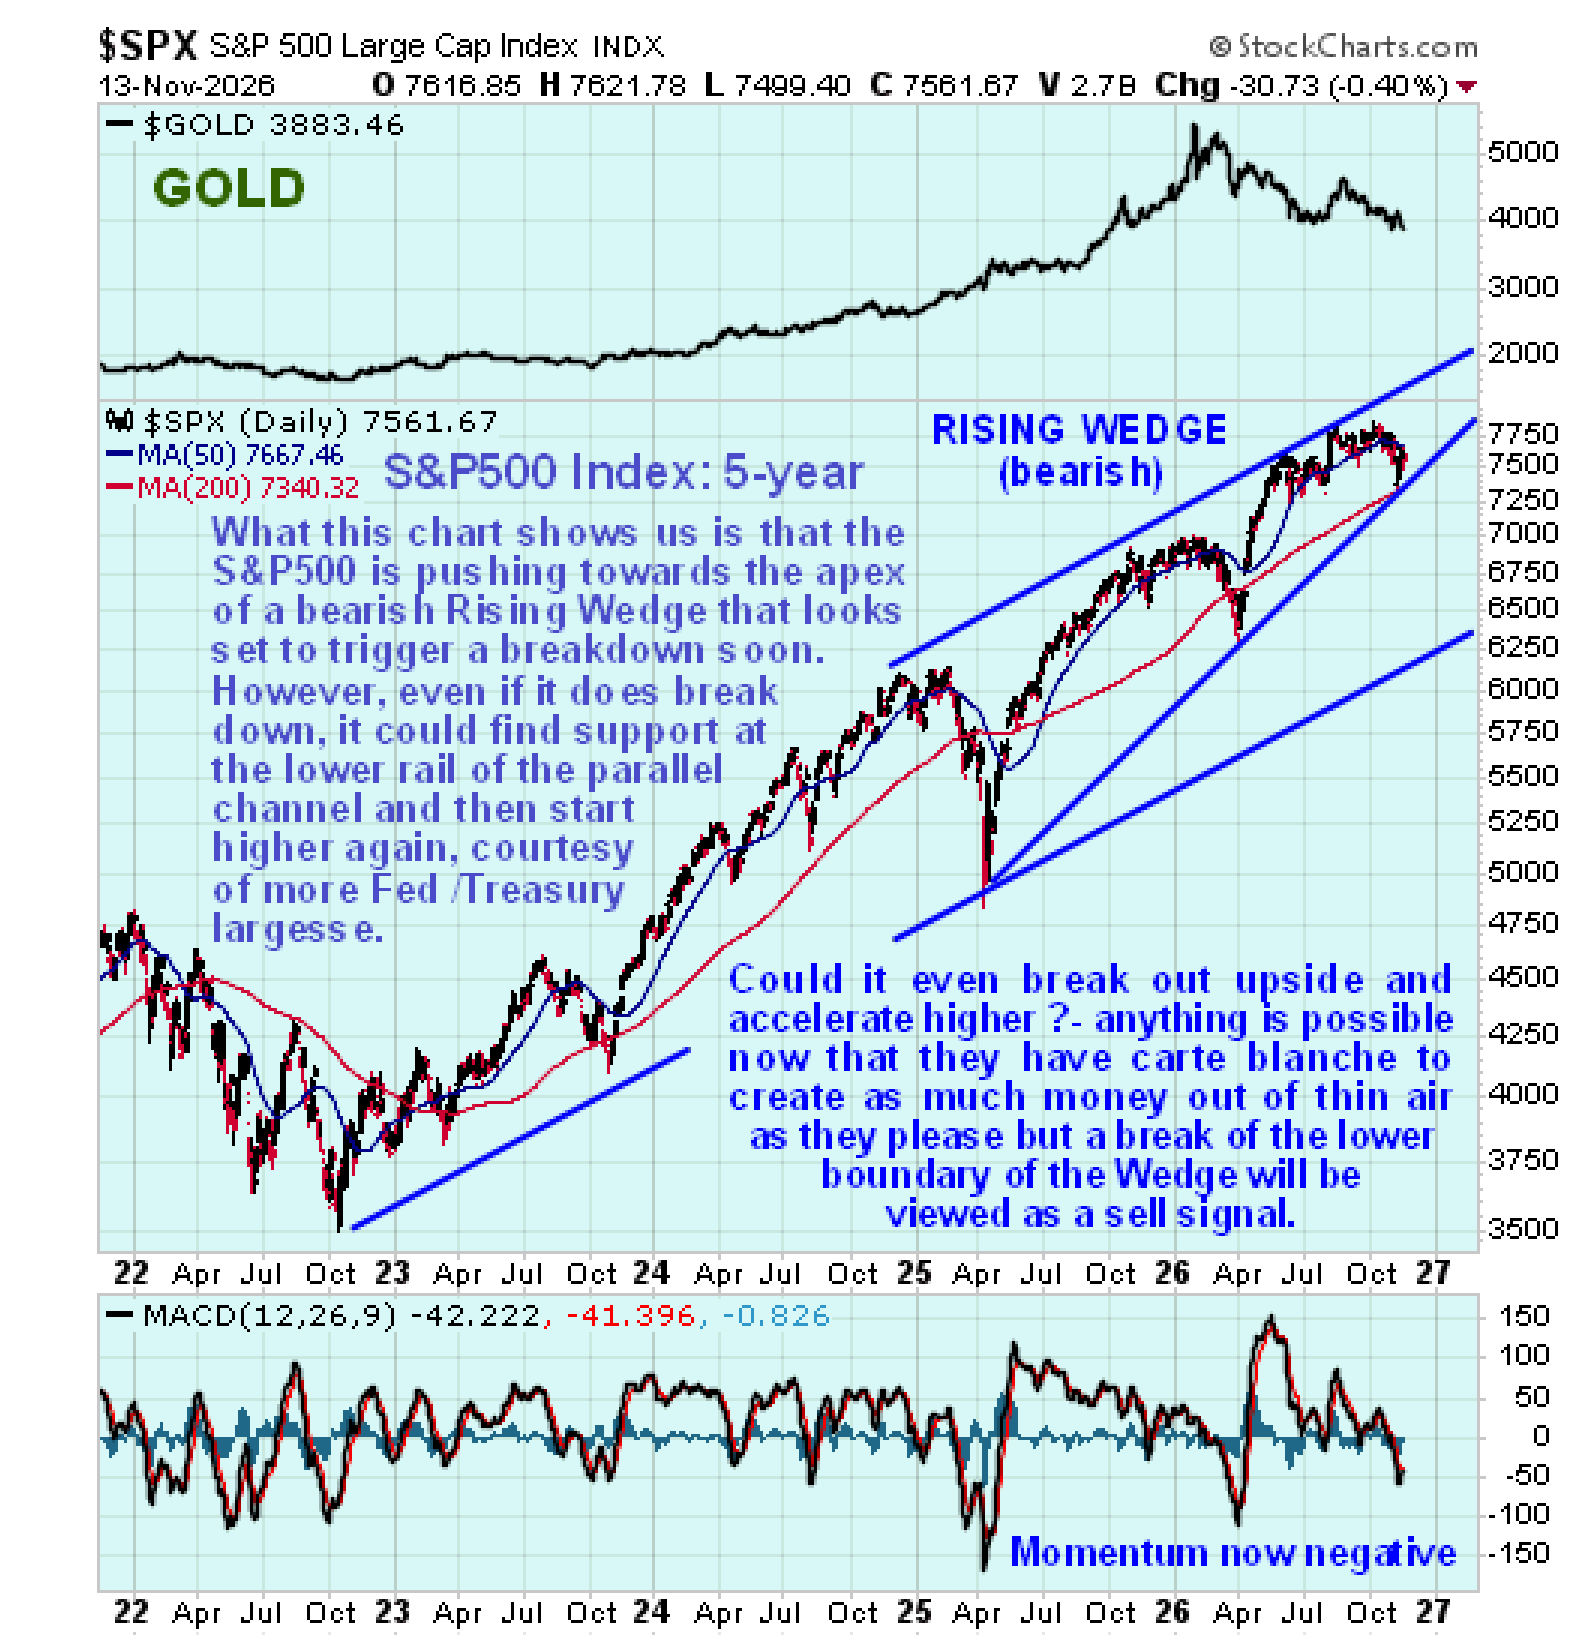
 On the 5-year chart, we can see that, in the event of the S&P500 index breaking lower soon as expected, the 1st stop on the decline will be support near to the lower boundary of the larger parallel uptrend channel shown, although in the event of the market going into all-out panic mode, this won’t save it…
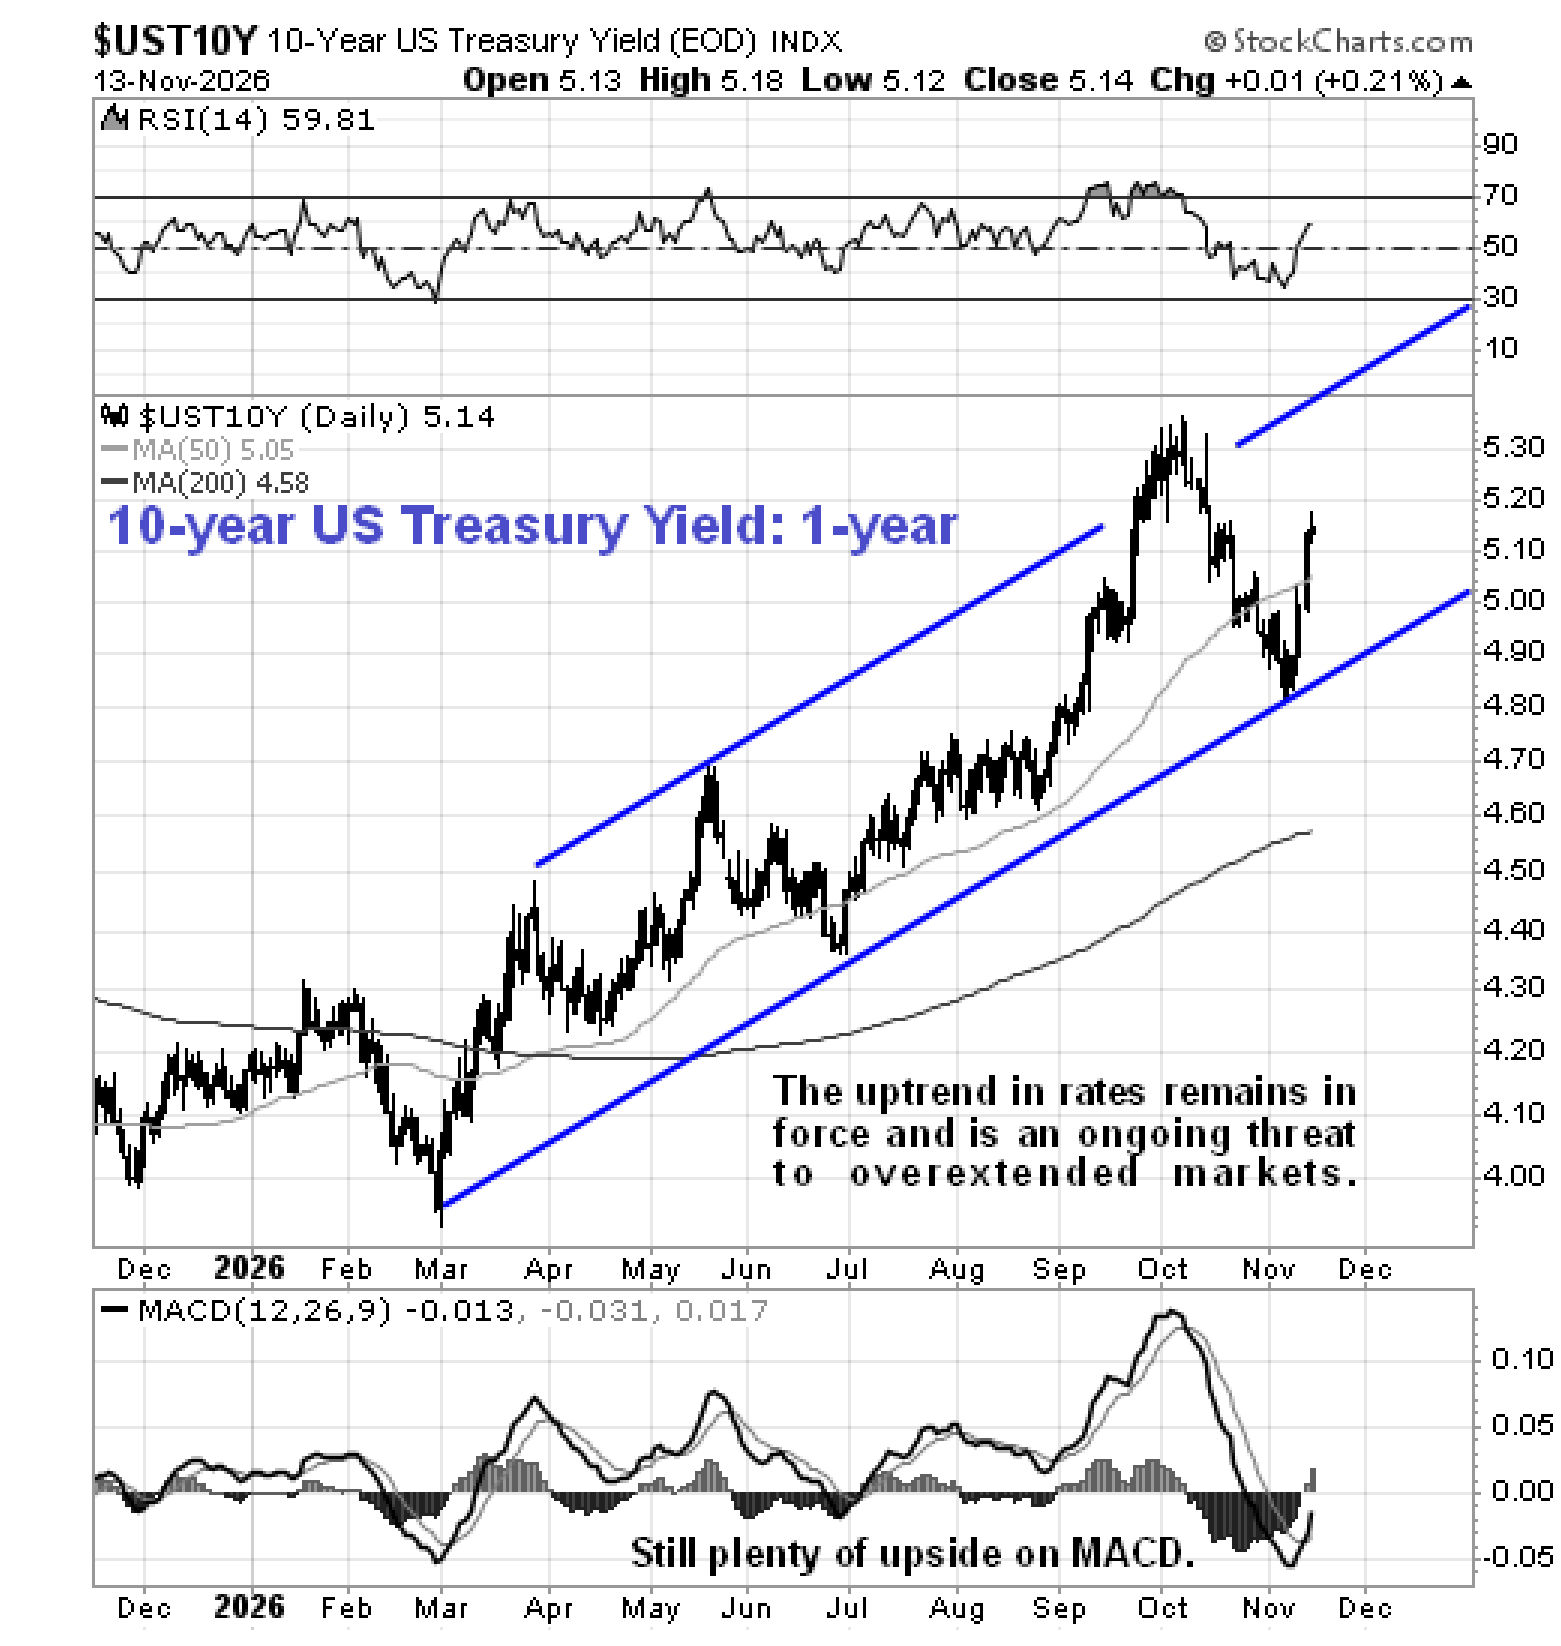
 A factor that will contribute to the market breaking down will, of course, be a continued rise in interest rates and as we can see on the 1-year chart for the US 10-year Treasury Yield, rates are rising again within their uptrend channel following a normal correction…
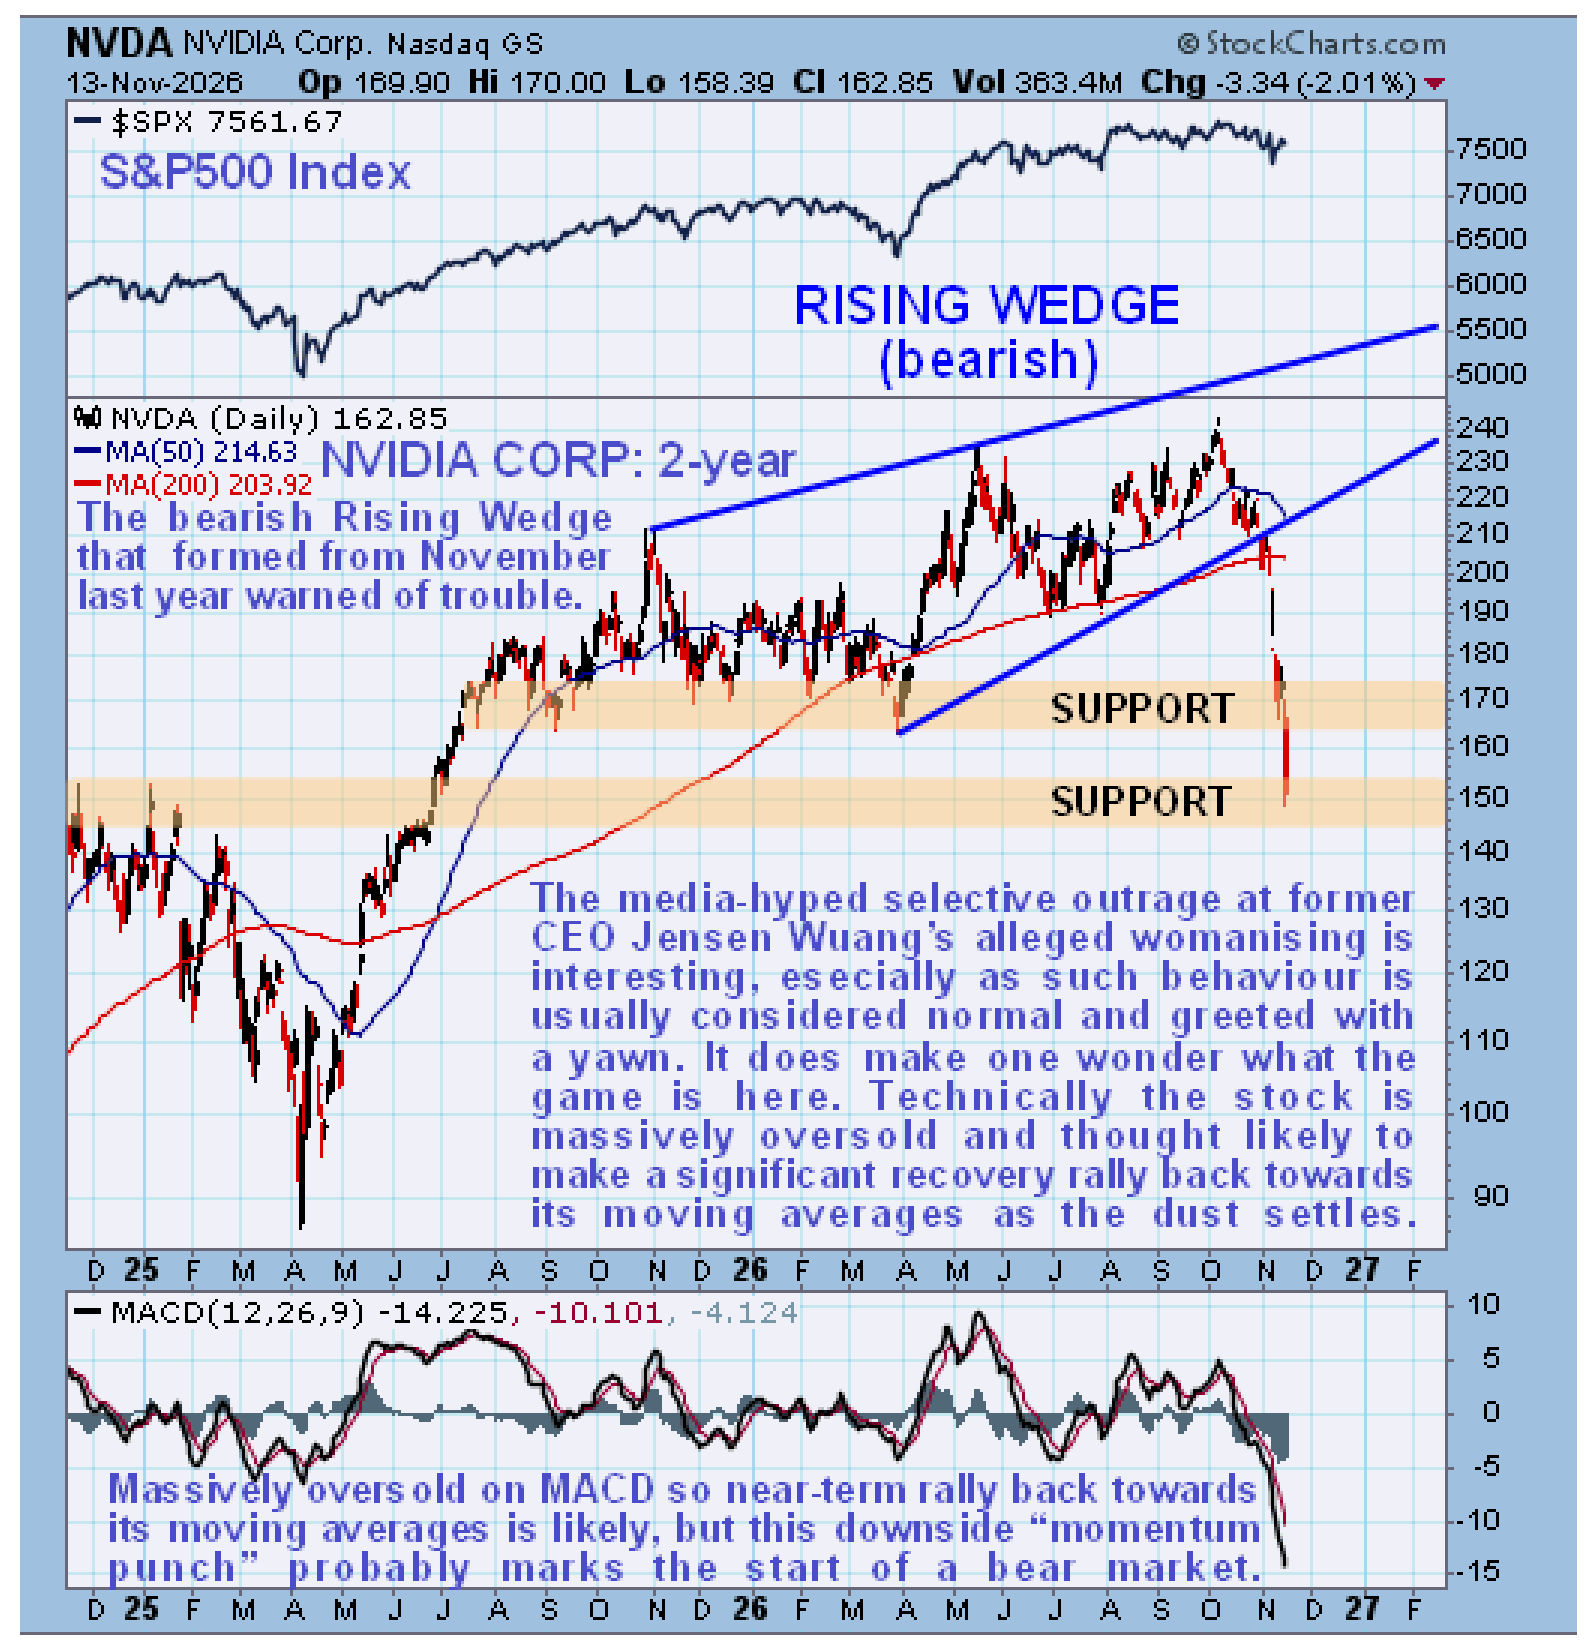
 On the 2-year chart for Nvidia, we can see that its recent plunge was preceded by the formation of a bearish Rising Wedge. Right now it is massively oversold after this drop, so a tradable relief rally is expected, probably back to the vicinity of its moving averages, and it might be helped in this by Elon Musk’s comments this weekend that the ex CEO Jensen Huang ought to be reinstated. However, the dramatic “momentum punch” on this breakdown is thought to mark the start of a major bear market, so renewed decline is expected after a probable relief rally – and the rot is expected to spread across the sector as the overblown AI bubble bursts, which will help to take down the entire market, of course, as the collateral values needed to maintain this bubble diminish.
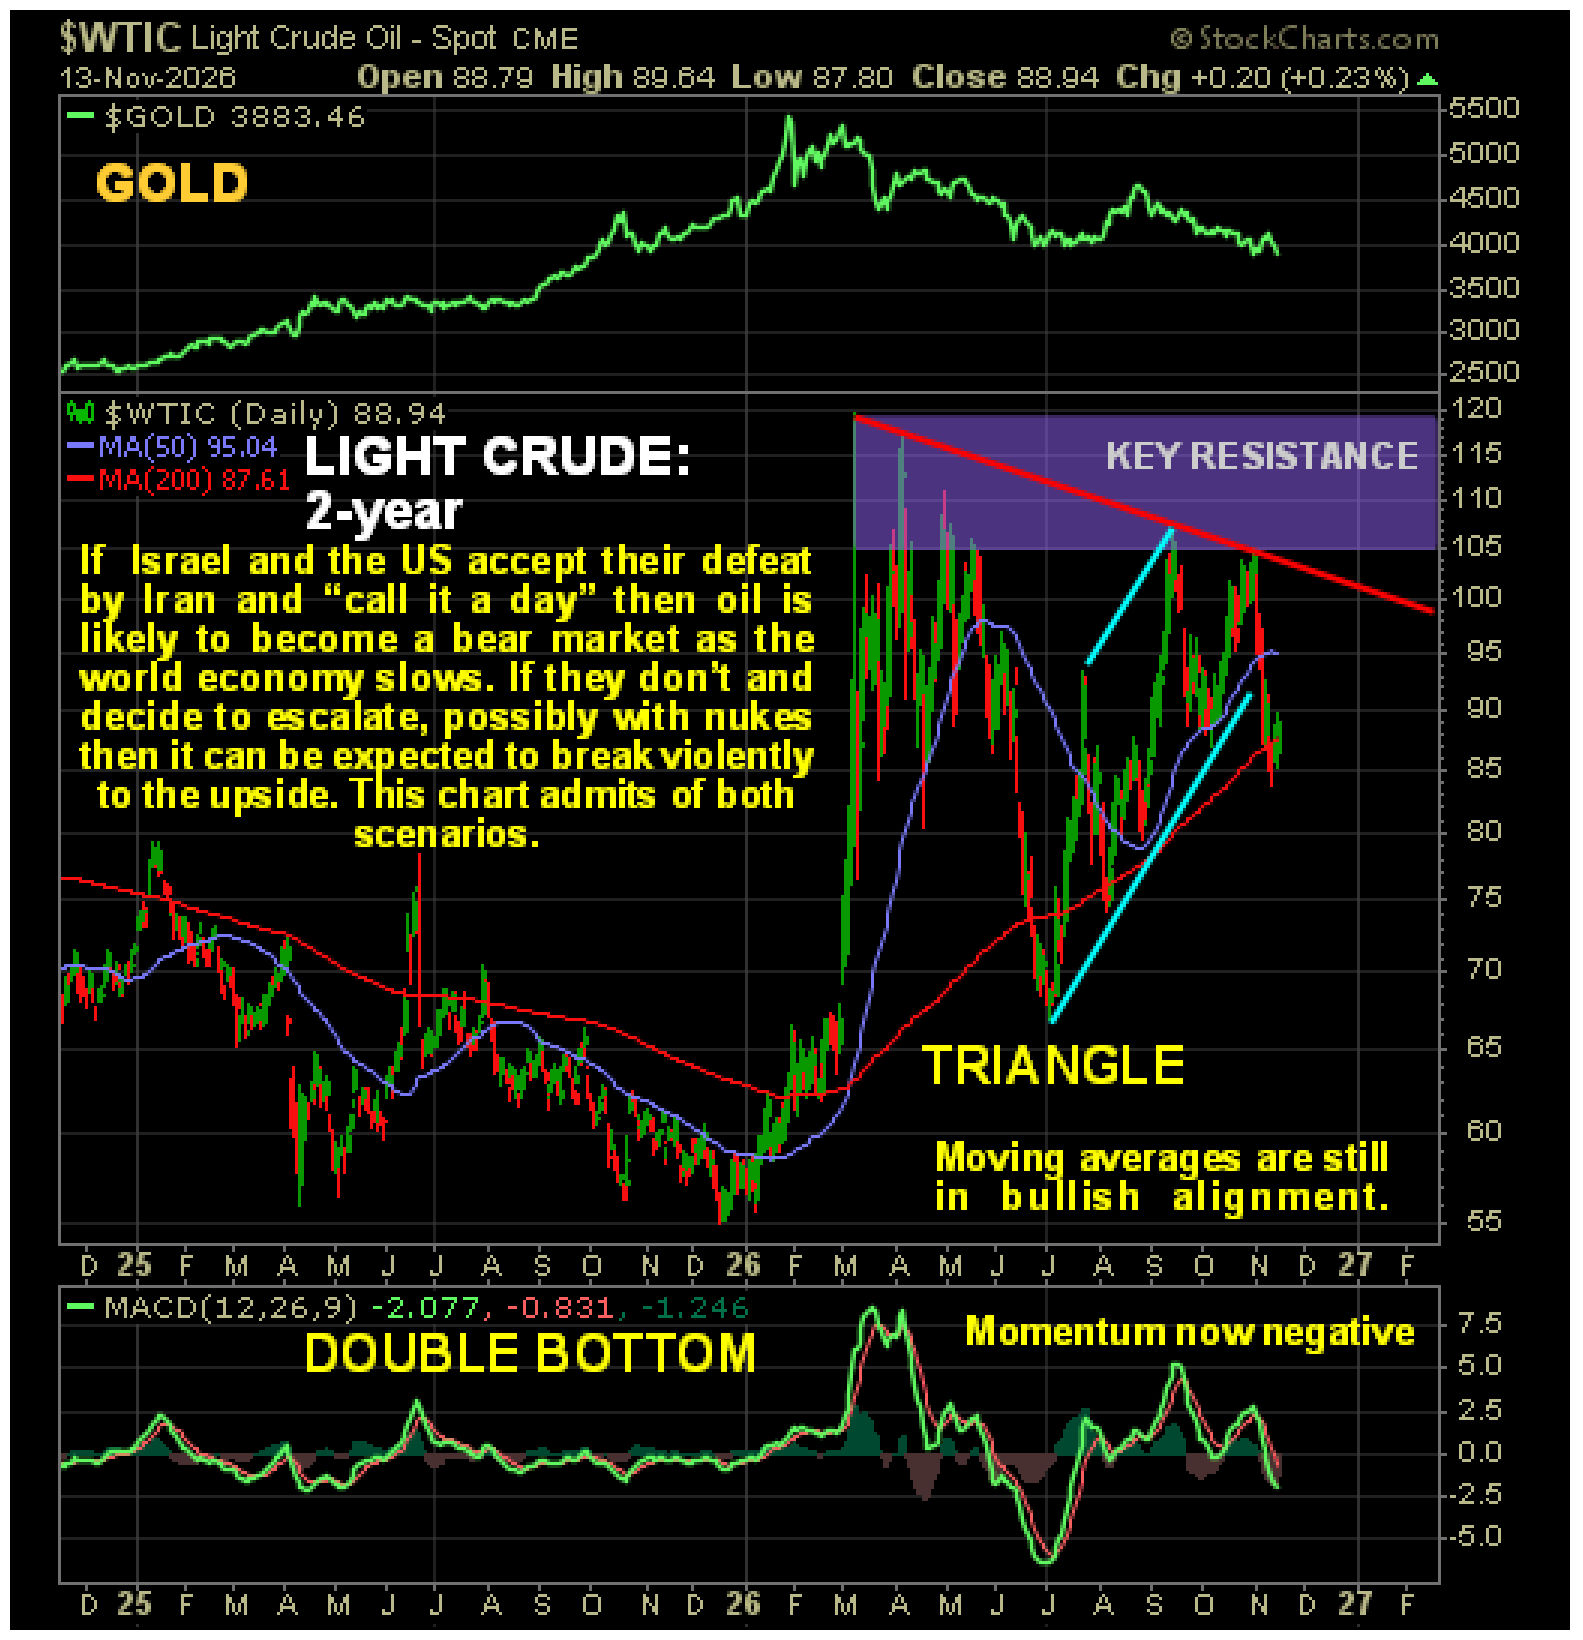
 The oil price is another key factor playing into this. The relatively high oil price since March has already had a seriously damaging effect on the world economy, but if there is another full-scale attack on Iran leading to Iran in turn attacking desalination and oil infrastructure across the Gulf, oil prices will soar partly due to already seriously depleted inventories, leading to a global economic implosion. What makes this more likely is that Iran has already won the war to this point, but this is not an outcome that Israel will accept and it therefore looks likely that Israel and the US will attack Iran again soon, possibly using nukes – and there are 3 carrier strike groups south of the Gulf with the 3rd one arriving about now.
The latest oil charts make clear that the price could break either way, depending on what happens. If Israel and the US call it a day and go home, in which case they will have to dress up defeat as victory using the controlled media, then the oil price can be expected to drop significantly, partly due to demand destruction as global recession really starts to bite. If they instead go ahead and attack Iran, then we are likely to see a wild price spike, probably to the $150 - $200 area initially. As we will now see the charts admit of both scenarios.
On the 2-year chart for Light Crude we can see that it broke down from its uptrend channel in force from early July on the Democrat party’s big win in the mid-terms which was due to investors’ belief that this makes another attack on Iran less likely. Remarkably, the price is well below the point it got to back last Spring when inventories were much higher than they are now…
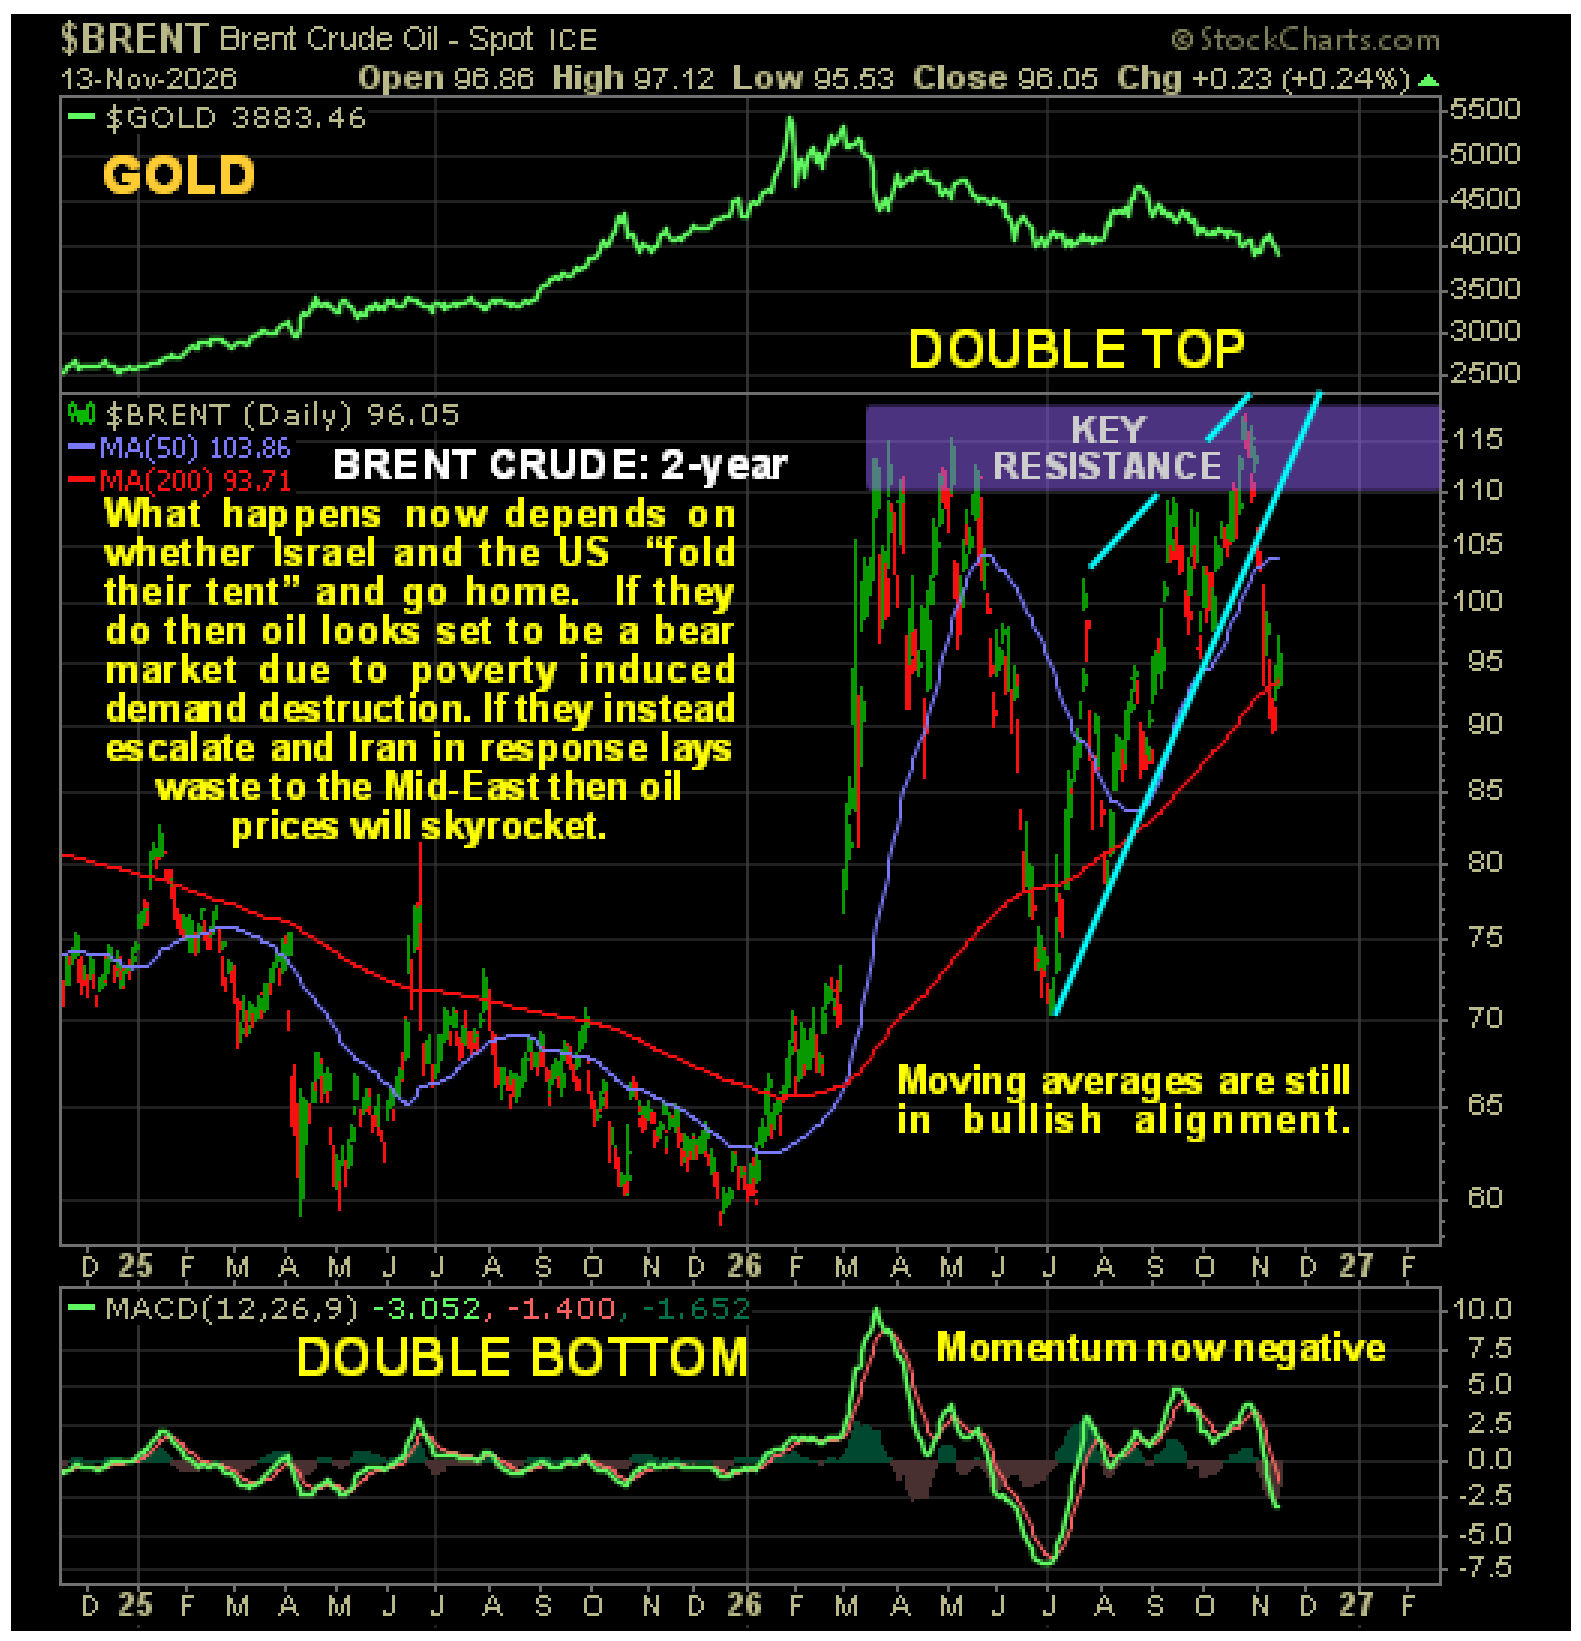
 Meanwhile, the 2-year chart for Brent Crude shows the price in retreat following the post-election breakdown from a bearish Rising Wedge as it drops away from a large Double Top, so in the absence of an attack on Iran, this is now a bear market.
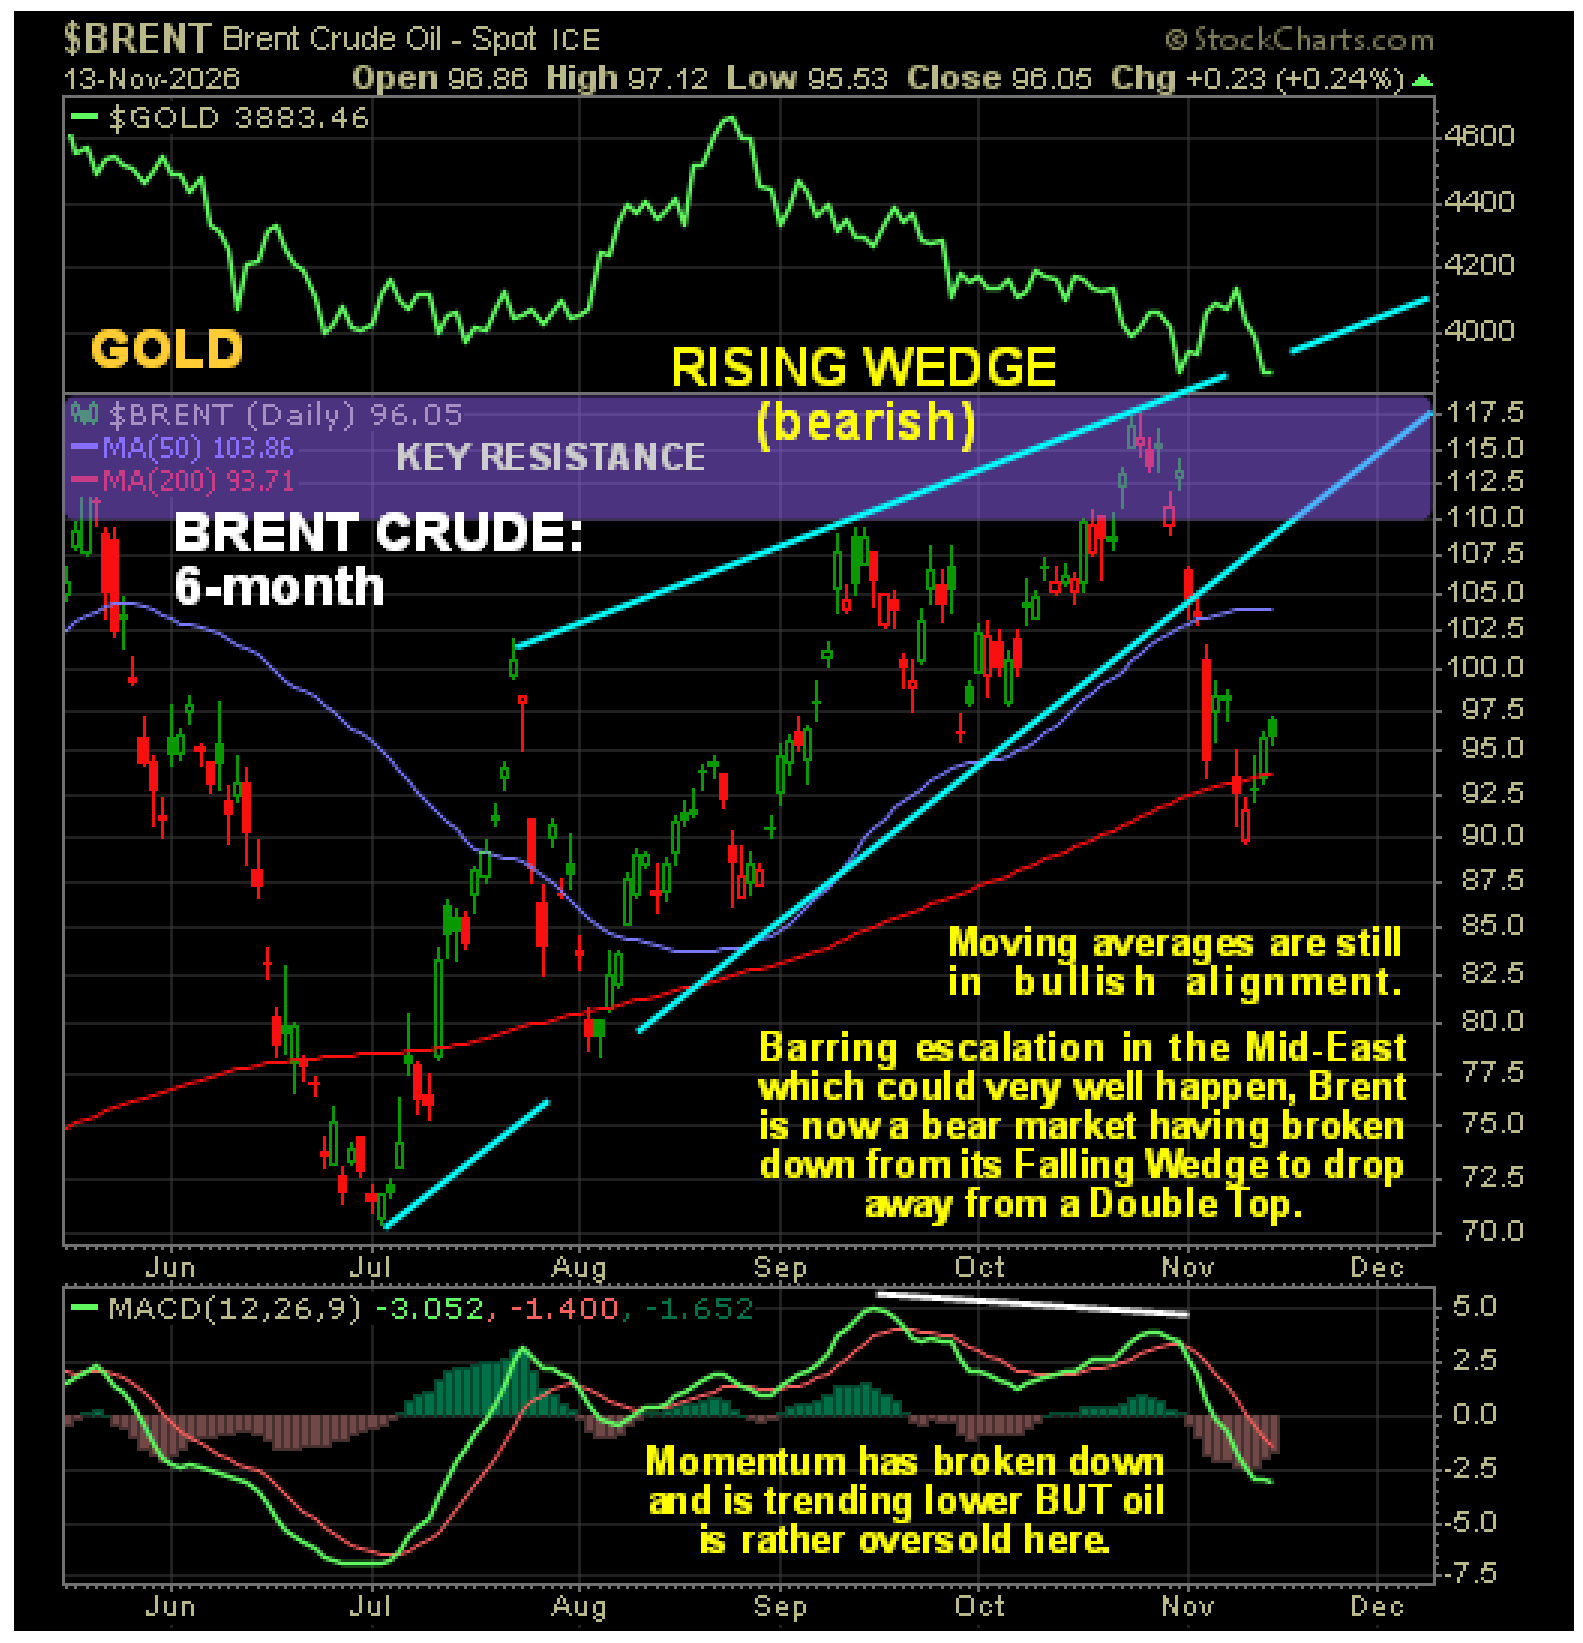
 On the 6-month chart for Brent Crude, we can see the bearish Rising Wedge from early July in much more detail and how its strong convergence made a breakdown more likely, which we spotted ahead of time…
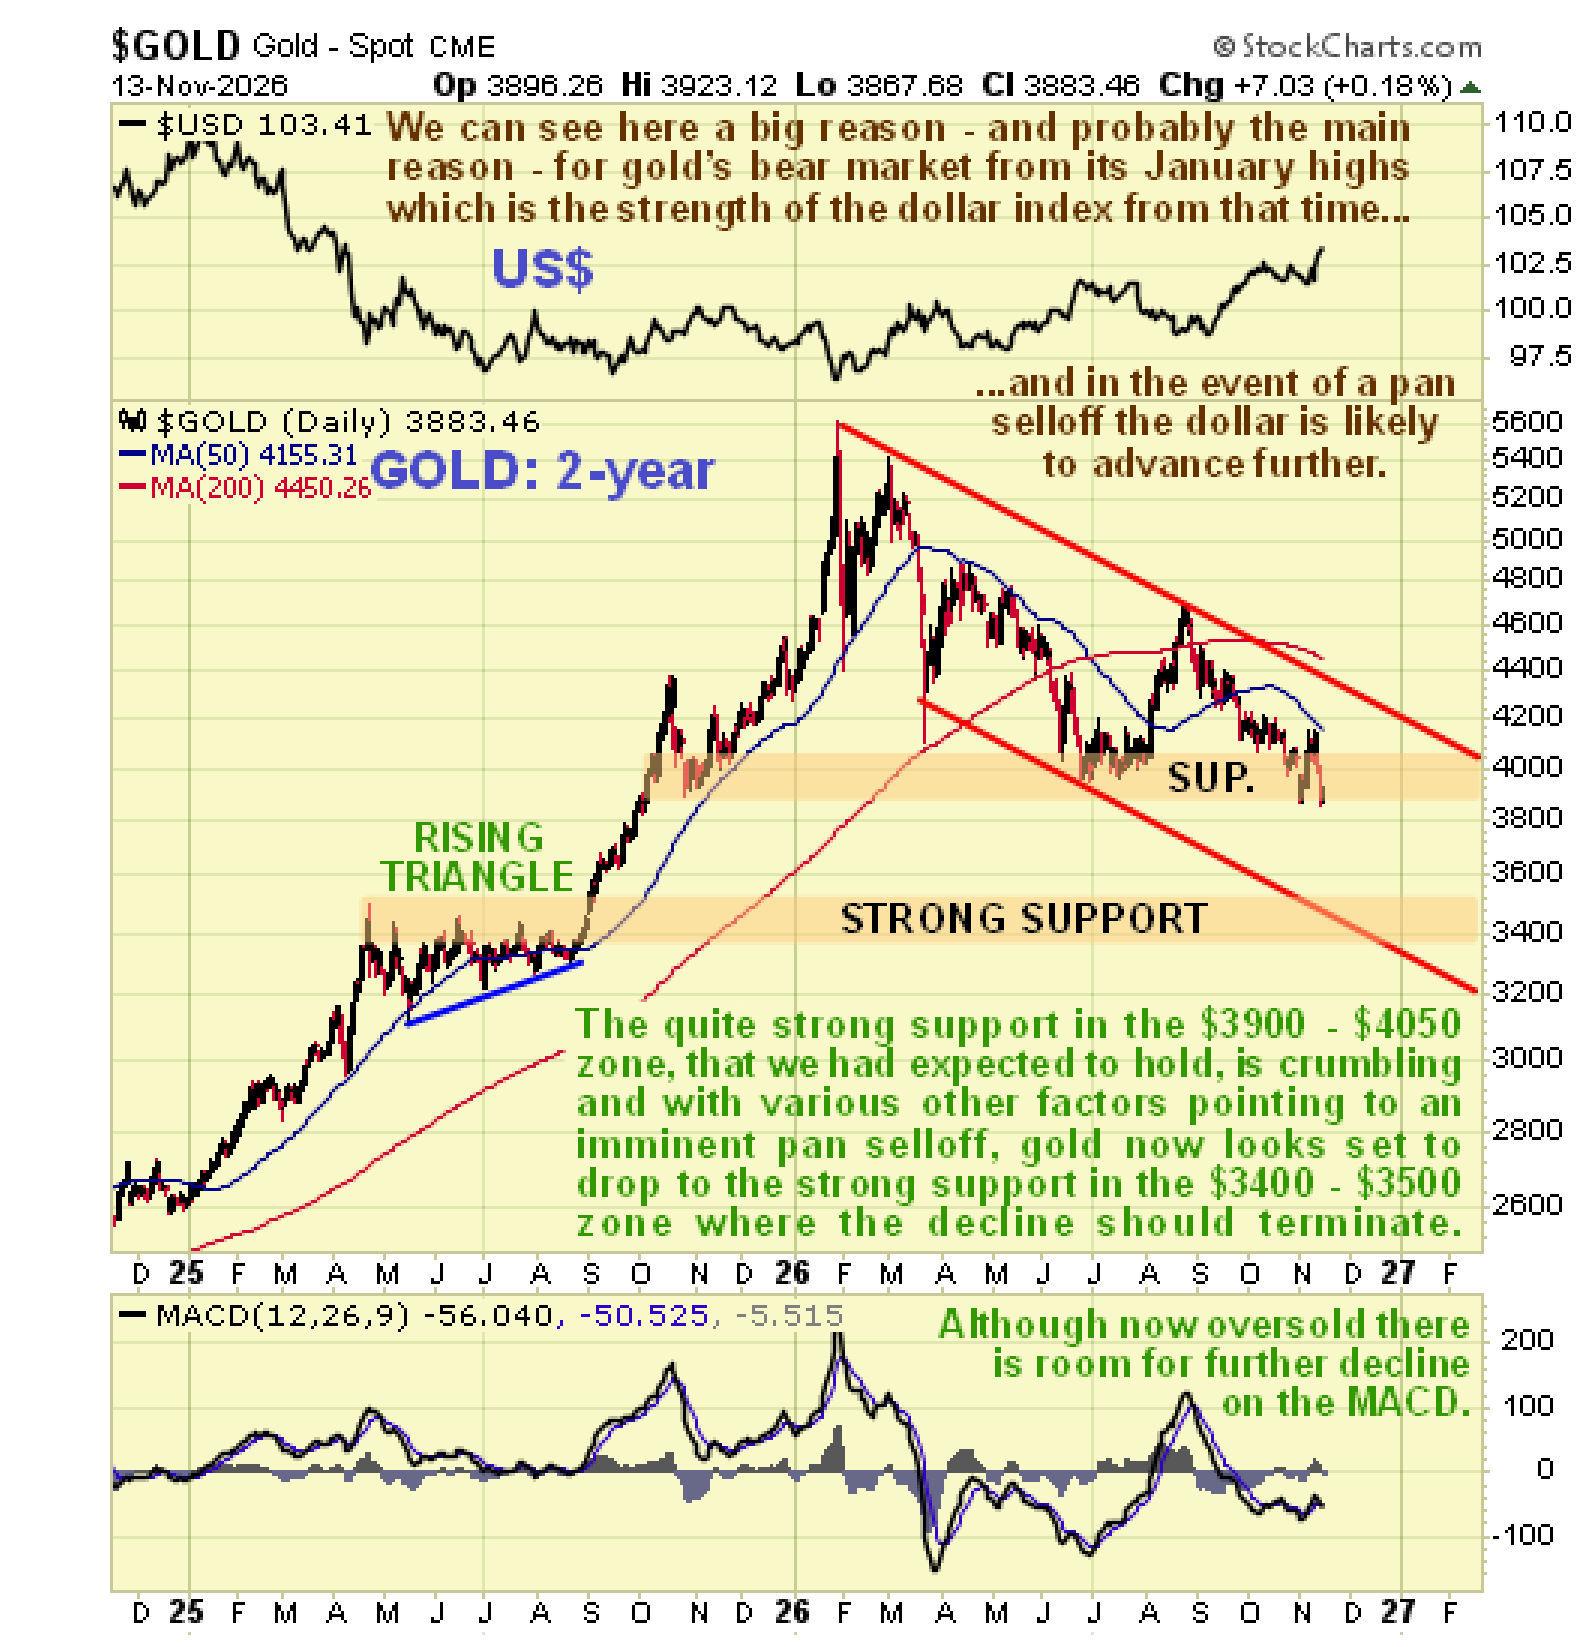
 Now to turn our attention to the metals, the Precious Metals and also other important metals, starting with gold..
The 2-year chart for gold is very useful as it makes several important points clear. One is that the downtrend that began late in January remains very much in force. We had thought that it would probably make a Double Bottom with its July lows at the strong support roughly in the $3900 - $4050 zone, but this support has been crumbling in recent days, opening up the risk of a further drop back to the next important support level in the $3400 - $3500 zone near to the upper boundary of the large Ascending Triangle that completed in the Summer of last year and also near to the bottom rail of its downtrend channel, with such a drop expected to synchronize with a pan selloff. If it does get down there, it will be a strong buy as this should be its final low.
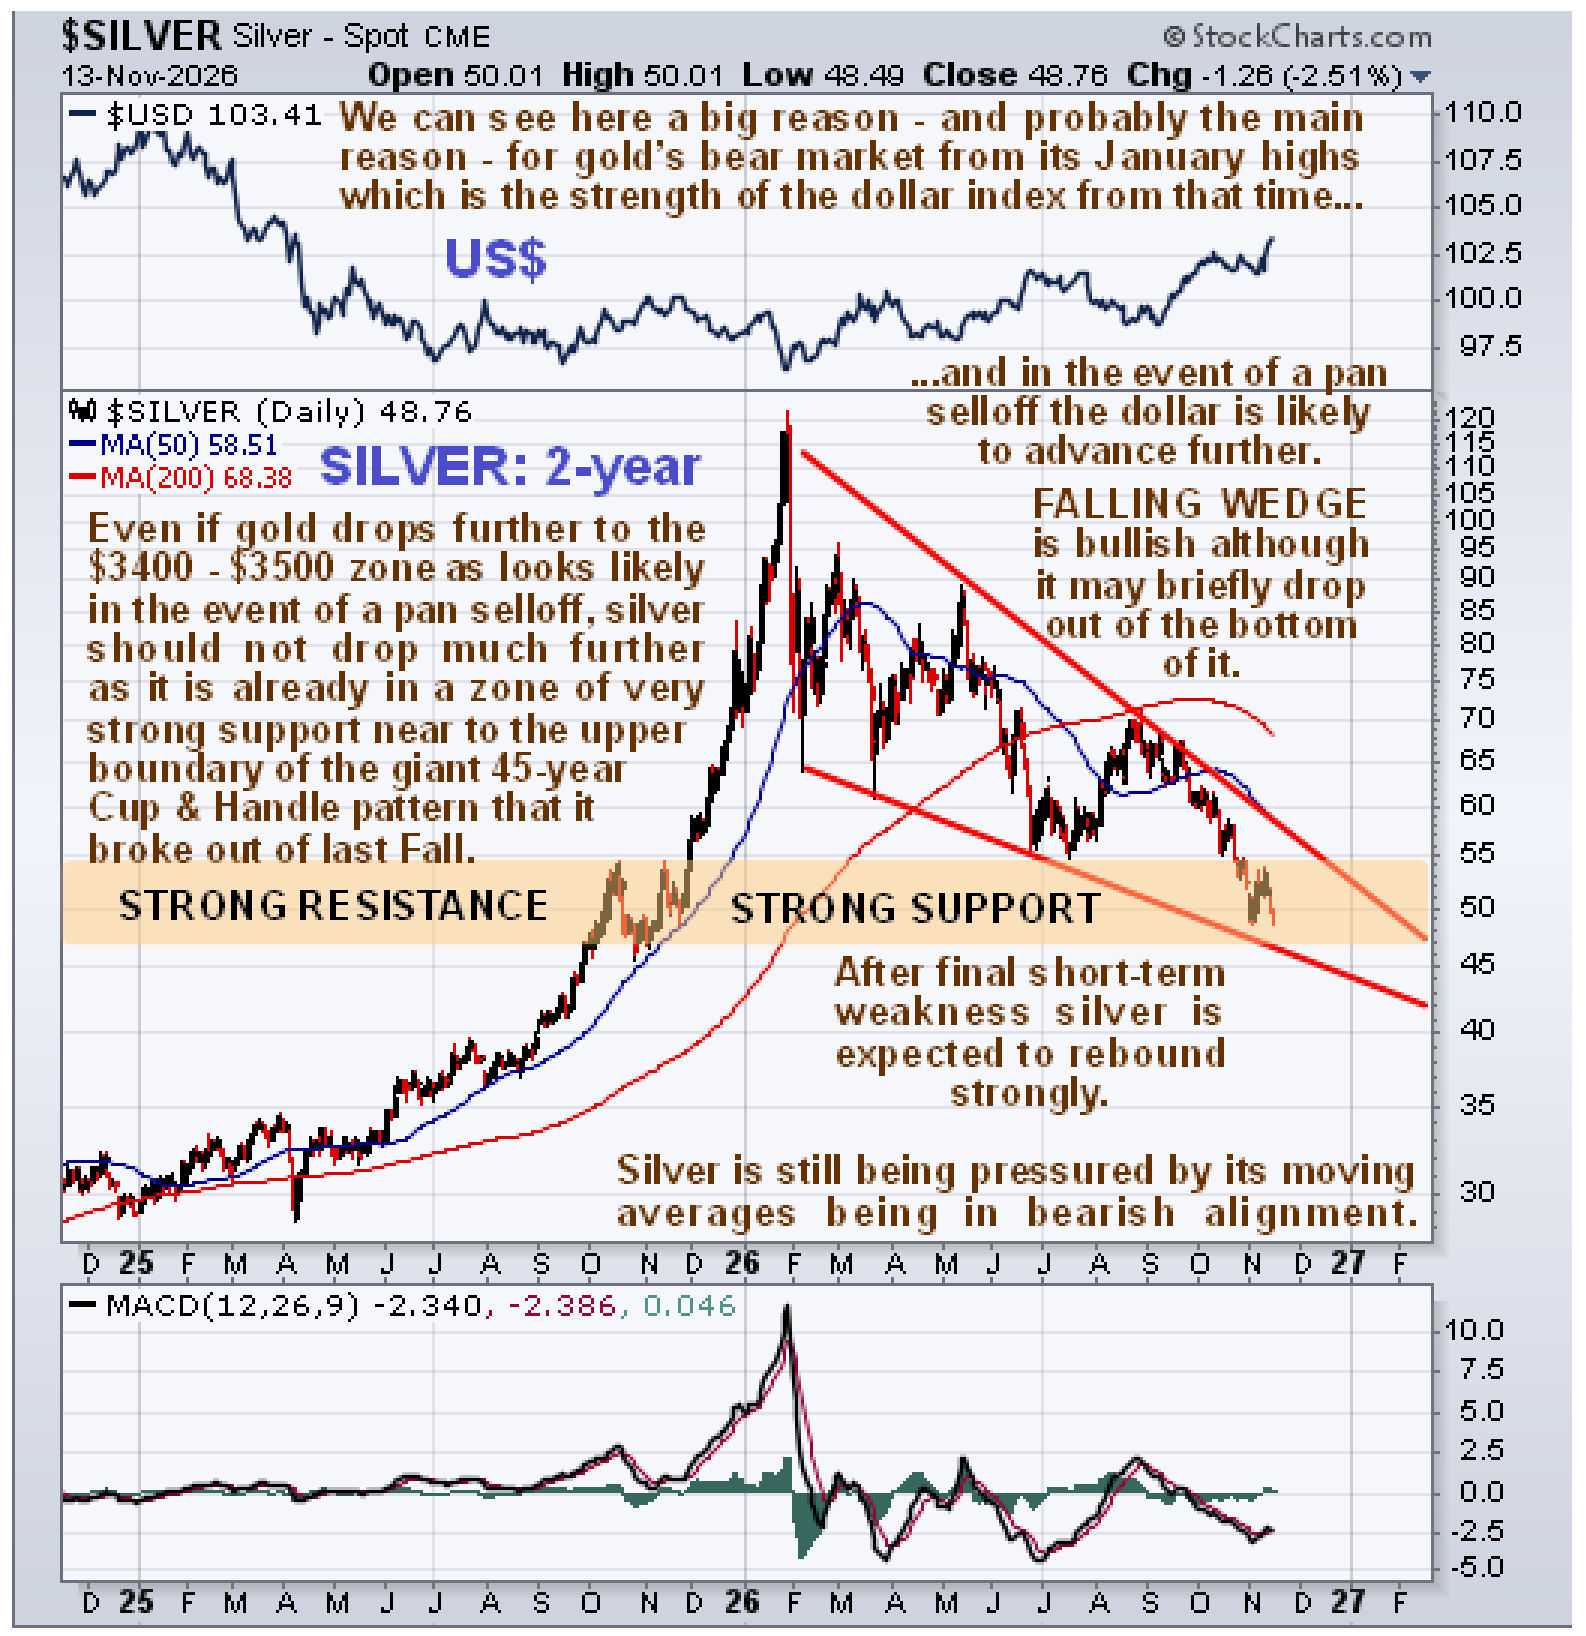
 Silver is already in a zone of very strong support near the upper boundary of the giant 45-year Cup & Handle pattern that it broke out of late last year, so it is not expected to drop all that much, although it could temporarily drop below the lower boundary of the bullish Falling Wedge downtrend shown on its 2-year chart below. It is important to note that this very strong support means that, as soon as the pressure from the pan selloff comes off, silver can be expected to bounce back strongly, like a beachball pushed underwater, probably greatly assisted by a short covering panic.
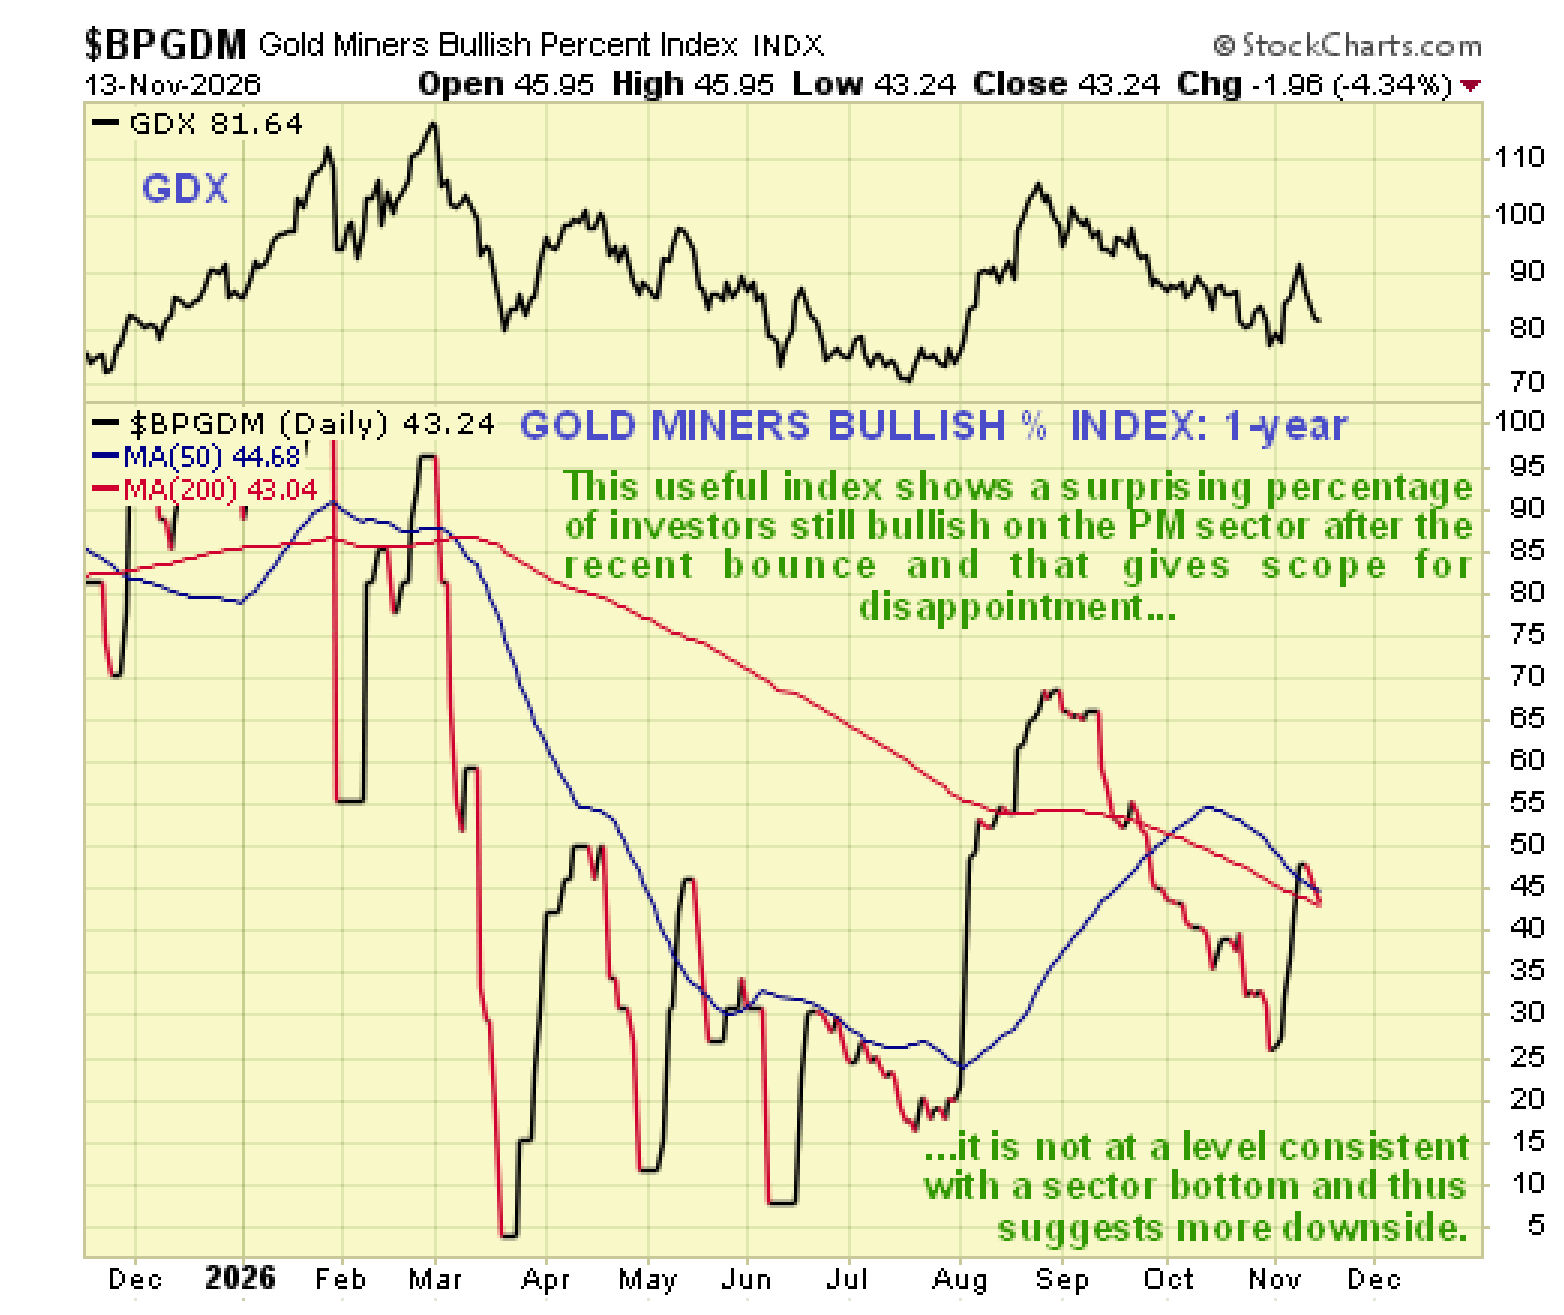
 Meanwhile, the Gold Miners Bullish % Index shows a surprisingly high level of bullishness for this setup that is not consistent with the sector being at a bottom – we need to see investors “throw in the towel” as they did at the low last March, and even that wasn’t the final low for the downtrend.
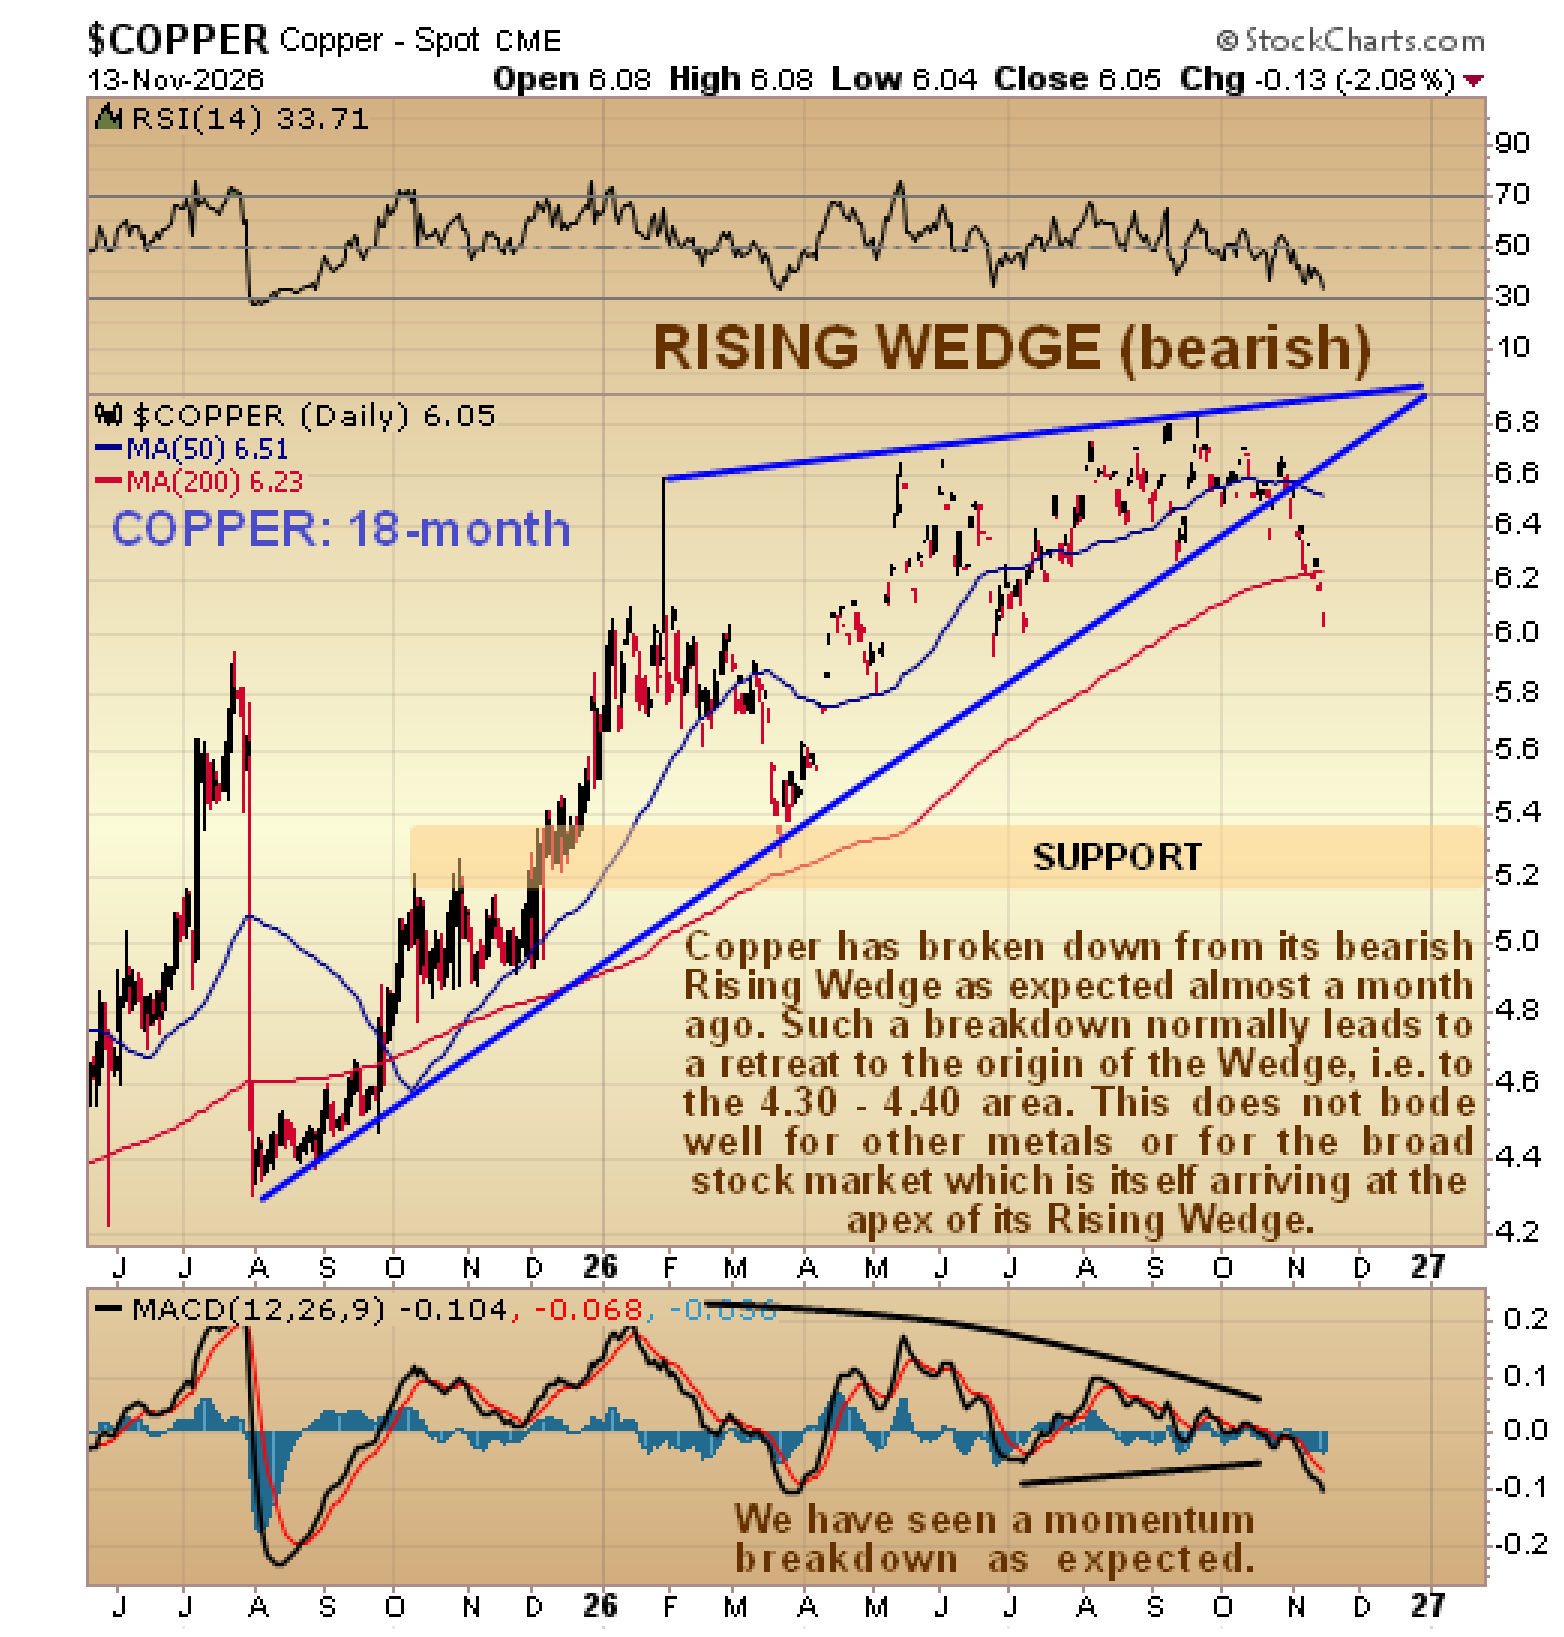
 The copper chart indicates a high probability that a pan selloff will occur soon, which is a reason why we are looking at it here. A breakdown by copper from a large bearish Rising Wedge was predicted on the site in a copper update back on 19th October and it has already occurred as we can clearly see on its latest 18-month chart below and this breakdown has been accompanied by a momentum breakdown. Copper is now in position to drop hard or plunge, initially back to the support shown in the 5.20 zone. Given copper’s predilection for forecasting economic activity, this looks like a warning for the economy at large.
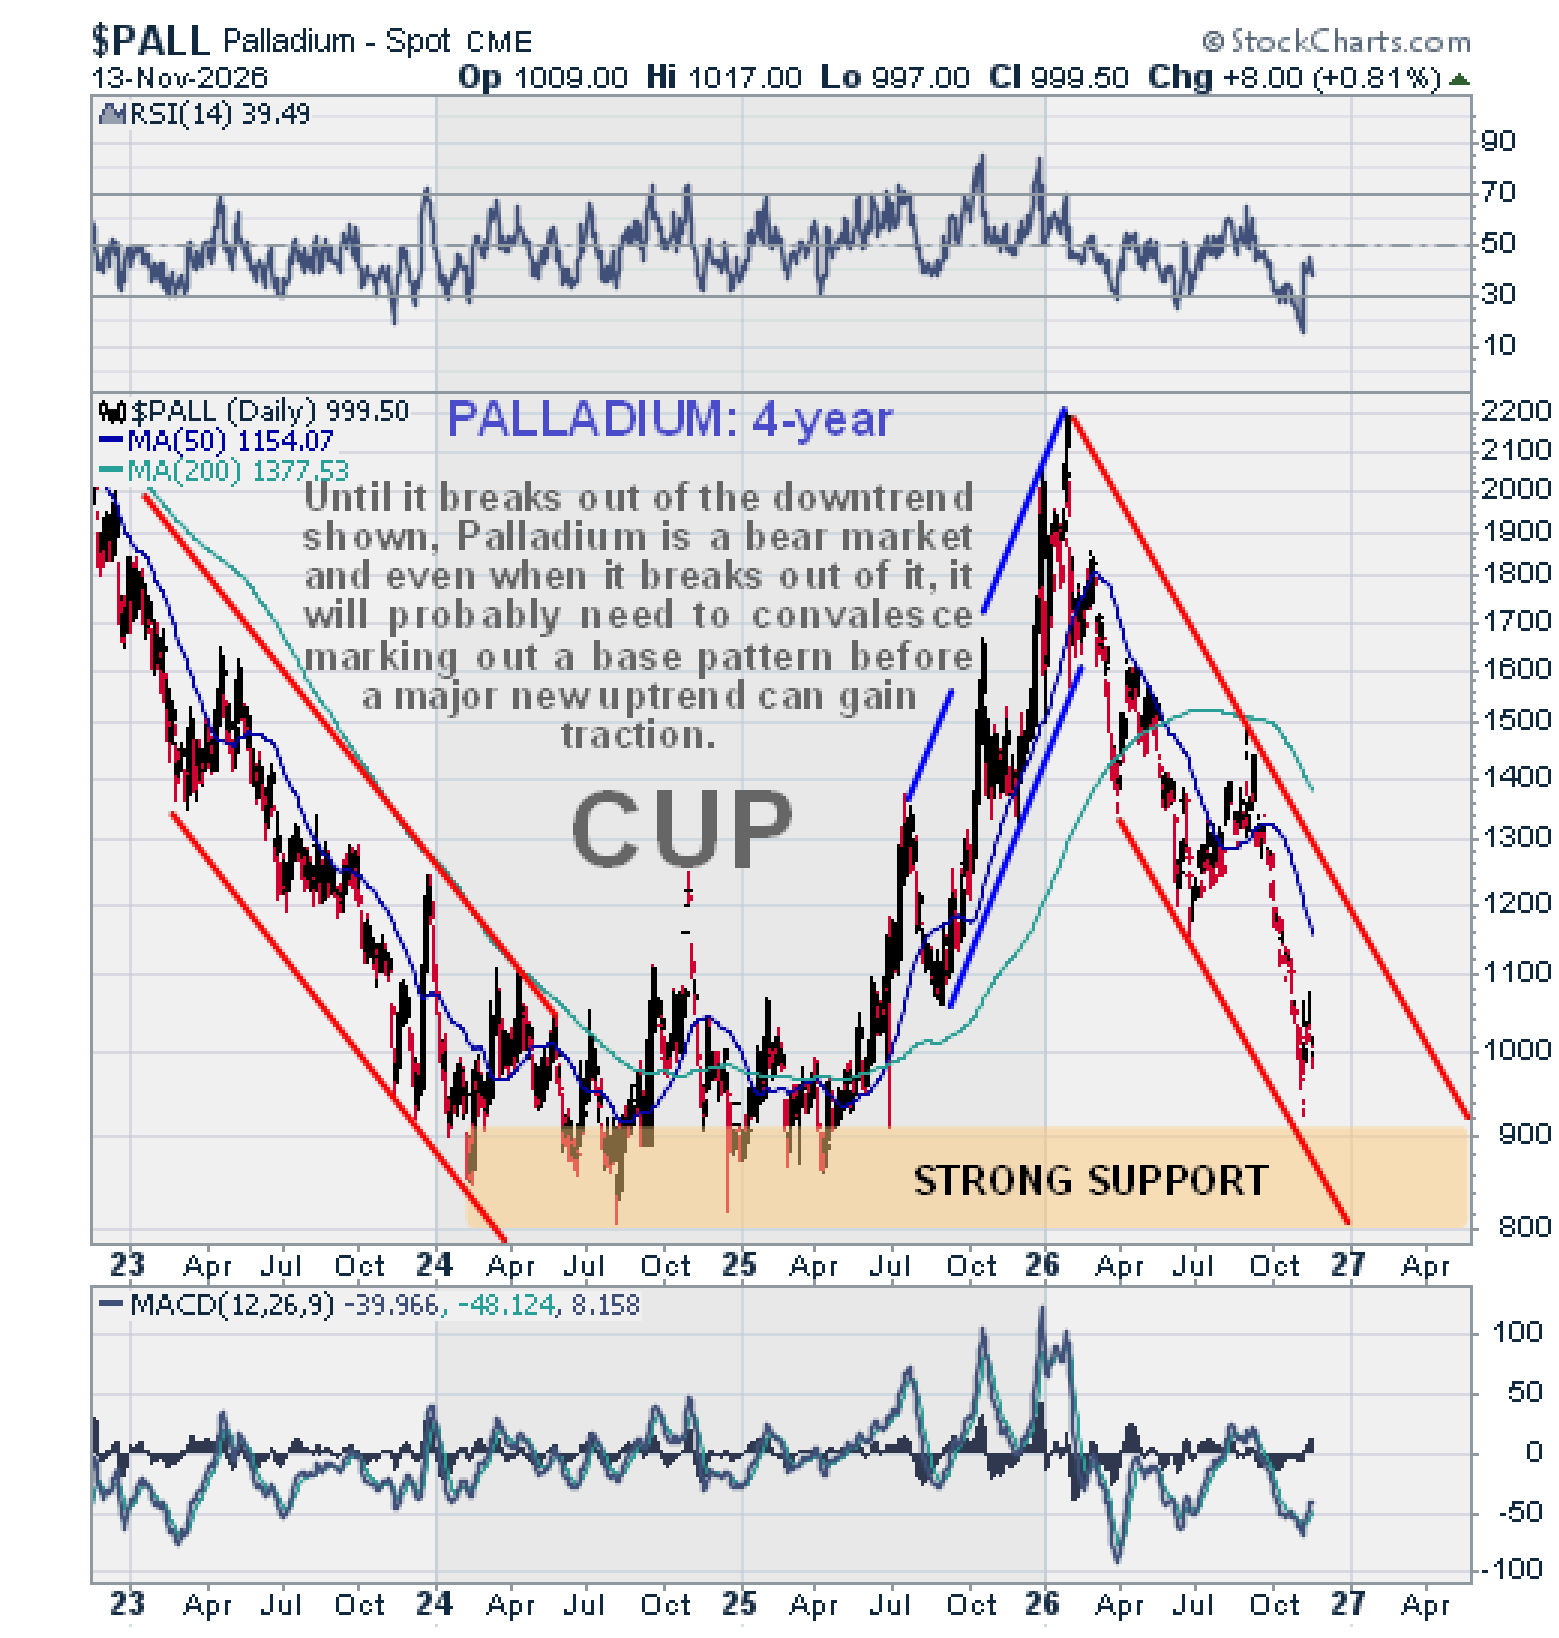
 Palladium meanwhile remains in the steep and steady downtrend that began from its January highs as shown on its 4-year chart below. However, this downtrend has been going on for a long time and it has brought the price down close to a zone of strong support roughly in the 800 – 900 zone. Whilst it can be expected to dig into this support of course in the event of a pan selloff and could even break below it, once the worst of the selloff has run its course it should be a buy again in this area, although after such a severe downtrend it will probably need to spend a considerable period of time basing before a sustainable new uptrend can become established.
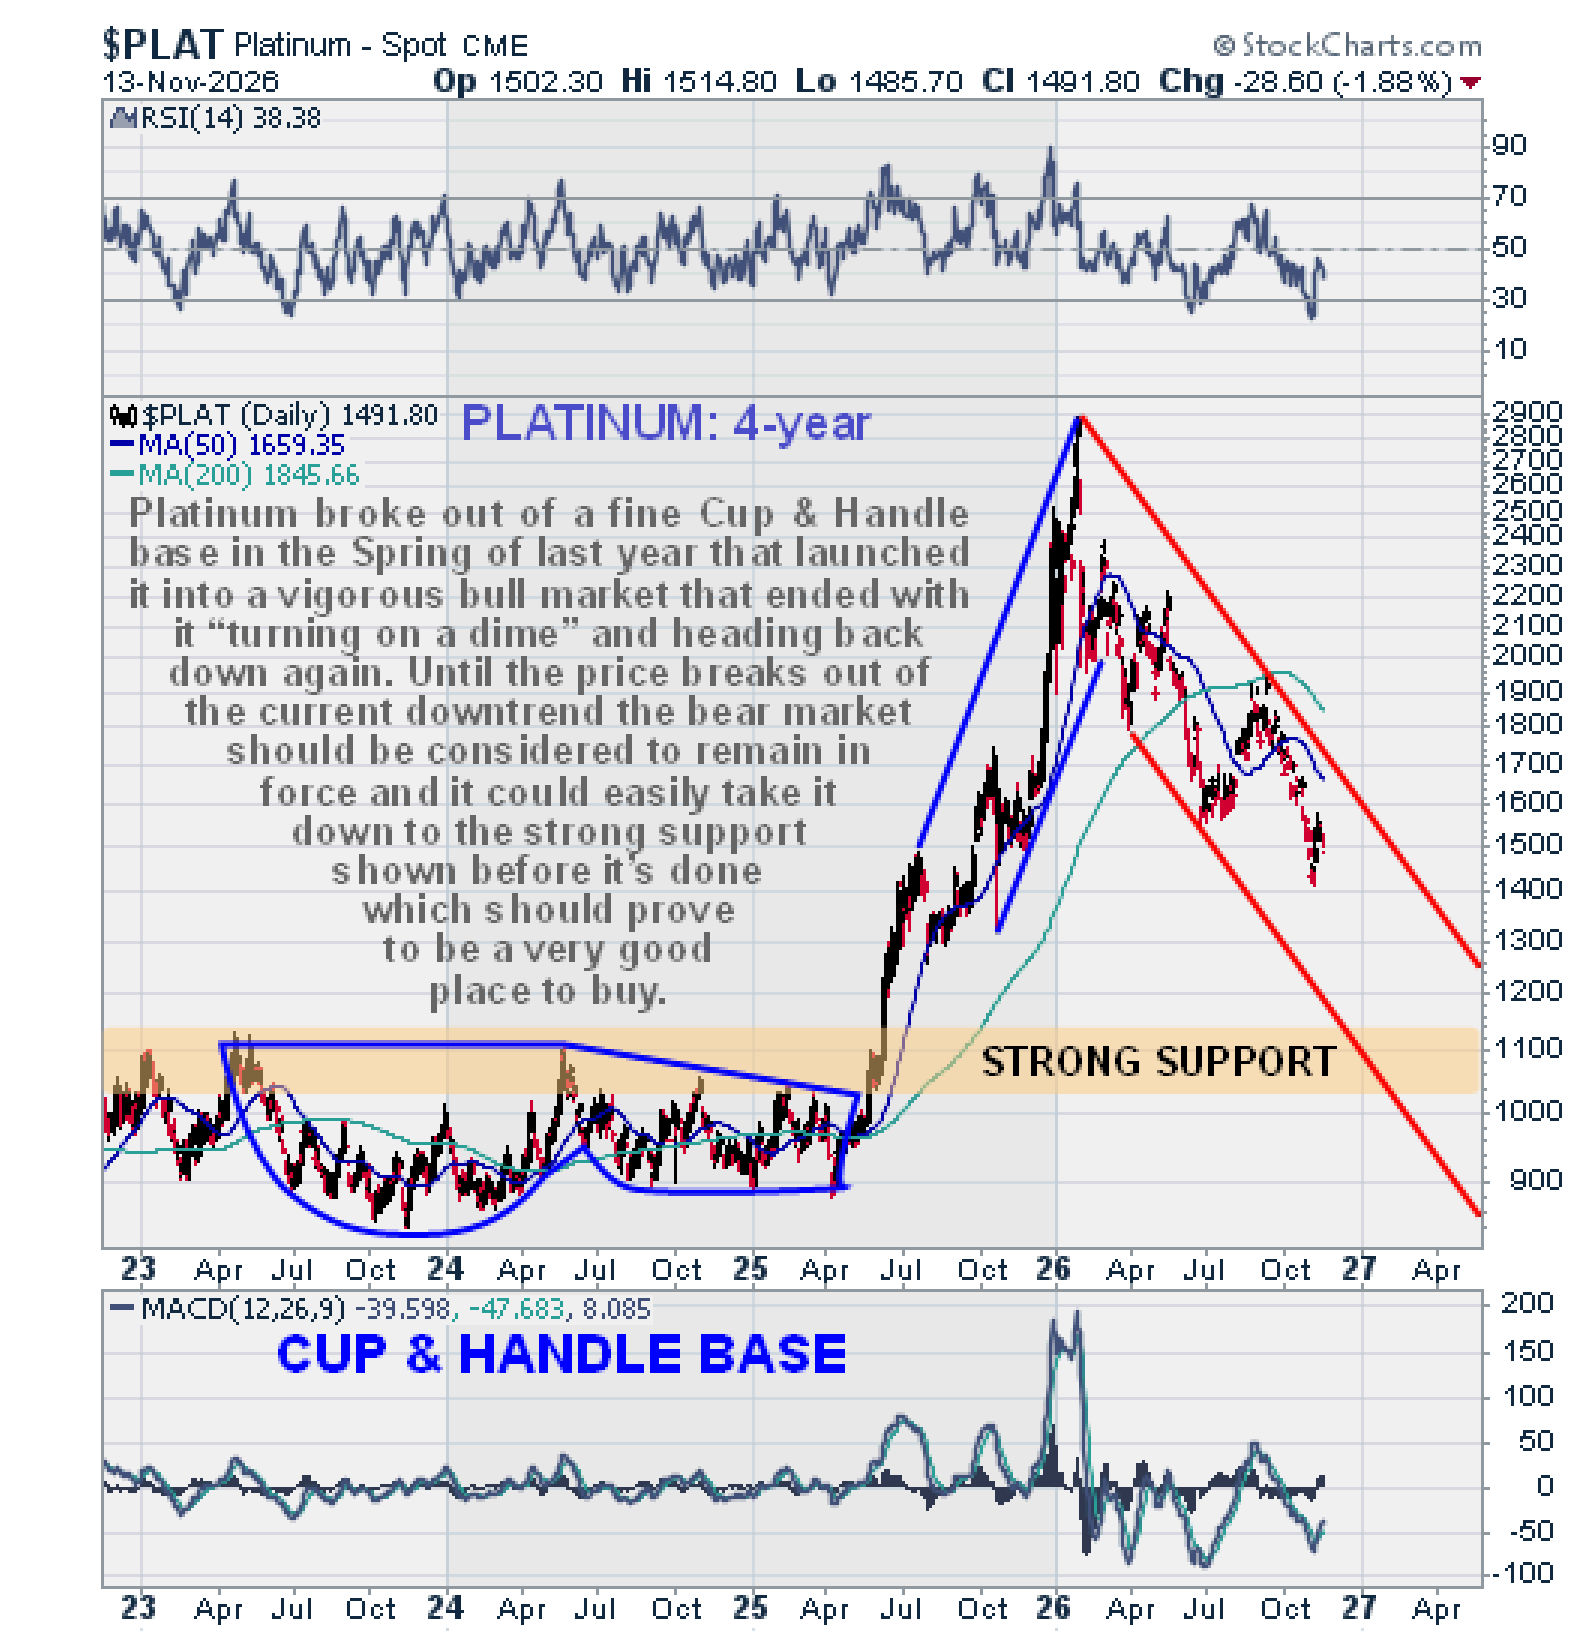
 Platinum has also been in a bear market from its January highs and it remains a bear market as long as it is still within the downtrend shown on its 4-year chart below. A likely target in the event of a pan selloff is the strong support roughly in the $1020 - $1120 zone which arises from trading in the upper part of the giant Cup & Handle base that formed from the Spring of 2023 through the Spring of 2025.

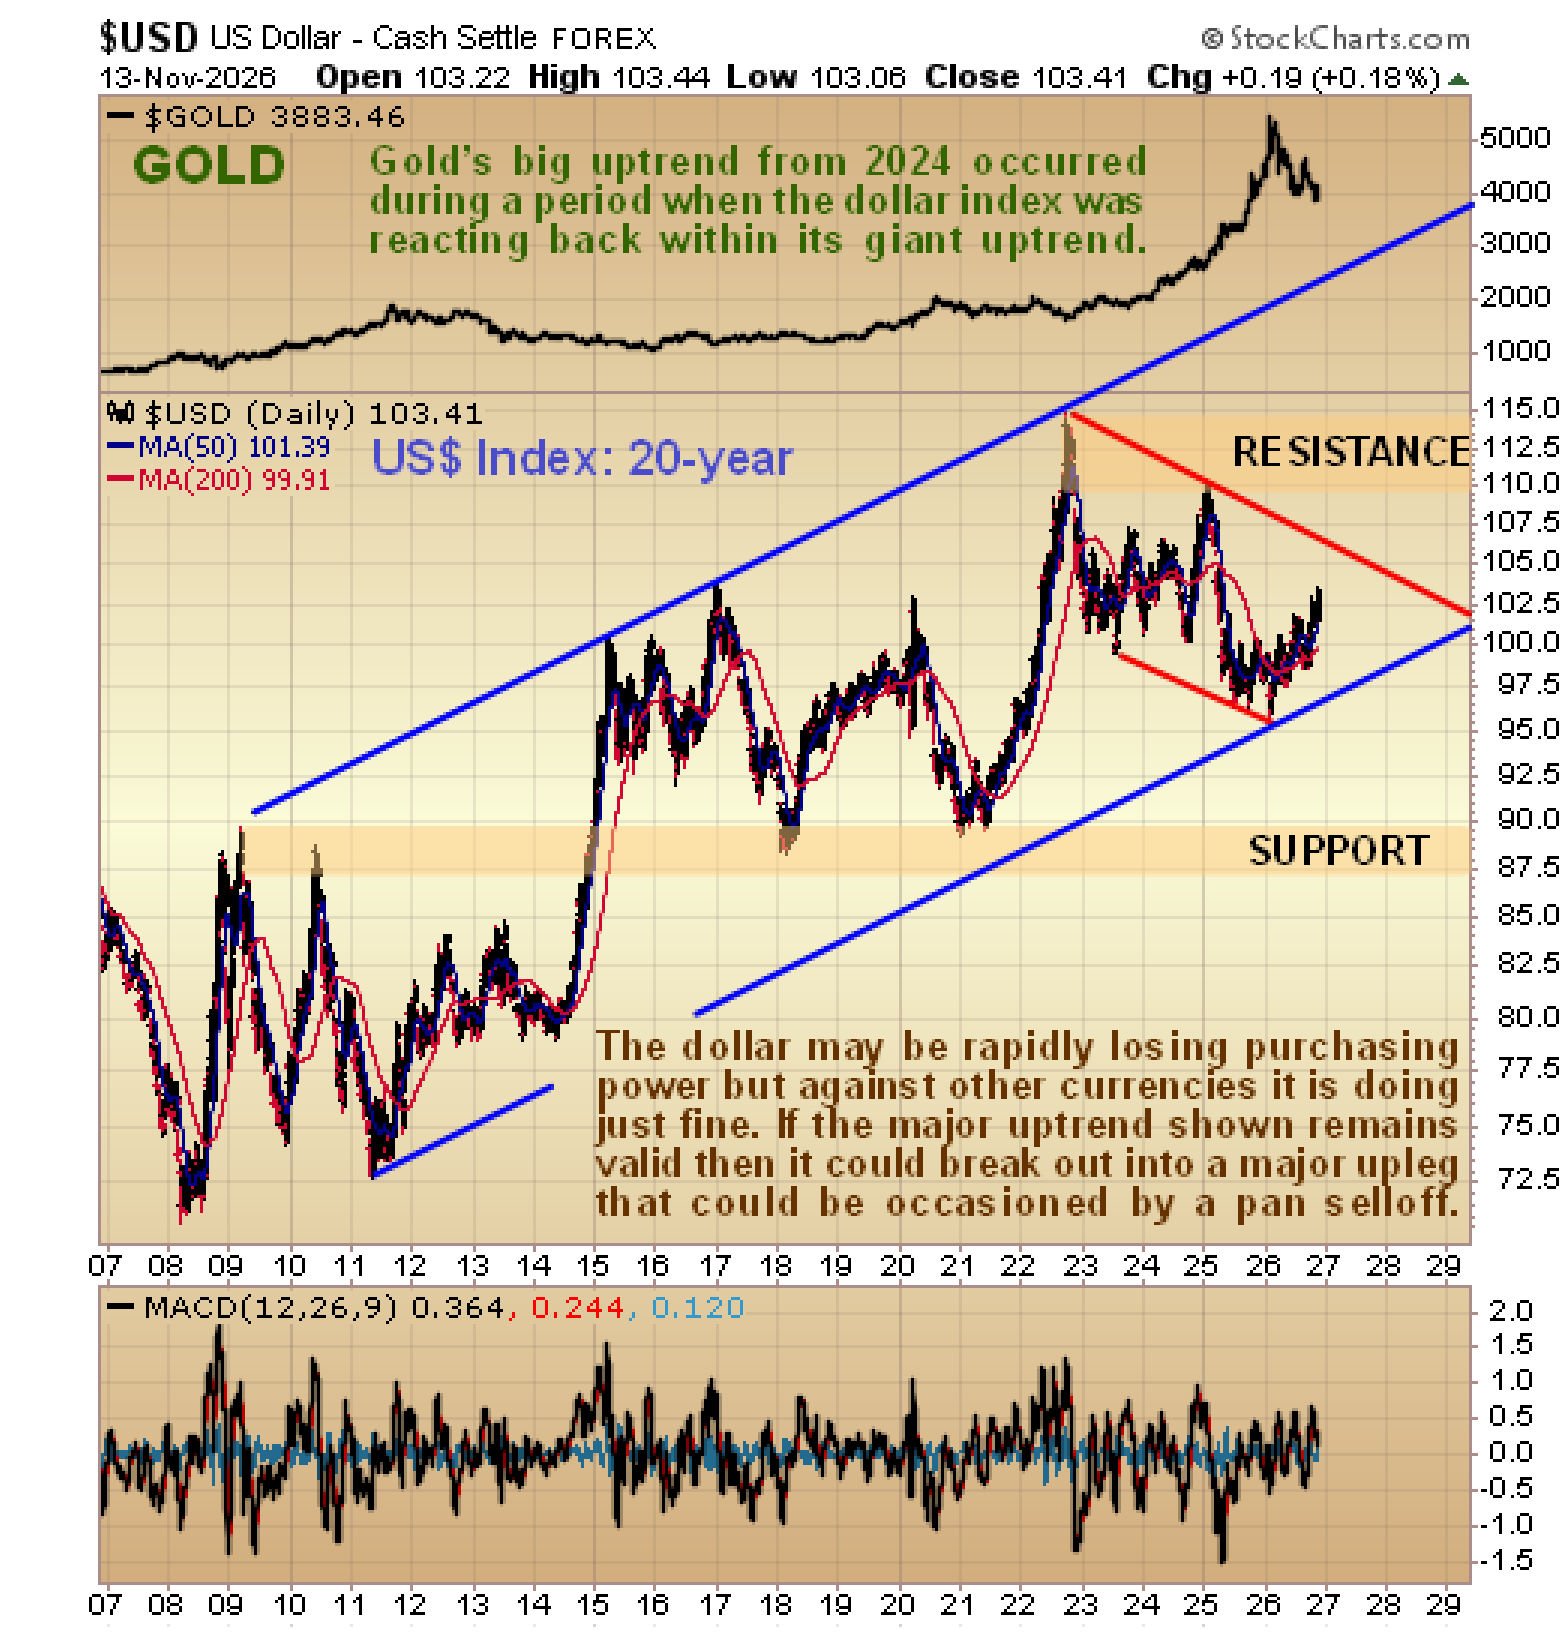
The 20-year chart for the US dollar index provides useful insights. On it we can see that, although the dollar is losing purchasing power rapidly in common with most all currencies, measured against a basket of other currencies, especially the euro, it has been faring quite well. Observe how gold’s major bull market in 2024 and 2025 occurred while the dollar index was correcting back across a major broad uptrend channel that dates back to 2011. This chart suggests that the dollar could remain “King of Hell” for quite some time and if we do see a broad-based asset liquidation in a pan selloff, then it could break out of its corrective downtrend and run relatively quickly towards the upper rail of the major uptrend.
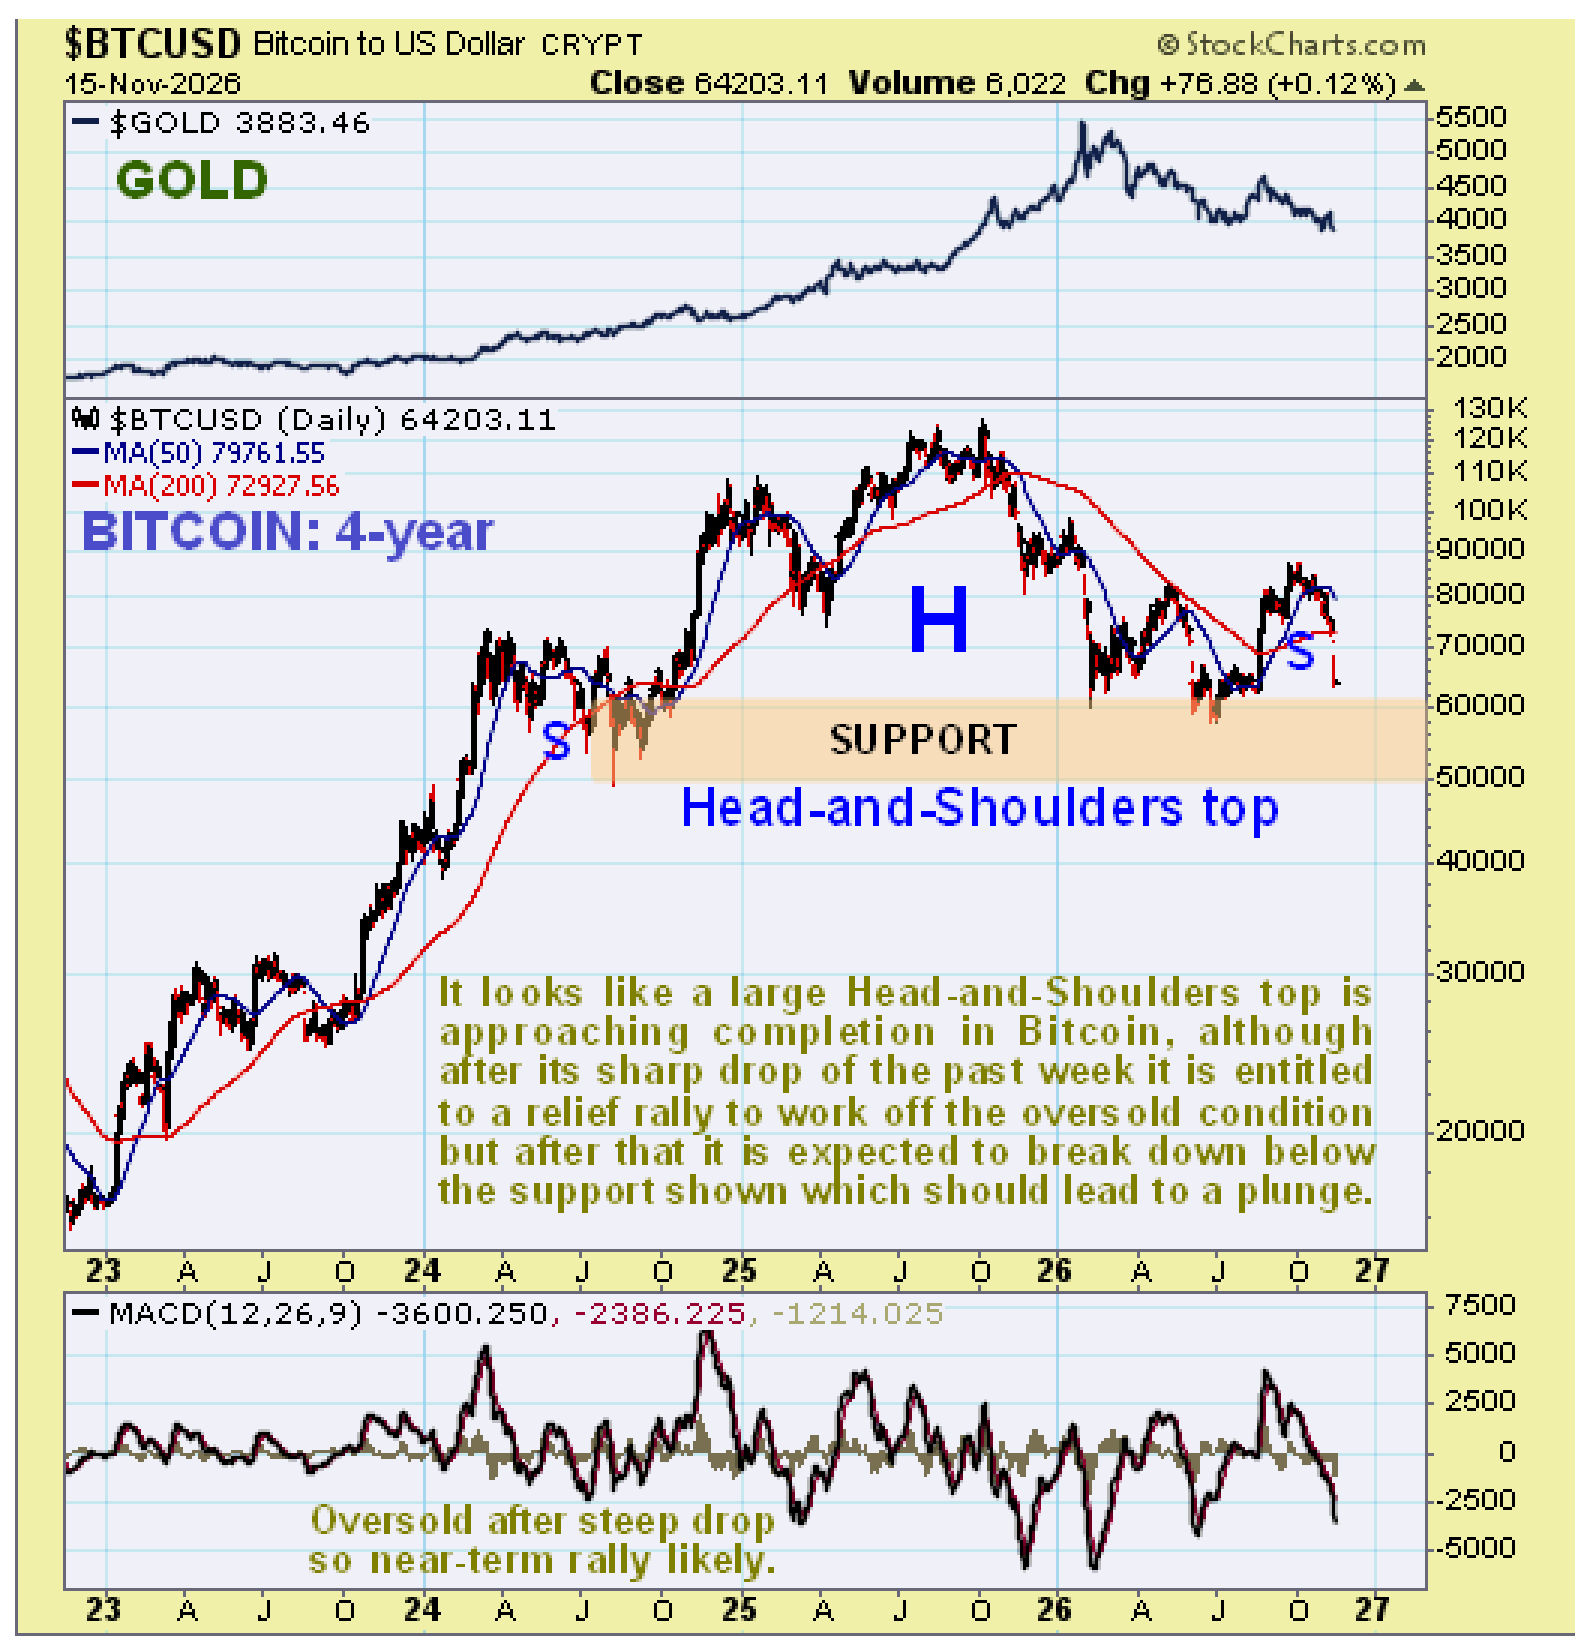
 We will end with a “bonus” chart for Bitcoin. On Bitcoin’s 4-year chart we can see that what looks like a giant Head-and-Shoulders top has been building out since early 2024. It has dropped sharply over the past week to become oversold, so it is entitled to a short-term bounce to work off this oversold condition. Beyond that it looks like this top pattern is approaching completion and so it is expected to go on to break down below the band of support roughly between $50,000 and $60,000 and once that happens it will probably drop away quite steeply. It is therefore viewed as a sell on any short-term rallies.
 Conclusion: the charts that we have looked at in this article suggest that a brutal pan selloff is likely to occur soon, meaning a selloff that takes down most everything. Evasive or defensive measures are therefore in order, although it is not thought best to sell any physical gold or silver that you may possess, especially as they will be among the first things to bounce back. More than this, we will be looking at ways to capitalize on the setup going forward, involving the use of inverse ETFs and options, and will be on the lookout for the bottom in gold and silver before it arrives.
About the author
