
The Fed has for over 100 years been the center of controversy. It has its good points and bad. There are those who want to shut it down but offer no alternative. Love it or leave it the Fed has been at the center of things throughout its 111 years history. The Fed helped create an entire industry known as Fed watchers. What is the Fed going to do? The Fed is at the center of central banks worldwide and therefore the most influential. The Fed has been blamed for success in the economy and also for events that have befallen the economy such as the Great Depression and the Great Recession.
Gold has been central with the Fed as they continue to hold the world's largest gold reserves even as the gold standard ended back in 1971. Since then money, debt and markets have exploded to the upside bringing on a whole new set of problems. Today given all the uncertainty central banks everywhere particularly outside the EU, and North America are loading up on gold. And that is one of the prime reasons gold is embarking on what potentially could be a multi-year bull market ala 1971-1980 and 2001-2011. With an increased average realized gold price, Lundin Gold Inc., for example, has reported year-over-year higher revenues and free cash flow, pays a dividend, and is held in the Enriched Capital Conservative Growth Strategy.*
Canada came out with its April job numbers and they blew the "socks" off everyone. We managed to slip in Canada's job numbers as the chart of the week.
Our review of markets centers on the S&P 500 and gold as both chug higher. But the broader markets are showing topping action while gold is showing potential long term bullish action. Our Markets and Trends table follows at the end.
Have a great week!
DC
* Reference to the Enriched Capital Conservative Growth Strategy and its investments, celebrating a 6-year history of strong growth, is added by Margaret Samuel, President, CEO and Portfolio Manager of Enriched Investing Incorporated, who can be reached at 416-203-3028 or msamuel@enrichedinvesting.com
I am a most unhappy man. I have unwittingly ruined my country. A great industrial nation is controlled by its system of credit. Our system of credit is concentrated. The growth of the nation, therefore, and all our activities are in the hands of a few men. No longer a government by free opinion, no longer a government by conviction and vote of majority, but a government by the opinion and duress of a small group of dominant men.
—Woodrow Wilson, American politician, academic, 28th president of the U.S. 1913–1921, president Princeton University, governor New Jersey, led the U.S. through World War I, architect of the League of Nations, expressing his regret in signing into law the Federal Reserve Act (1913); 1856–1924
By this means (fractional reserve banking) government may secretly and unobserved, confiscate the wealth of the people, and not one man in a million will detect the theft.
—John Maynard Keynes, British economist, philosopher, changed theory and practice of macroeconomics and economic policies of governments, school of thought Keynesian economics, author of The General Theory of Employment, Interest and Money (1936); 1883–1946
If the governments devalue the currency in order to betray all creditors, you politely call this procedure inflation.
—George Bernard Shaw, Irish playwright, critic, polemicist, political activist, author of over 60 plays Pygmalion (1913), Man and Superman (1902), Saint Joan (1923), Nobel Prize in literature (1925); 1856–1950
The Federal Reserve system has been controversial over the years. The system was created in 1913 in response to earlier financial panics, banking crises, and general mistrust of banks by the public. The Fed, as it is known, operates independently. Its chairman is chosen by the president but it does not report to the president nor do the decisions of the Fed have to be approved by the president or anyone else.
The Fed is a government agency and its seven members are all approved by the president and the Senate for terms of 14 years. U.S. Congress oversees the Fed and periodically reviews its actions. There are 12 Federal Reserve Banks located in 12 different cities around the U.S. Its current chairman is Jerome Powell, appointed by former president Donald Trump.
The Federal Reserve is the lender of last resort. The Fed is the ultimate supplier of system-wide reserves to the financial system and can satisfy sharp increases in reserve or liquidity demand, thereby preventing systemic liquidity shortages and de-stabilizing the financial system.
The Fed has been both good and bad. The good, as noted, is its role as lender of last resort and its ability to provide reserves and liquidity to the financial system to prevent any systemic collapse. The Fed has both public and private characteristics. Private, as the stock of the Federal Reserve is owned by member national banks as all are required to become members of the Federal Reserve. Public, because it is an independent government agency.
There are similarities with central banks around the world, although there are also many differences between them. The key central banks include the Bank of England (BOE), Bank of Japan (BOJ), European Central Bank (ECB), Deutsche Bundesbank (DB), Banque de France, Swiss National Bank (SNB), Bank of Italy, People’s Bank of China (PBOC), Central Bank of Russia (CBR), Reserve Banks of Australia and New Zealand, and Bank of Canada (BofC). There is even a central bank’s central bank—the Bank for International Settlements (BIS) headquartered in Basel, Switzerland. The most powerful central banks are the Fed, BOE, BOJ, ECB, BofC, and the outlier, PBOC.
The Fed has often been at the center of numerous criticisms—its fractional reserve banking, contribution to economic cycles, lack of transparency, role in numerous economic downturns, including the Great Depression (1929–1939) and the Great Recession (2007–2009), and undue influence from private interests. There have always been calls about its role, its policies, and the need for reform. There have been calls for its abolition and a return to the gold standard. One of its controversies is that the Federal Reserve Act was originally drafted in 1910 at the ironically named Jekyll Island, Georgia by a Republican senator and a number of influential Wall Street bankers. Private Wall Street interests wanted a central bank under their control, whereas president Woodrow Wilson wanted a decentralized agency under public control.
Today, there are certain politicians who would like put the Fed under their control or abolish it all together. It has been well reported in publications, including The Wall Street Journal (www.wsj.com), that the Fed’s independence is to be gutted and put mostly under political control. The Fed is data-driven in its decision-making. Becoming politically driven would end its independence and be potentially devastating, particularly to the U.S. dollar. The Fed is central in the global monetary system and its removal could trigger global economic and financial turmoil. To a lesser extent, the same would hold true in other countries as well, including Canada.
The Fed’s action in markets intensified after the 1987 stock market crash. Its presence was felt during financial crises such as the 1994 bond market crisis, the 1997 Asian financial crisis, the 1998 Russian ruble and banking crisis, the 2002 dot.com crash, the 2008 global financial crisis, and the 2020 pandemic. Each one of these crises sparked a further round of interest rate cuts, coupled with liquidity injections that became known as quantitative easing (QE) during the 2008 global financial crisis. All the financial crises to some extent or another involved all the major central banks coordinating their monetary activities to prevent a financial meltdown. Each crisis spawned more and more debt plus an expansion of the money supply.
As we have noted, money and debt have exploded since the world came off the gold standard in August 1971. As the chart below shows, global money supply (M2) has exploded some 60,394% since 1996. Global debt has also exploded for both governments, corporates, and households.
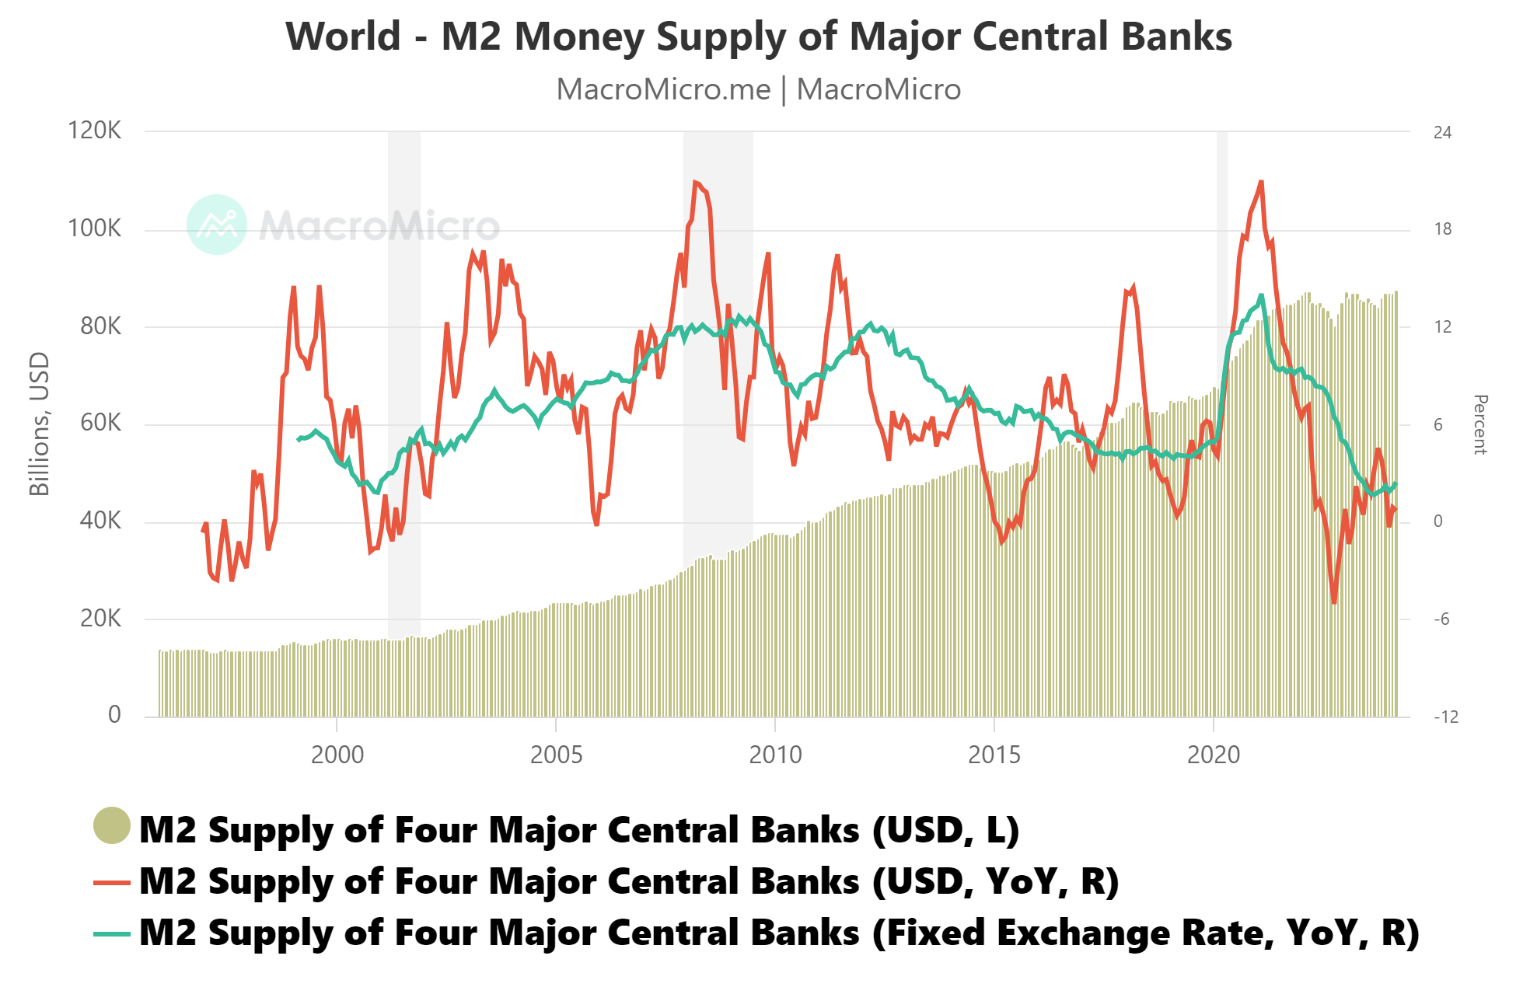
Source: www.MacroMicro.me
Global debt today is estimated at around $313 trillion and is probably higher. In 1970, global debt was roughly $1 trillion and gold was at $35. Today, gold is trading at $2,300. In particular, debt growth has been seen in emerging and developing countries. Making it worse is that these countries borrowed in U.S. dollars. If the U.S. dollar is rising against major currencies, it is rising even faster against the currencies of emerging and developing countries. What that means is their revenue is a depreciating currency while their debt payments are in a strengthening currency, the U.S. dollar, requiring more and more of their own currency to pay U.S. dollar debt. These countries now need to reduce spending to lower their dependency on debt. That means cutting health care, education, and social protection, leading to social unrest or even civil war or revolution.
Despite the woes of emerging and developing countries, the biggest share of debt is held by the U.S. itself. As we have often noted, the U.S. today holds some 32% of global debt. The U.S. federal government alone holds some 11% of global debt. The fear is if another global financial crisis hit, the Fed and the world’s central banks have become ill-equipped to deal with it again. The proverbial “between a rock and hard place” situation.
The chart below shows global debt as a percentage of GDP. In 1970, it was around 100%. Today it is around 287%. The chart only goes to 2022 where the global debt to GDP was estimated at 238%.
Global Debt to GDP 1950–2022 %
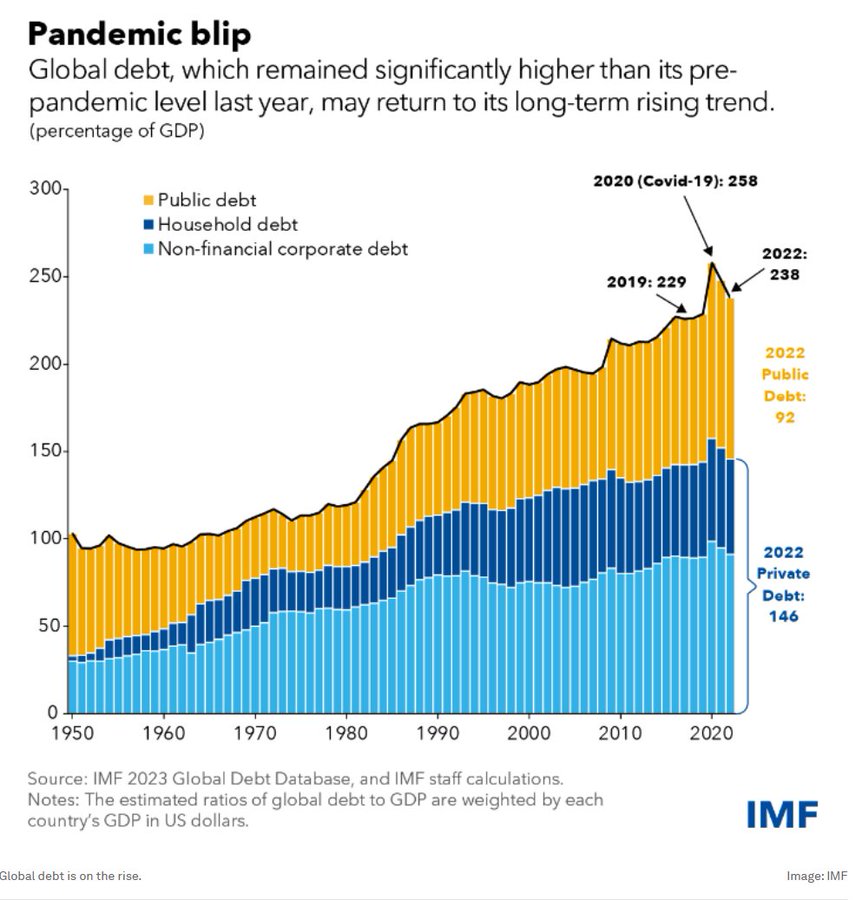
Source: www.imf.org
Gold Rises as the Debt Rises
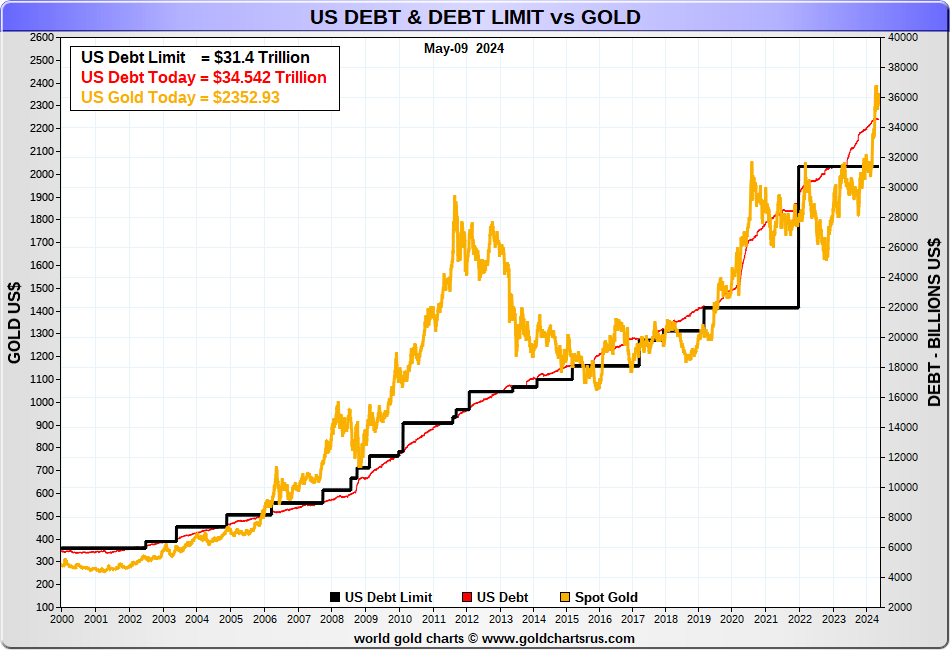
Source: www.goldchartsrus.com
In a financial crisis, the Fed’s toolbox contains largely the ability to lower interest rates through the Fed funds rate and inject billions in liquidity, either through open market operations or QE into the financial system in order to stop a systemic financial collapse. Governments also need to provide the appropriate fiscal stimulus as well. As to interest rates, the Fed can only influence the short end of the market and it is the market itself that influences the long end of the yield curve. A prime example is mortgages, which are priced off the long end of the yield curve.
Today, the financial system has risks coming from many different angles—housing, commercial real estate, rising bankruptcies, the potential for a collapse in the banking system, the potential for a sovereign debt collapse, a currency crisis. That is not to lessen the potential risks from war, both military and trade. The world is already seeing deglobalization and the potential for more trade wars with tariffs. Sanctions are just another form of trade wars and, while aimed at particular people, institutions, and countries, they reverberate back against the countries applying sanctions, hurting some countries more than others. Those applying sanctions (primarily the U.S.) don’t get off scot-free. There is a cost in inflation, disruption of supply lines, and higher costs due to onshoring instead of offshoring.
De-dollarization is another problem. With the U.S. dollar as the world’s reserve currency, the U.S. controls the levers of the world’s financial bodies such as the IMF, the World Bank, the World Trade Organization (WTO), and the global payments system known as SWIFT. With sanctions expanding particularly on Russia, Iran, and others, the search for alternatives to the IMF, World Bank, and SWIFT has been ongoing. The WTO, along with the United Nations (UN), have in fact become toothless and dysfunctional due to global geopolitical dysfunction. That and de-dollarization are being met by a huge increase in the demand for gold to back their currencies.
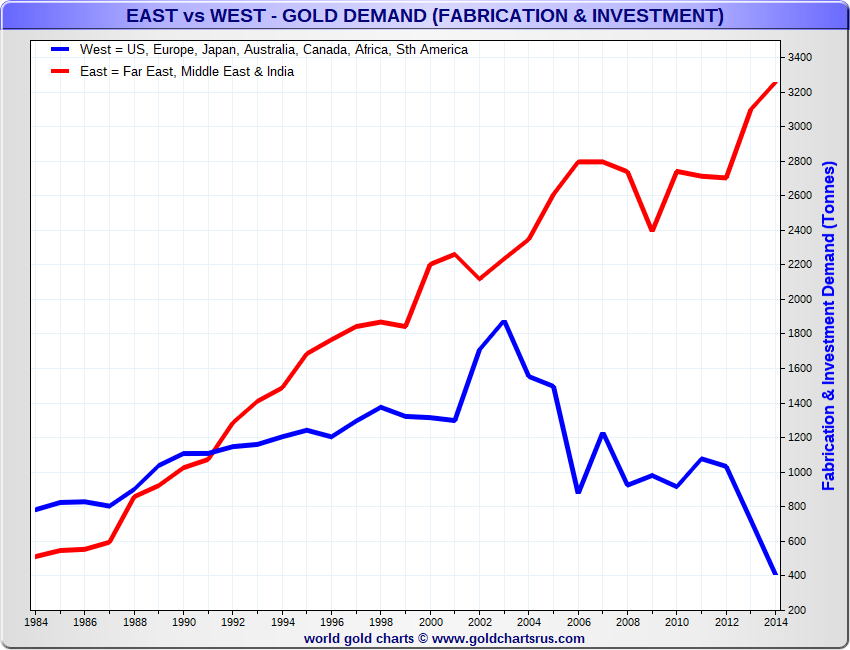
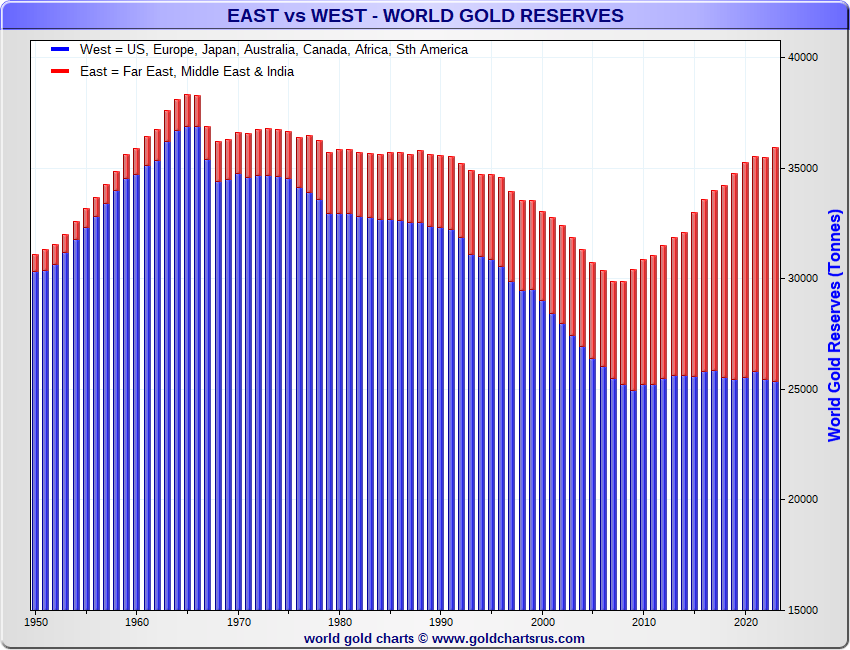
The demand for gold has exploded, particularly from BRICs members and countries in the Middle and Far East. It is another form of economic warfare between the East and the West. Demand has soared in the Far East while it has fallen in the West. The same can be seen with the rise of gold reserves held by the world’s central banks. Russia and China have been two central banks in particular that have added to their gold reserves in order to back their currency (ruble, yuan) with a hard currency (gold). (See charts below East vs. West.) Some other emerging and developing countries have done the same. Russia, led by China, is developing its own version of the IMF, the World Bank, and SWIFT in a move towards de-dollarization. This poses a threat to the global world order dominated by U.S. hegemony. In the past, countries went to war when challenged economically. This was especially true for World War I and may be playing a role in today’s proxy wars and economic sanctions.
The result is not a surprise—that gold has made a potential multi-year breakout. If correct, this is the third big cyclical wave up since the world was taken off the gold standard in August 1971. The first wave lasted from 1971–1980 and saw gold rise almost 2,100%. The second wave lasted from 2001–2011 as gold rose 763%. A similar rise today (range) could see gold move to anywhere from $7,700 to $21,900 but not in one year. Based on today’s U.S. money supply to the U.S. gold reserves, for gold to be fully backing the U.S. monetary base, gold would need to be priced at $22,500. Seems incredible.
The monetary base is defined as the total amount of money created by the central bank. This includes the total currency circulating in the public, plus the currency that is physically held in the vaults of commercial banks, plus the commercial banks' reserves held in the central bank. The monetary base is a portion of M1.
Source: www.goldchartsrus.com
Source: www.goldchartsrus.com
The Fed has a problem in the event of another global financial crisis. But then so does the world. The proverbial rock and hard place.
Gold 1970-2024
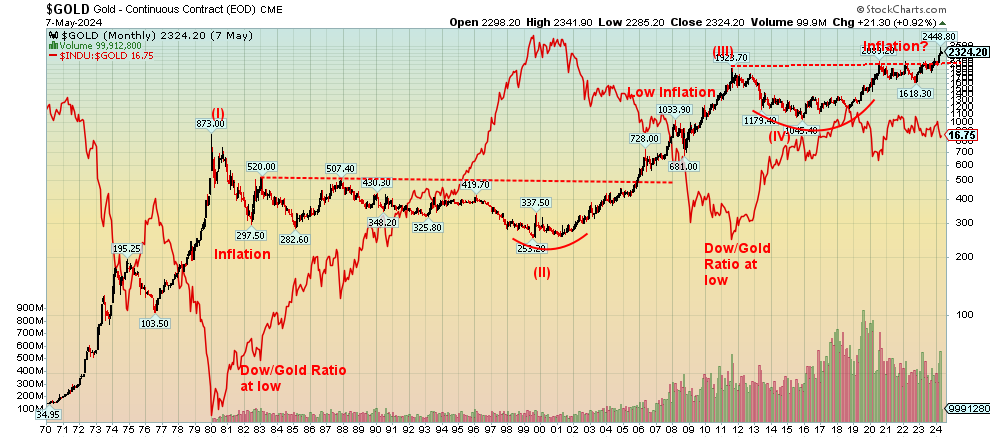
Source: www.stockcharts.com
Since the gold standard ended in August 1971 gold has gone through two huge up cycles – 1971-1980 and 2001-2011. In between gold languished primarily in a bear market with occasional forays to the upside. Given we have now broken out of what appears as a based formed between 2011 and 2023 gold may be embarking on a third long-term wave to the upside. As before this up wave could last for years before hitting its peak. If correct that could translate into huge gains for gold related stocks including silver and ultimately result in the return of the morbid depressed junior gold mining market. An interesting period could well be upon us particularly given that the previous two periods were periods of economic and geopolitical upheaval.
Canada Job Numbers
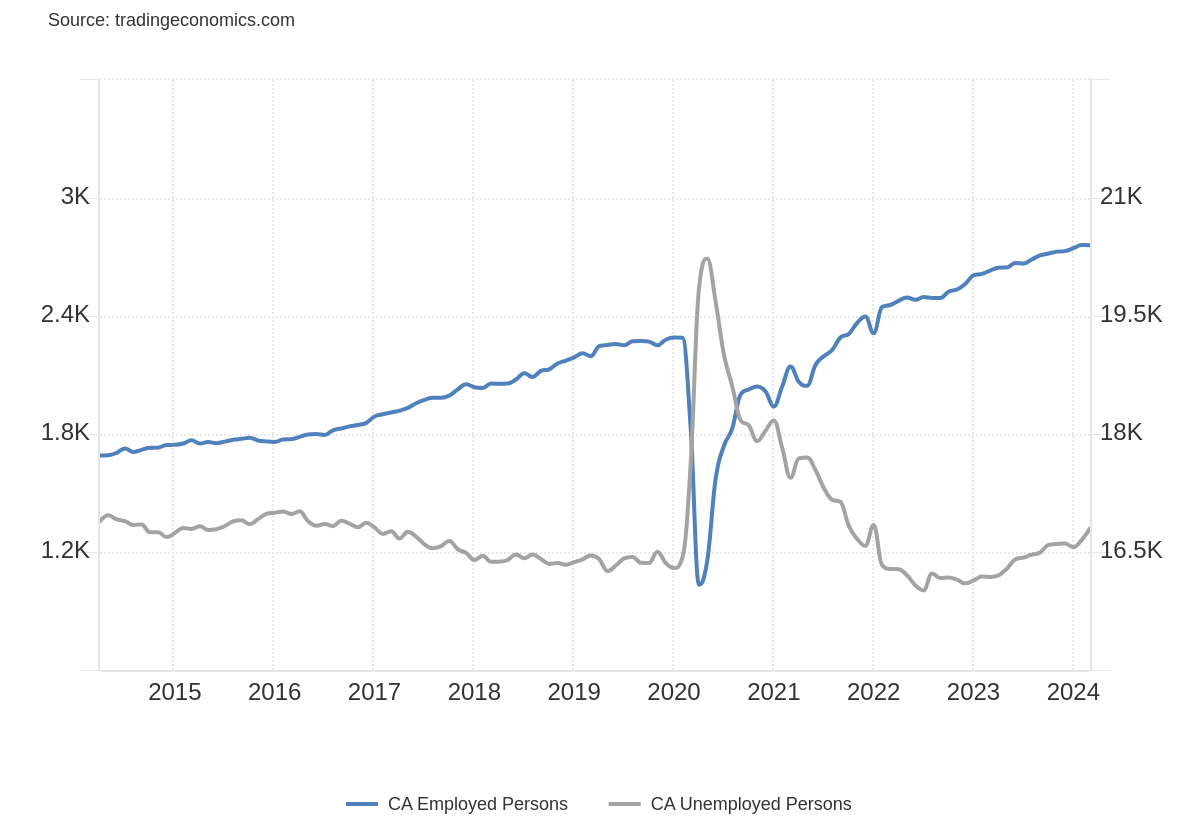
Source: www.tradingeconomics.com, www.statcan.gc.ca
It was a complete surprise. Canada’s employment increased by 90,400 in April. The market had expected only 15,000-20,000. Seems incredible that they could be so far off. But some perspective here. While it was heartening to see 40,100 full-time jobs added, the remainder 50,300 were part-time jobs. Nonetheless, the response was quick as Canadian interest rates backed up with the 10-year Government of Canada bond (CGB) going from 3.68% last week to 3.73% this past week. It also seemed to end talk of an interest rate cut in June. The two-year Government of Canada bond also backed up to 4.33% vs. 4.21% a week earlier. That pushed the 2–10 spread to negative 60 bp vs. negative 53 bp last week. The Canadian dollar also responded positively to the stellar jobs report, rising to 0.7319 from 0.7307 a week earlier. Earlier in the week the Canadian dollar had fallen lower.
The unemployment rate was unchanged at 6.1%. The R8 unemployment rate (plus discouraged searchers, waiting group, portion of involuntary part-timers), the highest reported by Statistics Canada, actually decreased to 8.4% from 8.8%. Private sector employment rose 50,000 in April while public sector employment was up 26,000. The remainder of 14,400 was reported as self-employment. The labour force participation rate rose to 65.4% from 65.3%. Average hourly earnings were up 4.8% year over year (y-o-y), a rate that is now over the rate of inflation.
As noted, thoughts of a rate cut in June have died down. Key, however, will be the next CPI and PPI numbers. If they soften further (not expected now), then that could increase the odds of a rate cut. All in all, a stellar jobs report and a pleasant surprise.
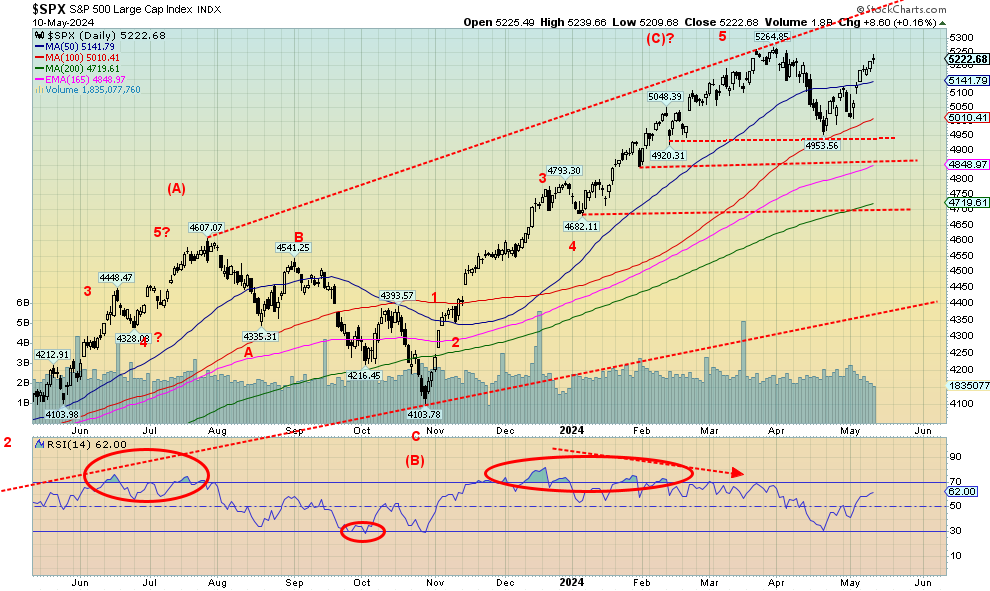
Source: www.stockcharts.com
Stock markets continue to chug higher. New highs would not be surprising. That first wave down for the S&P 500 appears to have unfolded in five-minute waves, suggesting that this could be start of a major decline. But that is just minor wave 1 down. Minor wave 2 up could actually take the S&P 500 and the market to new highs. However, as always, we watch for non-confirmations and divergences.
Thanks to some weak economic numbers this past week, expectations rose once again that the Fed would cut into either June or July. The market has become bullish once again very quickly. Both the All-Bears Index and the All-Bulls Index are pointing to a market that has heated up once again. Options put/call ratios are leaning towards the bulls, while the VIX indicator has quickly moved back into complacency territory. The Bullish Percent Index has turned complacent once again while CNN’s Fear & Greed Index is now neutral.
On the week, the S&P 500 was up 1.9%, the Dow Jones Industrials (DJI) gained 2.2%, the Dow Jones Transportations (DJT) gained 1.6% while still lagging the DJI considerably, and finally the NASDAQ jumped 1.1%. The S&P 500 Equal Weight Index (SPXEW) was up 2.0% and the NY FANG Index gained 1.0%, thanks to a mixed week for the FAANGs. The big winners there were Netflix and Meta, both with gains of 5.4%. Tesla, on the other hand, fell 7.0%. Of the more junior indices, the S&P 400 (Mid) gained 2.2% while the S&P 600 (Small) was up 1.8%. Bitcoin fell 3.7% and is threatening to crack under $60,000.
In Canada, the TSX Composite gained 1.7% to new all-time highs while the junior TSX Venture Exchange (CDNX) was up 2.7%. Overseas, the MSCI World Index was up 2.2%. In the EU, the London FTSE hit new all-time highs, up 2.4%. Joining the London exchange in the all-time highs was the Paris CAC 40, up 3.3%, while the German DAX gained 4.3% but didn’t make new highs. In Asia, China’s Shanghai Index (SSEC) was up 1.6% for fresh 52-week highs. The Tokyo Nikkei Dow (TKN) was flat, but Hong Kong’s Hang Seng Index (HSI) was up about 2.0%.
Bonds wobbled this past week. Initially yields fell and prices rose as price is inverse to yield. The 10-year U.S. treasury note was 4.50% vs. 4.52% last week. The 2–10 spread rose to 38 bp from 31 bp. Bonds were excited about the potential for lower yields and a Fed rate cut.
Next week the market is looking for CPI numbers, expected to be up 3.5%, PPI expected up 2.4%, retail sales expecting a gain of 3.8%, and the NY Empire State Index expected in at negative 8 vs. negative 14.3 the previous month.
We believe this rebound rally is merely a sucker’s rally to bring everyone back in once again. No surprise that volume is tailing off. That is typical of a rebound rally and not the start of a new impulse wave to the upside. Peak volume was just before the recent all-time high for the S&P 500 at 5,265. Breakdown levels remain at 4,900/4,950 with the next break at 4,800/4,850. Under 4,700 it’s all over. In the interim, if you didn’t sell before, you’re getting a second chance.
Source: www.stockcharts.com
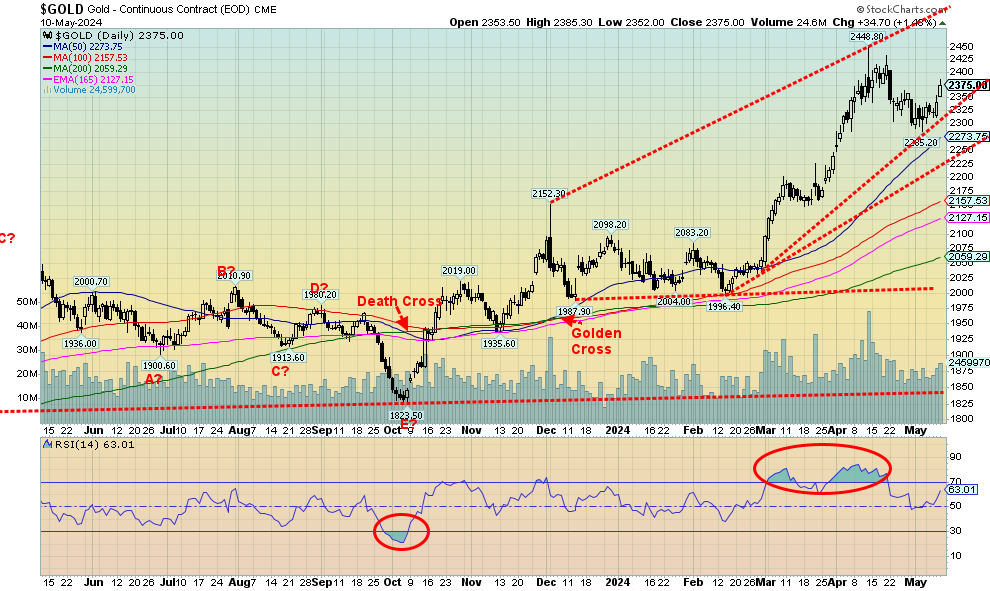
Thanks to some downbeat jobs data, gold enjoyed a solid week to the upside. The weekly jobless claims came in higher at 231,000, well above the expected 211,000 and last week’s 209,000. Is the jobs market finally starting to crack? We won’t know now until the next nonfarm on June 7. Adding to potential woes and signs the economy is slipping was the latest Michigan Consumer Sentiment that came in well below expectations. They expected 78 with last month’s was 77.2, but instead they got 67.4. Jobless claims up, consumer sentiment down. Once again, the speculators were out forecasting when the Fed will cut. Will it be June?
It was the highest weekly closing for gold in three weeks. On the week, gold gained 2.9%. Silver did even better, closing back over $28 at $28.51, up 6.8% on the week. That translated into a decent week for the gold stocks as the Gold Bugs Index (HUI) was up 4.9% and the TSX Gold Index (TGD) gained 4.8% as well. For both, it was important as they made 52-week highs. Still, the TGD needs to clear 330 to point higher while the HUI needs to break over 290. Platinum was up 4.3% and the near precious metals also gained as palladium was up 4.9% and copper hit fresh 52-week highs, gaining 2.2%. Predictions of copper prices hitting new all-time highs because of high demand appear to be kicking in.
The Golds Index TGD, along with the Metals & Mining Index TGM and the Materials Index TMT, all helped the TSX Composite rise 1.7% on the week to new all-time highs. That was more than enough to offset a 4.8% decline for the TSX Information Technology Index TKK. While the senior gold miners, as represented by the HUI and TGD, have been doing well, the junior miners continue to languish. Tavi Costa’s chart below shows the performance of the Van Eck Gold Miners versus gold prices, silver prices, and the TSX Venture Exchange’s Precious Metals & Minerals Index over the past year. If we truly are on the cusp of a new bull market for gold and precious metals, the junior miners should not only eventually catch up but surpass the performance of the large caps and gold and silver. As Tavi points out, the current situation may look bad but it actually works in our favour.
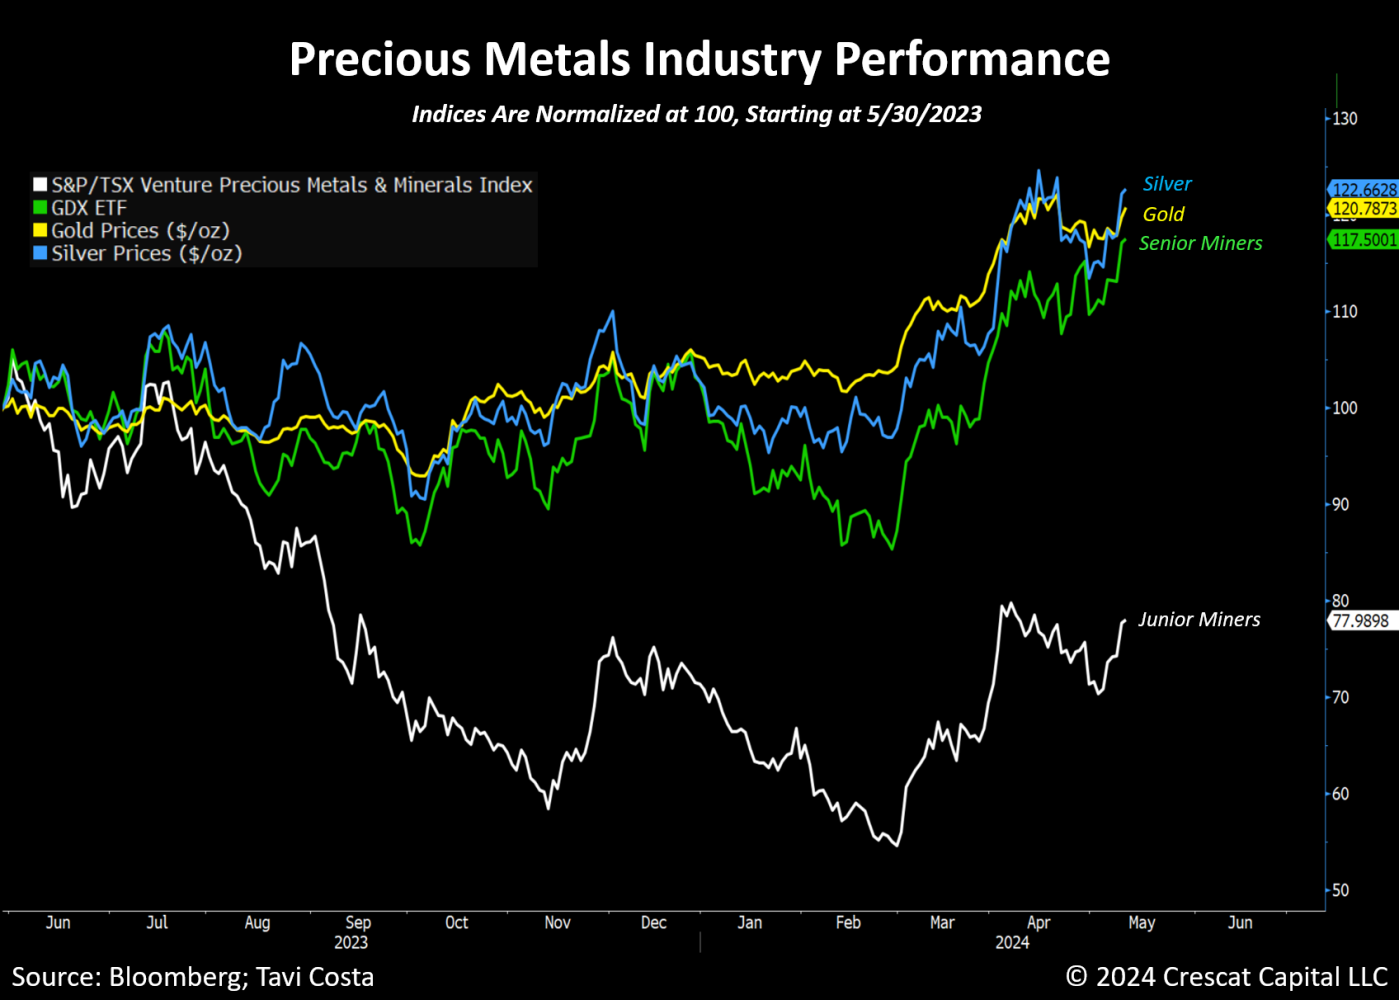
Source: www.crescat.net, www.bloomberg.com via Octavio (Tavi) Costa, www.linkedin.com/pulse/why-junior-miners-lagging-otavio-tavi-costa-onecc/
Central banks, led by China and Russia, have been buyers of gold to shore up their reserves and help their currencies (ruble, yuan). As Tavi points out, back in the early 1980s, central bank gold reserves represented 75% of total reserves. Today they represent 20%. We’ll never predict that gold reserves will make it back to the earlier peaks, but they will rise.
More 60/40 portfolios are adding to their hard assets including gold. Finally, Tavi points out that treasuries have become more volatile than gold. Deglobalization and de-dollarization are also helping gold. There is only so much gold supply and junior exploration stocks are the best vehicle for adding to reserves. Seniors’ reserves are declining. They need more. As the junior miners find gold and verify it to the proven and probable category or even the measured and indicated category, the small company is taken over by a larger company, and at much higher prices than they are at today. Finally, the entire gold market is small compared to the broader stock market. Even a 1% shift is like trying to shove the contents of the Hoover Dam through a garden hose.
Technically, gold needs to break above $2,400/$2,420 to suggest new highs above $2,448. We continue to have targets up around $2,500/$2,600. For the TGD, targets are up to 530/550. Silver is over $28 but needs to break over $30 to set us up for minimum targets of $39/$40.
We continue to see signs we are on the cusp of a major bull market for gold. As we noted in our opener, it sets up the potential for a run that lasts up to a decade with probable sharp pullbacks in between. Those bull markets lasted 9 years and 10 years respectively in the past. It’s no surprise that in the early stages nobody believes it. Insiders and others are already in.
A quick note on oil. WTI oil is still trying to find its legs. $80 remains elusive so far. WTI gained a meagre 0.2% this past week while Brent crude fell 0.2%. Natural gas (NG) at the Henry Hub was up 5.1%, but NG at the Dutch Hub fell 0.7%. The ARCA Oil & Gas Index (XOI) gained 0.9% while the TSX Energy Index (TEN) was up 2.2%.
Copyright David Chapman 2024
Markets & Trends
|
|
|
|
% Gains (Losses) Trends |
|
||||
|
|
Close Dec 31/23 |
Close May 10, 2024 |
Week |
YTD |
Daily (Short Term) |
Weekly (Intermediate) |
Monthly (Long Term) |
|
|
Stock Market Indices |
|
|
|
|
|
|
|
|
|
S&P 500 |
4,769.83 |
5,222.68 |
1.9% |
9.5% |
up |
up |
up |
|
|
Dow Jones Industrials |
37,689.54 |
39,512.84 |
2.2% |
4.8% |
up |
up |
up |
|
|
Dow Jones Transport |
15,898.85 |
15,597.49 |
1.6% |
(1.9)% |
neutral |
neutral |
up |
|
|
NASDAQ |
15,011.35 |
16,340.87 |
1.1% |
8.9% |
up |
up |
up |
|
|
S&P/TSX Composite |
20,958.54 |
22,308.93 (new highs) |
1.7% |
6.4% |
up |
up |
up |
|
|
S&P/TSX Venture (CDNX) |
552.90 |
597.36 |
2.7% |
8.0% |
up |
up |
down |
|
|
S&P 600 (small) |
1,318.26 |
1,324.38 |
1.8% |
0.5% |
up (weak) |
neutral |
up |
|
|
MSCI World |
2,260.96 |
2,350.38 |
2.2% |
4.0% |
down |
up |
up |
|
|
Bitcoin |
41,987.29 |
60,618.64 |
(3.7)% |
44.4% |
down |
up |
up |
|
|
|
|
|
|
|
|
|
|
|
|
Gold Mining Stock Indices |
|
|
|
|
|
|
|
|
|
Gold Bugs Index (HUI) |
243.31 |
273.37 (new highs) |
4.9% |
12.4% |
up |
up |
up |
|
|
TSX Gold Index (TGD) |
284.56 |
326.00 (new highs) |
4.8% |
14.6% |
up |
up |
up |
|
|
|
|
|
|
|
|
|
|
|
|
% |
|
|
|
|
|
|
|
|
|
U.S. 10-Year Treasury Bond yield |
3.87% |
4.50% |
(0.4)% |
16.3% |
|
|
|
|
|
Cdn. 10-Year Bond CGB yield |
3.11% |
3.73% |
1.4% |
19.9% |
|
|
|
|
|
Recession Watch Spreads |
|
|
|
|
|
|
|
|
|
U.S. 2-year 10-year Treasury spread |
(0.38)% |
(0.38)% |
(22.6)% |
flat |
|
|
|
|
|
Cdn 2-year 10-year CGB spread |
(0.78)% |
(0.60)% |
(13.2)% |
23.1% |
|
|
|
|
|
|
|
|
|
|
|
|
|
|
|
Currencies |
|
|
|
|
|
|
|
|
|
US$ Index |
101.03 |
105.30 |
0.2% |
4.2% |
up (weak) |
up |
up |
|
|
Canadian $ |
75.60 |
73.19 |
0.1% |
(3.2)% |
neutral |
down |
down |
|
|
Euro |
110.36 |
107.72 |
0.1% |
(2.4)% |
neutral |
down |
down (weak) |
|
|
Swiss Franc |
118.84 |
110.31 |
(0.1)% |
(7.2)% |
neutral |
down |
neutral |
|
|
British Pound |
127.31 |
125.24 |
(0.2)% |
(1.6)% |
down (weak) |
down (weak) |
down (weak) |
|
|
Japanese Yen |
70.91 |
64.16 |
(1.8)% |
(9.5)% |
down |
down |
down |
|
|
|
|
|
|
|
|
|
|
|
|
|
|
|
|
|
|
|
|
|
|
Precious Metals |
|
|
|
|
|
|
|
|
|
Gold |
2,071.80 |
2,375.00 |
2.9% |
14.6% |
up |
up |
up |
|
|
Silver |
24.09 |
28.51 |
6.8% |
18.4% |
up |
up |
up |
|
|
Platinum |
1,023.20 |
1,007.20 |
4.3% |
(1.6)% |
up |
neutral |
down (weak) |
|
|
|
|
|
|
|
|
|
|
|
|
Base Metals |
|
|
|
|
|
|
|
|
|
Palladium |
1,140.20 |
981.70 |
3.5% |
(13.9)% |
down |
down |
down |
|
|
Copper |
3.89 |
4.66 (new highs) |
2.2% |
19.8% |
up |
up |
up |
|
|
|
|
|
|
|
|
|
|
|
|
Energy |
|
|
|
|
|
|
|
|
|
WTI Oil |
71.70 |
78.26 |
0.2% |
9.0% |
down |
up (weak) |
up (weak) |
|
|
Nat Gas |
2.56 |
2.25 |
5.1% |
(12.1)% |
up |
down (weak) |
down |
|
Source: www.stockcharts.com
Note: For an explanation of the trends, see the glossary at the end of this article.
New highs/lows refer to new 52-week highs/lows and, in some cases, all-time highs.
- * New All-Time Highs
|
GLOSSARY
Trends
Daily – Short-term trend (For swing traders) Weekly – Intermediate-term trend (For long-term trend followers) Monthly – Long-term secular trend (For long-term trend followers) Up – The trend is up. Down – The trend is down Neutral – Indicators are mostly neutral. A trend change might be in the offing. Weak – The trend is still up or down but it is weakening. It is also a sign that the trend might change. Topping – Indicators are suggesting that while the trend remains up there are considerable signs that suggest that the market is topping. Bottoming – Indicators are suggesting that while the trend is down there are considerable signs that suggest that the market is bottoming. |
Disclaimer
David Chapman is not a registered advisory service and is not an exempt market dealer (EMD) nor a licensed financial advisor. He does not and cannot give individualised market advice. David Chapman has worked in the financial industry for over 40 years including large financial corporations, banks, and investment dealers. The information in this newsletter is intended only for informational and educational purposes. It should not be construed as an offer, a solicitation of an offer or sale of any security. Every effort is made to provide accurate and complete information. However, we cannot guarantee that there will be no errors. We make no claims, promises or guarantees about the accuracy, completeness, or adequacy of the contents of this commentary and expressly disclaim liability for errors and omissions in the contents of this commentary. David Chapman will always use his best efforts to ensure the accuracy and timeliness of all information. The reader assumes all risk when trading in securities and David Chapman advises consulting a licensed professional financial advisor or portfolio manager such as Enriched Investing Incorporated before proceeding with any trade or idea presented in this newsletter. David Chapman may own shares in companies mentioned in this newsletter. Before making an investment, prospective investors should review each security’s offering documents which summarize the objectives, fees, expenses and associated risks. David Chapman shares his ideas and opinions for informational and educational purposes only and expects the reader to perform due diligence before considering a position in any security. That includes consulting with your own licensed professional financial advisor such as Enriched Investing Incorporated. Performance is not guaranteed, values change frequently, and past performance may not be repeated.
About the author


Website: https://www.enrichedinvesting.com
Disclaimer: David Chapman is not a registered advisory service and is not an exempt market dealer (EMD) nor a licensed financial advisor. We do not and cannot give individualised market advice. David Chapman has worked in the financial industry for over 40 years including large financial corporations, banks, and investment dealers. The information in this newsletter is intended only for informational and educational purposes. It should not be considered a solicitation of an offer or sale of any security. The reader assumes all risk when trading in securities and David Chapman advises consulting a licensed professional financial advisor before proceeding with any trade or idea presented in this newsletter. David Chapman may own shares in companies mentioned in this newsletter. We share our ideas and opinions for informational and educational purposes only and expect the reader to perform due diligence before considering a position in any security. That includes consulting with your own licensed professional financial advisor.