
Thank goodness, THAT’S over.
“ ‘THAT’ being what, mmb? “
THAT, Squire, being the Short parabolic trend for both Gold and Silver having finally reached the end! For as last week herein penned:
“As to the ‘when’ for these two precious metals’ Short trends to end … it is plausible one if not both precious metals’ weekly trends can be Long in a week’s time. ‘Stay tuned to this channel for further developments…’“
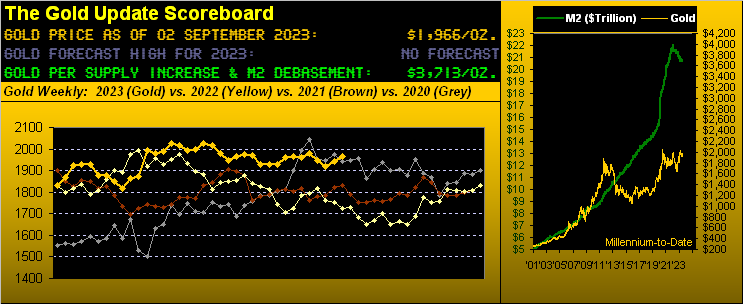
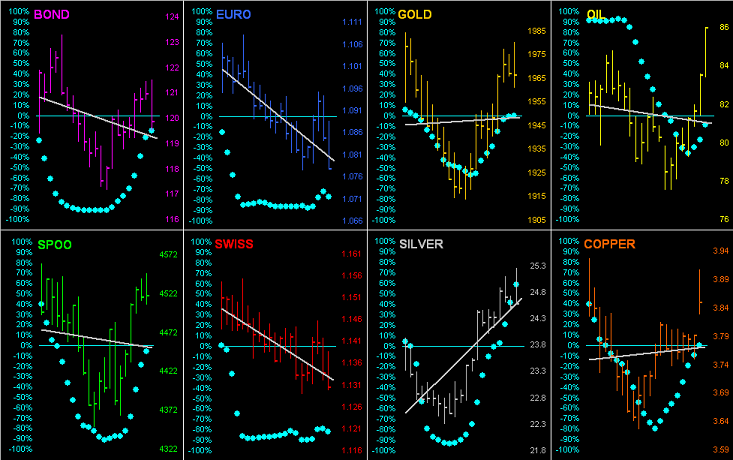
Which as foretold by the Sibyl — here in the guise of the lovely Lady Fortuna — is exactly what came to pass as the week unfolded, Gold settling yesterday (Friday) at 1966 and Silver at 24.55. ‘Tis a beautiful thing, their new weekly parabolic Long trends each heralded by its rightmost encircled fresh dot in blue:
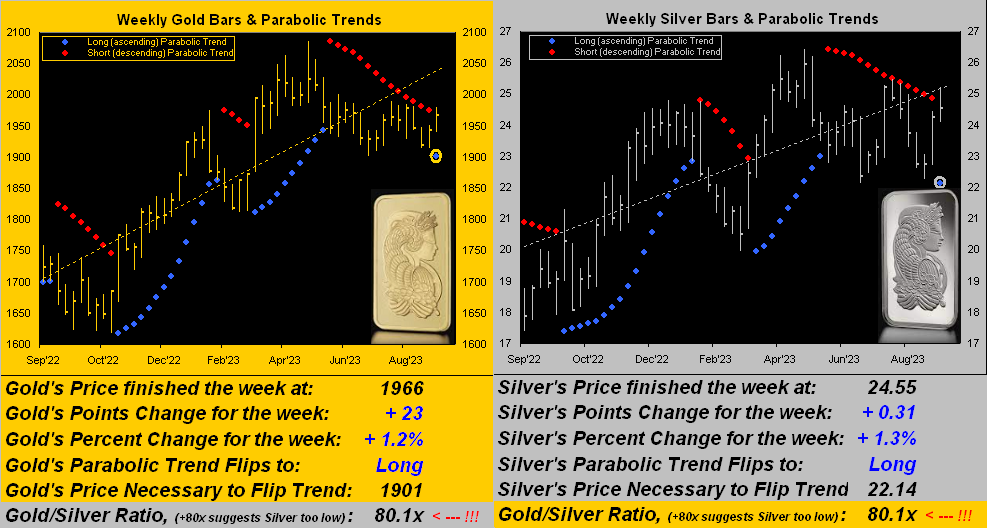
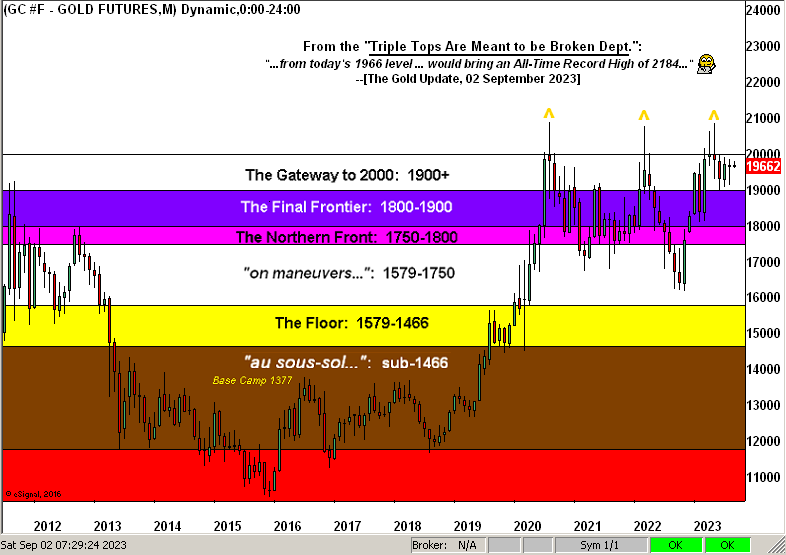
‘Course the key question from here is: “How high is high?” Notwithstanding last Spring’s structural resistance (for Gold in the 2000-2100 range and for Silver in her 25-27 range), let’s recall “average maximum” price follow-throughs. For Gold’s last 10 parabolic Long trends (dating back to September 2018), the average max upside upon Long trend confirmation is +11.1%: thus in that vacuum from today’s 1966 level, to reach such “perfect world” average would bring an All-Time Record High of 2184. Likewise for Sister Silver’s last 10 parabolic Long trends, (in her case dating back to December 2018), the average max upside (as anticipatively noted a week ago) is +19.6%. Such increase from today’s 24.55 price, would bring 29.36, a level not traded for Silver since 01 February 2021.
And for Silver, that’s still a far cry from her All-Time Record High of 49.82 on 25 April 2011, the Gold/Silver ratio on that day a mere 32.1x versus today’s 80.1x. The century-to-date average of that ratio is now 67.7x. Pricing Silver to that puts her at 29.04 … which is not far from the just-cited 29.39 potential upside follow-through per the new parabolic Long trend. ‘Tis one of those things that happily makes you go “Hmmm…”
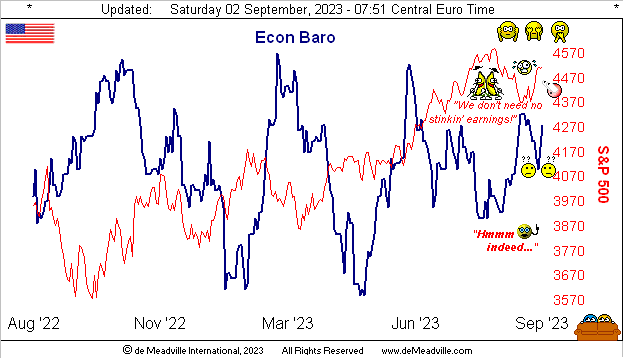
“Hmmm…” (not necessarily happily) also applies to the state of the Economic Barometer. Hardly is it humming along, but neither is it sputtering to a stop. From this past week’s load of 16 incoming metrics, 8 showed period-over-period improvement, 7 were worse, and arguably the most important of all the data points — Core Personal Consumption Expenditures — again came in at +0.2% (an annualized rate of +2.4%) for the month of July. Such rate of this Federal Reserve-favoured inflation gauge means the Open Market Committee — some say — shan’t further raise their Banks’ Funds Rate for the balance of the year. On verra…
To look at the Econ Baro year-over-year, its net neutral state may argue that the Fed simply go to bed, i.e. “Everything’s great!” Dow Jones Newswires just went on record with August’s StateSide jobs report as “near perfect”. And as for equities, Bloomy concluded the week with “Stock Traders Get Back to Believing Everything is Just Perfect”. Perfection abounds. And why not? Oh to be sure, risk-free three-month U.S. “no debt ceiling dough” settled the week at an annualized rate of 5.268%, whereas the “all-to-risk” S&P 500’s yield is a paltry 1.507%. BUT: it doesn’t matter for neither do earnings, our “live” price/earnings ratio for the S&P finishing the week at 40.6x, not quite double the S&P’s 66-year lifetime median ’round 23x. (Best not to wreck everyone’s fun).
Regardless, here’s the Baro with the S&P 500 today at 4516, only -5.9% below its all-time closing high of 4797 from back on 03 January 2022:
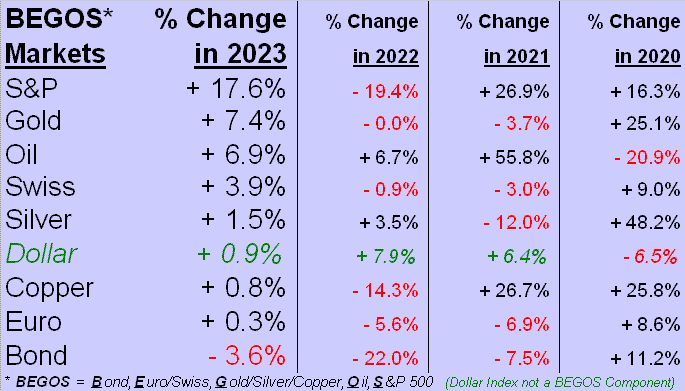
So just as “The Sky’s the Limit!” for the S&P — clearly as ’twas in November 1980, August 1987, March 2000, October 2007, February 2020 and January 2022 (from which “corrections” then ranged from -25% to -58%) — ’tis no surprise that the mighty Index again tops our year-to-date standings of the BEGOS Markets with both Gold and Oil rounding out the podium, (albeit a distant second and third). Note Silver’s seriously lagging percentage performance; hence the aforementioned G/S ratio still historically high at 80.1x:
Too, it being month-end plus a day, ’tis time to go ’round the horn for all eight BEGOS Market components across these past 21 trading days (one month) incorporating their diagonal grey regression trendlines and the baby blue dot depictions of such trends’ day-to-day consistency. Notably therein is a most material move by Oil. Indeed as we twice tweeted (@deMeadvillePro) during the week, Oil initially en route to the 75-72 zone then defied its “Baby Blues” with a great gusher into the highest weekly close (86.05) since that ending last 07 November (then 88.96). As for Copper’s up gap, we can thank the price premium in rolling from the September to December cac:
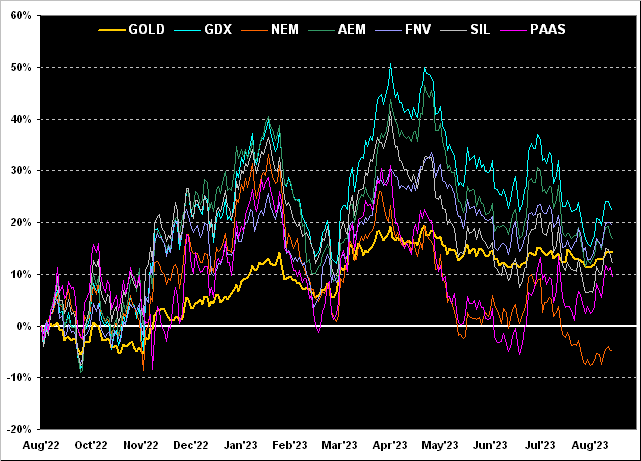
As to Gold and several of the key precious metals’ equity offerings, let’s next look year-over-year at their respective percentage performance tracks. From the bottom up, note that only Newmont (NEM) by this time frame is in the red, -5% as its weathers costs associated with acquiring Oz-based Newcrest Mining. Then to the good we’ve Pan American Silver (PAAS) +9%, the Global X Silver Miners exchange-traded fund (SIL) +12%, Gold itself +14%, Agnico Eagle Mines (AEM) +17%, Franco-Nevada (FNV) +19%, and the VanEck Vectors Gold Miners exchange-traded fund (GDX) topping the stack at +22%, (although well off its May highs, as is the entirety of the bunch). But all ought benefit in anticipating higher metals’ prices near-to-medium term as the new weekly parabolic Long trends kick into gear:
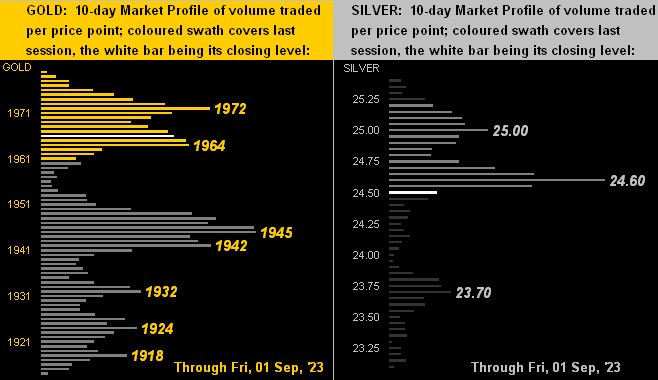
Meanwhile per the past fortnight, Gold’s Market Profile below left depicts trading support in the 1945-1942 zone, whilst Sister Silver below right has slipped a pip below her most dominantly-traded price of 24.60. These of course shall wither away as higher levels come into play:
Toward closing, here’s our chart of the sedimentary Gold Structure by the month from a dozen years ago-to-date. Gold’s present All-Time High of 2089 was established on 07 August 2020 as the response to COVID shut down the world. Yet now that Gold has flipped to a brand-new weekly parabolic Long trend, as noted the typical average follow-through can well break the Triple Top into uncharted territory toward 2184. And when viewed by the rightmost monthly bars, it makes the nattering nabobs of Gold negativism appear nonsensical:
Heaven forbid your being a precious metals naybob…
…for that’s where you ought put your bob: into Gold and Silver!
Cheers!
…m…
www.TheGoldUpdate.com
www.deMeadville.com
and now on Twitter: @deMeadvillePro
About the author
