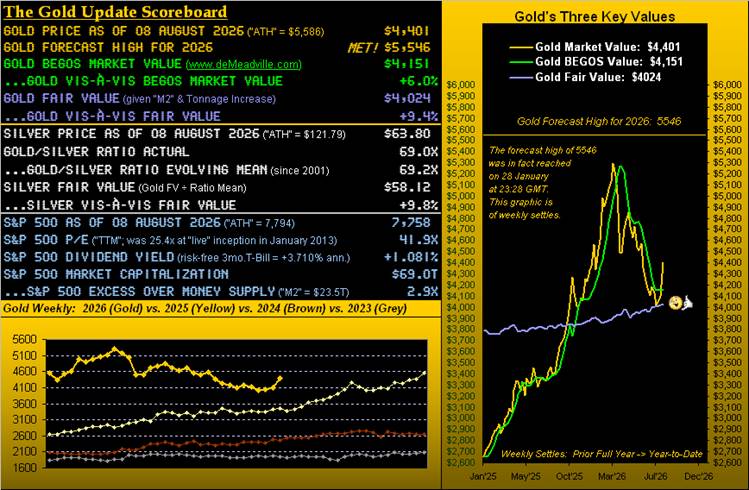
In settling yesterday (Friday) at 4401, Gold just posted its second best of the 31 full trading weeks year-to-date: a +7.4% increase, second only to the +8.3% gain for that ending back on 23 January. Cue “This Magic Moment” –[The Drifters, ’60] … or more specifically the “magic minute” of the past week that arrived Friday at precisely 12:30 GMT upon the StateSide release of July’s “Non-Farm Payrolls”.
As is our wont come the release, rather than look at what — back in the day — was referred to as “The Mother of All Numbers”, we simply watched the markets. And within the 60 seconds from 12:30-12:31, the price of Gold low-to-high went from 4371 to 4418, some +47 points or +1.1%. Instantly our notion (without yet being knowledgeable of the data) was that Payrolls — rather than having increased per consensus — must actually have shrunk: so then we looked … and indeed they had! More on that later when we assess the eroding state of the Economic Barometer.
“Don’t forget the ¥en support also, mmb… ”
Noted, dear Squire, (and welcome back from your appreciated fire zone duties). As to the ¥en, whilst not eliciting as instantaneous a move for Gold, price nonetheless benefitted into the new week following the previous Friday’s direct dumping of €26B by the NY Fed for ¥en, with the Finance Ministry in Japan further loading up on its own currency in dispensing some $90B. Thus by conventional wisdom, (even as we’ve demonstrated over these many years that Gold plays no currency favourites), ’twas down with the Dollar and up with Gold.
“And so 4000 is now lookin’ like a floor, huh mmb?”
‘Twould appear at least the near-term case, Squire. Two missives ago we encircled the 4000 area within “Gold’s Fits and Starts in Finding a Floor”, only to just last week acknowledge “Gold Resumes Skidding…”. But then came the USA/JPN yen to buy the ¥en (which actually settled this past week slightly below Monday’s open, although still well up from the prior Friday), and thus — along with Payrolls’ shrinkage for July — here is the rightmost effect of it all by Gold’s weekly bars from a year ago-to-date:
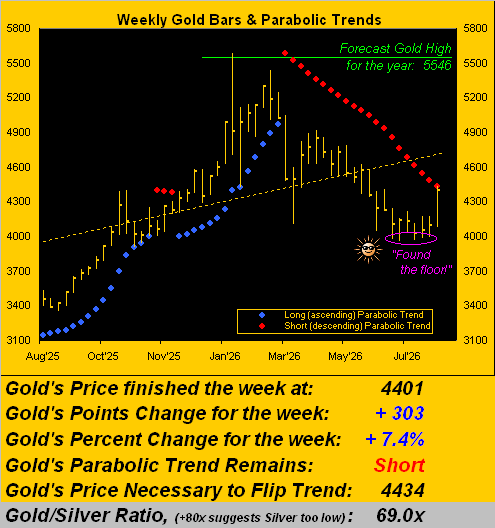
Further, following now 21 weeks of parabolic Short trend, (the most since that ending in May 2013), barring it all suddenly going wrong for the yellow metal, the red dots likely shall return to bullish blues as the new week ensues. At 4401, Gold need advance just +33 points toward eclipsing the 4434 “flip-to-Long” level as depicted in the above graphic. So just in case you’re scoring at home, Gold’s expected daily trading range (per the website) is now 98 points and the weekly 235 points.
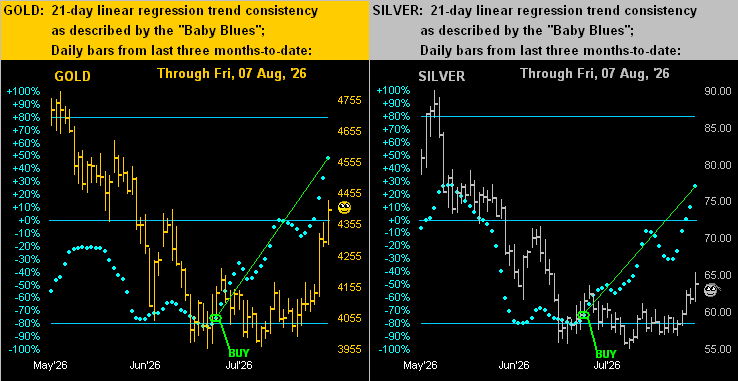
As well, that which we’d been anticipating these last few weeks finally came to fruition: with the 4000 floor essentially having held, our “Baby Blues” of trend consistency sufficiently rose to rotate what had (for Gold) been a negative regression trend across 66 trading days, and (for Silver) 46 trading days, back to positive. Et voilà, (a little French lingo there), per this next telling graphic we’ve again noted our “BUY” signals upon the “Baby Blues” crossing above the key -80% axes as originally encircled effective for Sister Silver come her 01 July close at 59.61 and for Gold from the 02 July close at 4136. And you regular readers know the rule: “Follow the Blues instead of the news, else lose yer shoes”, for which in these two cases we’ve “connected the dots” from “BUY” to right now for emphasis . ‘Tis a beautiful thAng, if admittedly having to “weather the dips” (aka “employ cash management”) en route. And yet, even subtracting the recent +60 points (as previously discussed) of fresh December Gold contract premium, price from the “BUY” to today is +5.0% and that for Silver +7.0%:
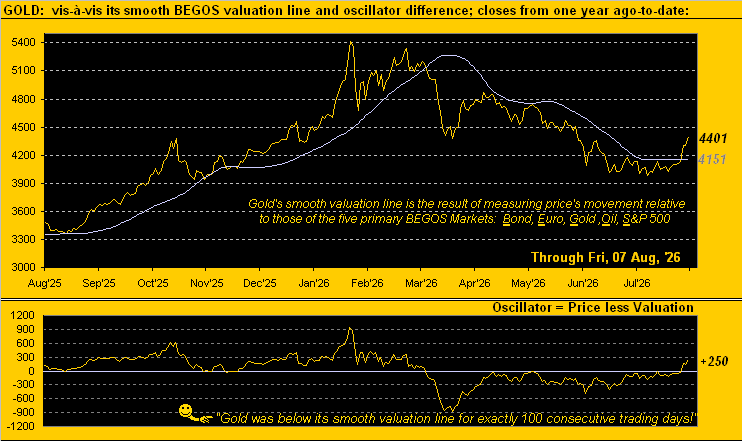
Amidst this renewed mirth for Gold, as penned in last Wednesday’s Prescient Commentary, price has: “… crossed above its smooth valuation line (see Market Values) for the first time since 11 March…” Thus as further denoted in following year-over-year graphic, such run sub-Market Value lasted exactly 100 trading days which is a century-to-date record, even exceeding the above-Market Value record of 88 days achieved just last year. To be sure, Gold today at 4401 is (by the opening Scoreboard) +6.0% above its BEGOS Market Value, indeed +9.4% above Fair Value. But the latter is a far more ponderous measure, whereas when Gold breaks above its smooth valuation line as below shown, ’tis a buy signal of its own:
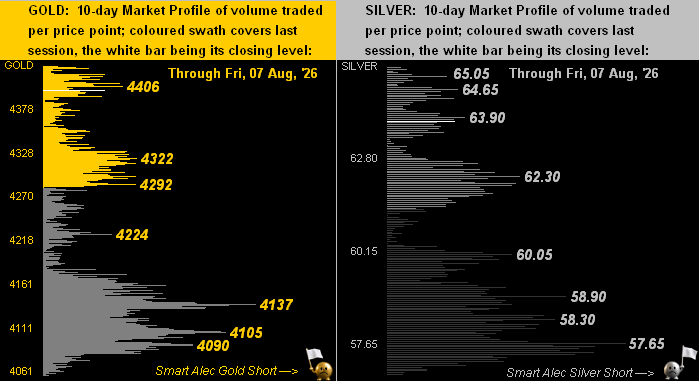
With the past week’s rallies in the bag, the Smart Alec Shorts are waving the white flag. For as indicated by the respective 10-day Market Profiles next for Gold on the left and for Silver on the right, prices have well-departed the lower drudgery, out of which for weeks they could not break:
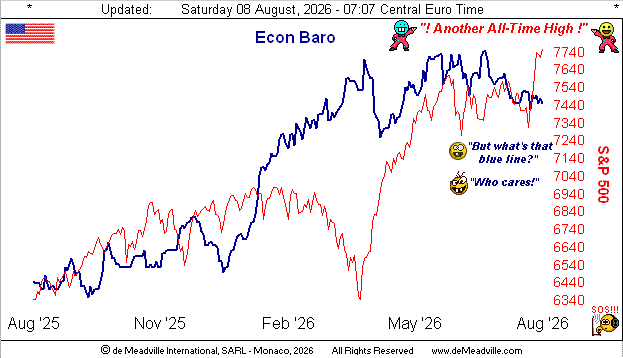
As to our aforementioned Econ Baro, the blue line continues a downward drift in this year ago-to-date view. The best incoming metric of the past week was Q2’s preliminary Productivity having nearly doubled from +0.8% in Q1 to now +1.4%. Problematic thereto? Productivity tends to rise as the human workforce subsides: “Oh blame it on AI!” For indeed, the week’s weak links were the stated July Payrolls’ shrinkage, ADP’s own July employment data reported as less than half that gained in June, and Construction Spending (for which workers are on-site requisite) also shrinking in July, missing estimates, with June revised lower as well. Reprise Fleetwood Mac from ’69:  “Oh well…”
 . Besides, with the S&P 500 at an all-time high, all must be well, (do tell?):
Speaking of the S&P, we close with its price/earnings ratio … and guess what just happened? Bob Shiller’s long-revered CAPE (Cyclically Adjusted Price/Earnings) just surpassed ours. Since the debut of the ever-honestly calculated deMeadville “live” P/E back in 2013, here by the month we’ve ours, along with Shiller’s and that compiled by S&P/DJI itself, the latter being comparably lower, yet still double the “acceptable maximum” as taught in portfolio theory, (an ancient science with which has been discarded in this modern Investing Age of Stoopid):
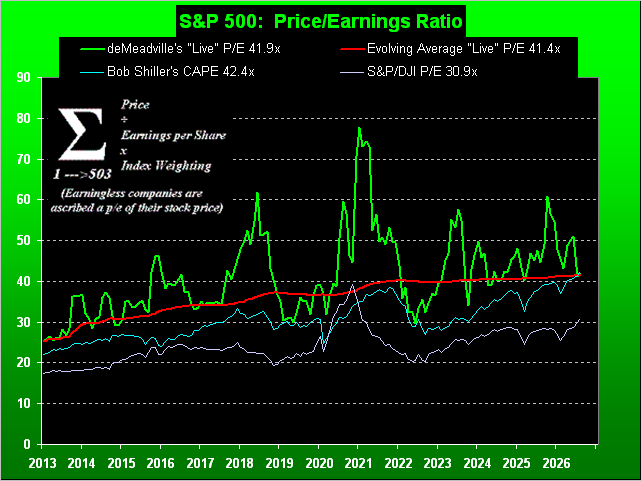
Thus as we on occasion quip, (until they again do), “Earnings don’t matter anymore.”
But Gold always matters, regardless of a 4000 floor, or more!
Cheers!
…m…
www.TheGoldUpdate.com
www.deMeadville.com
and now on “X”: @deMeadvillePro
deMeadville. Copyright Ⓒ 2010 - 2026. All Rights Reserved.
About the author