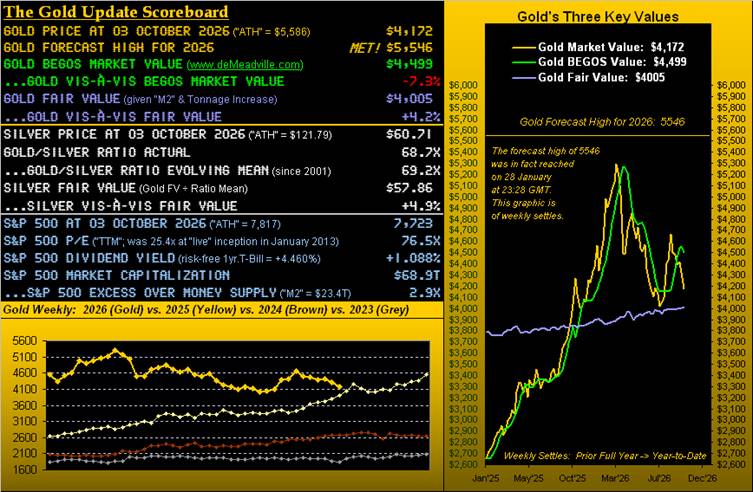
Having opened last week’s piece (“Still Lower Gold Ahead”) with “We honestly hope we’re wrong about this…”, unfortunately we were right. Barely had the ink from our Chinese-lacquered S.T. Dupont Gold-tipped fountain pen dried upon the final draft being submitted for publication, that the trading week commenced with Gold falling like a stone on Monday alone from 4321 to what would hold as the week’s low at 4143. Regardless, ’twas a single session intra-day loss of -178 points, (or -4.1%, eighth-worst year-to-date), as rather reluctantly read ahead by The Gold Update.

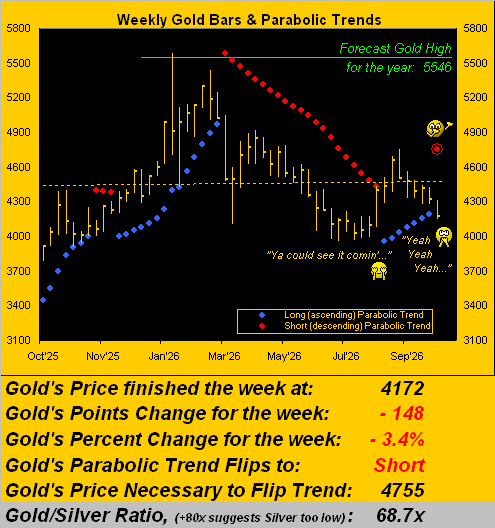
Followed came Tuesday’s Prescient Commentary stating “Gold’s weekly parabolic trend has provisionally flipped from Long-to-Short”, as further confirmed by yesterday’s (Friday’s) settle at 4172. ‘Twas not a beautiful thAng, but as you regular readers know, the flip had already been brewing through recent weeks. Here are the year-over-year weekly bars featuring the rightmost first red dot as encircled of the new parabolic Short trend:
“But what about the support at 4000, mmb?
Thank you, Squire, for citing that key area we’ve dubbed “The Floor”. In the above graphic (as noted a week ago) you can see the pricing cluster ’round the 4000 area from back in June/July. Moreover, given the new Short trend, might its downside there end? As a guesstimate for downside slide, here we’ve updated our table of Gold’s prior 10 weekly parabolic Short trends. And therein we see an average duration of eight weeks with a modest maximum average decline of -2.5%:
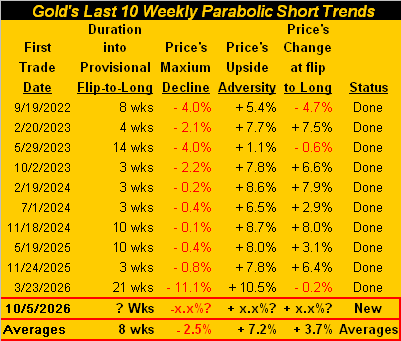
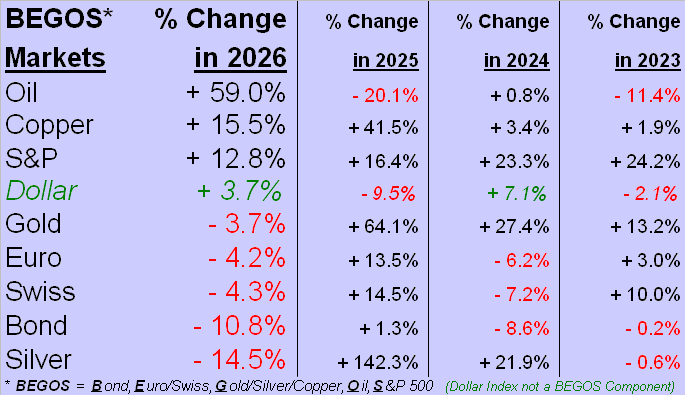
So, by measuring from here at 4172 solely within the vacuum of that average, Gold would go as low as 4068, a reasonably acceptable area to apply the brakes. As well, per the opening Gold Scoreboard, Fair Value for Gold today is 4005, although admittedly, price today at 4172 already is -7.3% below its BEGOS Market Value of 4499, (also as shown in the Scoreboard). That is a fairly extreme deviation of price below valuation of -327 points; however, we witnessed distances better than double that as the Gold wheels came off this past March/April. Either way, it being month-end (plus two trading days), let’s go to our BEGOS Market Standings thus far for 2026, wherein Gold again is in the red and poor ol’ Sister Silver nearly left for dead, (which from her industrial metal perspective seems a bit untoward given Cousin Copper’s surging ahead):
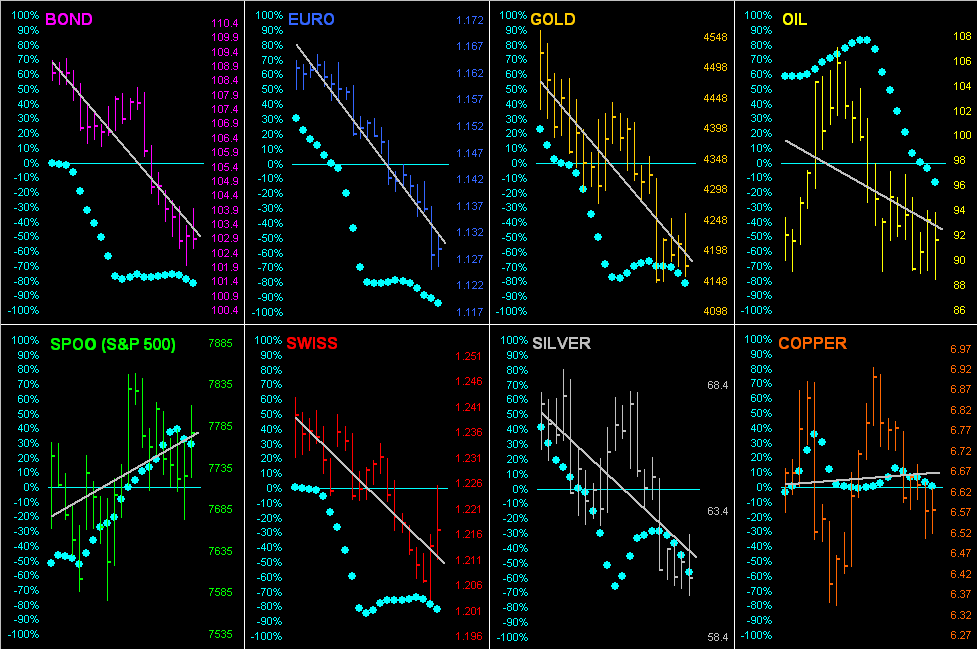
As for the whole BEGOS bunch, here are their respective last 21 trading days (one month) replete with the diagonal grey trendlines and “Baby Blues”, the dots that depict the day-to-day consistency of each trend. Save for Copper and the S&P 500, (the latter as envisioned by Stoopid & Co. never having had a down day since its inception on 04 March 1957), a war-and-inflation-driven rising Dollar is beating down the balance of the bunch, even as Oil, too, is falling of late:
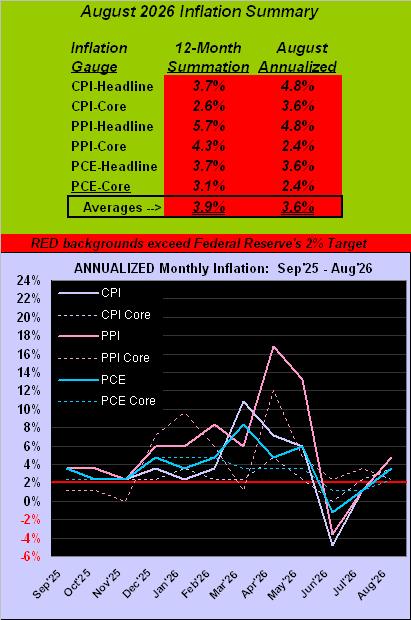
And specific to inflation, with last Wednesday’s release of the “Fed-favoured” Personal Consumption Expenditures data for August, the month’s table is now complete, every listed category running above the Federal Reserve’s preferred pace of +2%. That desired level is the horizontal red line in the graphic’s lower panel. Yes, August’s PCE data was cooler than consensus … but both the headline and core paces were faster than those for July, plus on balance ’tis all still high by the Fed’s eye:
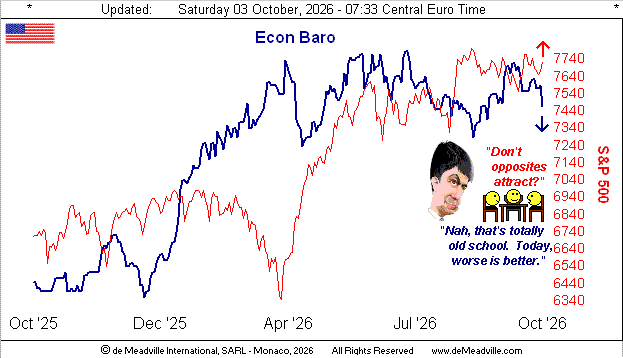
As to the StateSide economy, can it weather another Federal Open Market Committee vote to again nudge up its Bank’s FundsRate come the 28 October Policy Statement? Last week brought 16 metrics into the Economic Barometer, eight of which fared poorer per the prior period. The real data shocker for us was Personal Spending soaring in August by +0.9%, almost completely unsupported by Personal Income rising only +0.2%. “How’s that variable-rate credit card workin’ out for ya??” And per the Conference Board, September’s Consumer Confidence recorded its second-worst month-over-month drop since COVID during 2021. “Are you confident??” Gotta cue this one:  “Nobody Knows You When You’re Down and Out”
 –(Jimmie Cox, 1923). At least (as previously grasped), the S&P 500 apparently never goes down. Here’s the Baro:
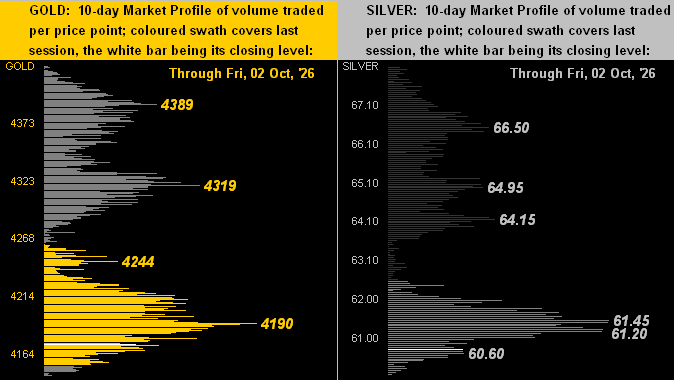
Returning to true monetary substance, here next we’ve the 10-day Market Profiles for Gold on the left and for Silver on the right. Given the fallouts of the past week, prices within this construct are in their respective “soul-sols” (a little French lingo there) per the white line in each panel. And as labeled, volume-dominant resistance for the yellow metal is at 4190, whereas for the white metal ’tis the 61.20-61.45 zone, her having settled the week at 60.71:
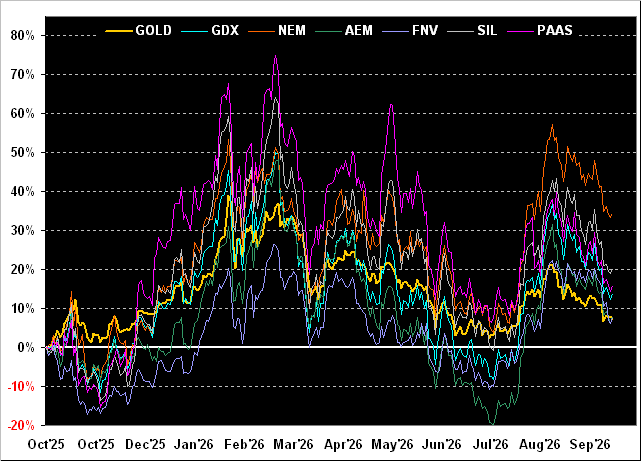
As to key of the precious metals’ equity brethren, here are their percentage tracks from a year ago-to-date. From first-to-worst they are: Newmont (NEM) +34%, the Global X Silver Miners exchange-traded fund (SIL) +20%, Pan American Silver (PAAS) +16%, the VanEck Vectors Gold Miners exchange-traded fund (GDX) +14%, both Agnico Eagle Mines (AEM) and Franco-Nevada (FNV) +8%, and Gold itself +7%. As noted earlier in the Standings, the latter is actually down year-to-date, as is PAAS. Here’s the whole gang:
And it being month-end, ’tis time once again for the monthly Gold Structure across the last eight years, the rightmost wee candle being October thus far. With respect to Gold’s aforementioned “sous-sol” positioning within the Market Profile — especially now in consideration of price more broadly moving toward the “The Floor” at 4000 — we’re put in mind of the noted cinematic classic from ’63 (Cité Films) as portrayed in the graphic. “Quel drame, mes amis!”
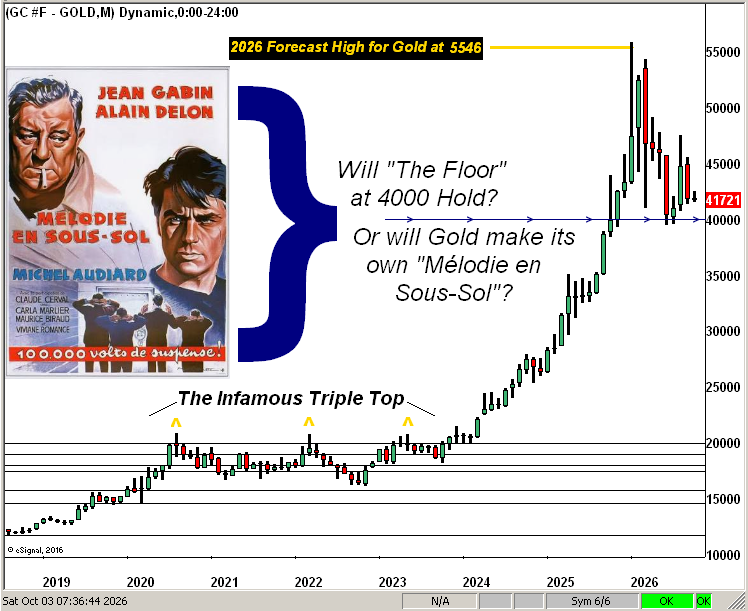
Thus — of which we’ve been wary through recent weeks — Gold’s weekly parabolic trend has flipped to Short, yet “The Floor” of 4000 is support and ’tis in range to get tested in the new week. Thereto, should Fair Value (4005) trade, ’tis always a brilliant opportunity to buy, (barring the StateSide money supply shrinking over time … impossible).

“Wow, is that Grace Kelly, mmb?
‘Tis a state secret, Squire. But as inevitably the Fed shall be forced to spin the printing tumblers to both pay down debt and bail out broker I.O.U. holders of S&P 500 (et alia) constituents, in turn we’ll see Gold fly high into the sky!
Cheers!
…m…
www.TheGoldUpdate.com
www.deMeadville.com
and now on “X”: @deMeadvillePro
deMeadville. Copyright Ⓒ 2010 - 2026. All Rights Reserved.
About the author