
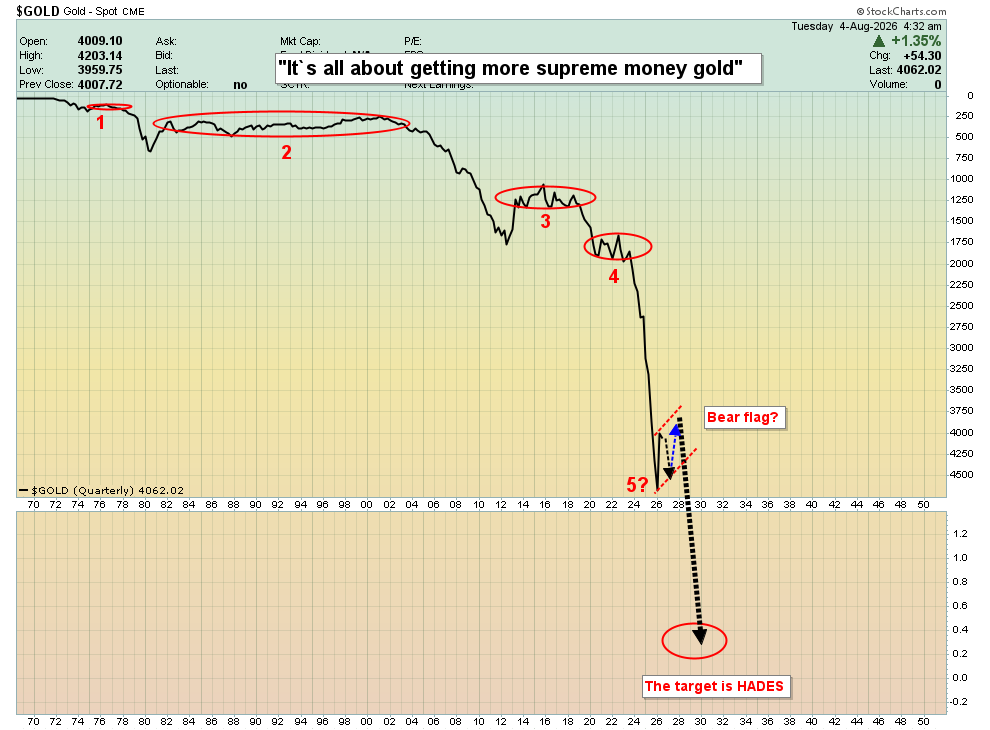
- The big picture of global government is a macabre one. It’s a picture of debt, extortion, and fiat-oriented bravado.
- For a closer look this horrifying picture, please click here now. Double-click to enlarge. The long-term meltdown of fiat against gold is undeniable, and the next big leg down could involve oil.
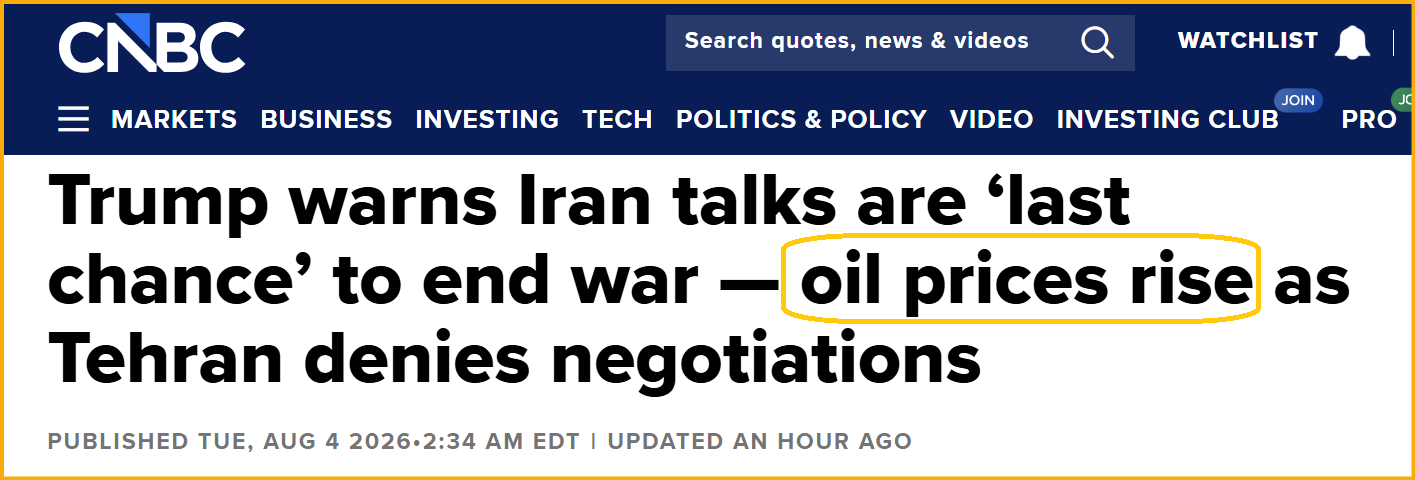
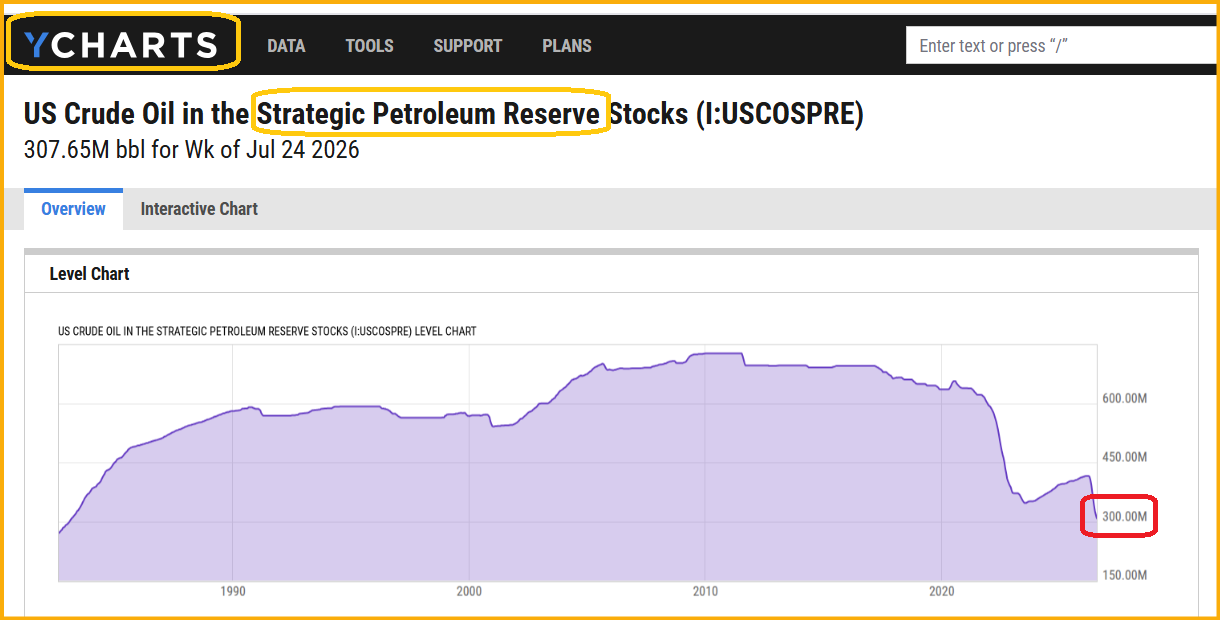
- On that key note, please click here now. Double-click to enlarge. The Iran war has created an oil supply shortage. It’s been carefully managed by the mainstream media and that has worked, so far, because of significant dumping from global SPRs that mitigate the shortage.
- Please click here now. Double-click to enlarge. At the current dump rate, the US SPR will reach critical levels in 3-4 months. Three scenarios are possible:
- The first involves a major resumption of the war; Iranian oil infrastructure is blown up by the United States government and then the government of Iran does the same thing to the oil infrastructure of its neighbours.
- Oil would then surge back to the $120 area highs (or beyond), the outrageously overvalued US stock market would collapse, the Fed “soup kitchen” would do an emergency rate cut and… the price of gold would skyrocket.
- The second scenario would see little or no resumption of war, but no opening of Hormuz. By the end of the year the US SPR would be at red alert levels and the dumping would have to stop. The price of oil would begin to rise towards $120, albeit at a slower pace than if war resumes.
- The stock market would also roll over in this situation, the Fed would still cut, and gold would rise, but more slowly.
- The third scenario would see the war end and Hormuz would open, but with tolls. The tolls would add to inflation and ultimately push the stock market down, but much more slowly because it would take time for inflation-pounded consumers to drastically cut back their spending.
- Regardless of how it plays out, gold is in a major buy zone here and now. It doesn’t matter whether gold surges right away or takes many more months before the rally begins.
- What matters is whether supreme money gold is in a buy zone… and it’s in a big one right now.
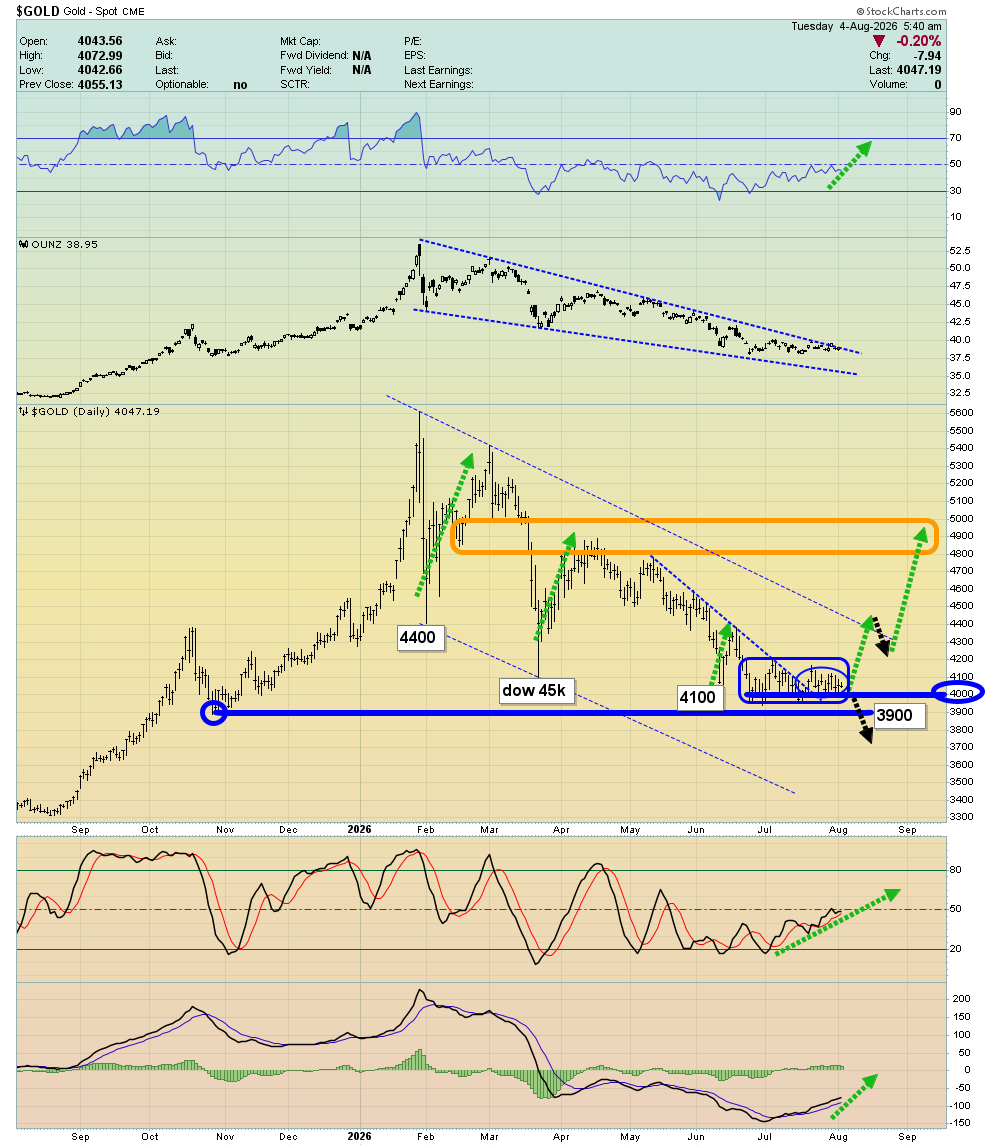
- For a look at the daily chart, please click here now. Double-click to enlarge. $4000 is a big round number and the entire $4100-$3900 zone is key support.
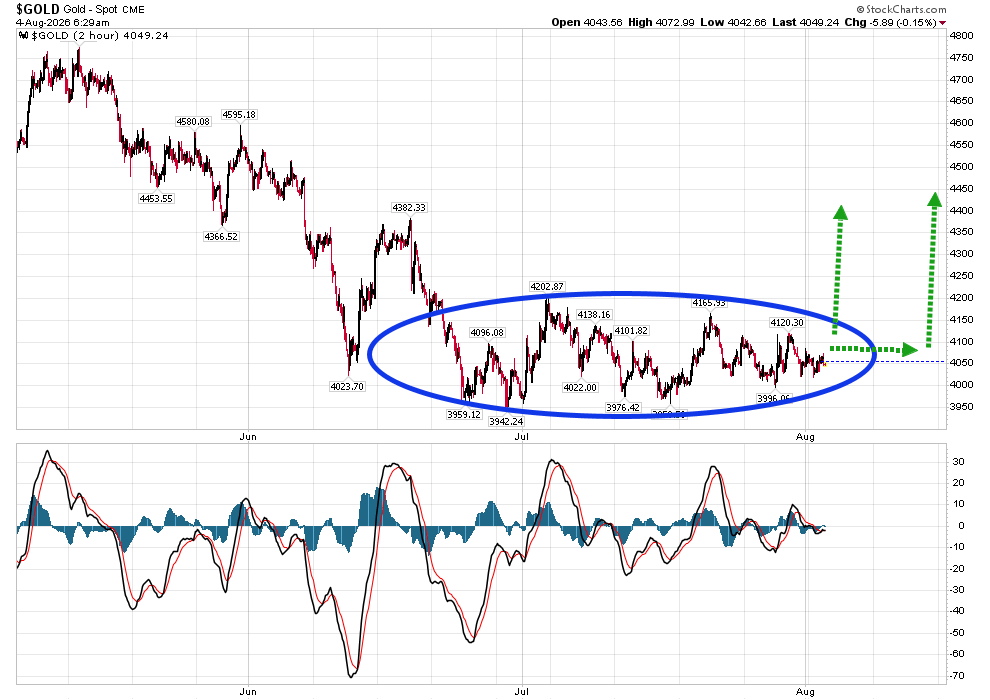
- Please click here now. Double-click to enlarge this short-term gold chart. The sideways grind can wear on amateur investors, but that doesn’t change the fact that this is a major price zone to buy.
- Mainstream media isn’t helping matters with its constant banter that, “The Fed might do a hike”. Rates rose from almost zero to 5% and gold was unaffected, but the silly narrators seem to believe that a tiny quarter point hike now will severely harm gold market investors.
- That’s nonsense. Higher rates harm “debtaholic deadbeats” around the world, not gold. In Japan, the BOJ refused to hike rates because even 2% rates would be a disaster for the debt-soaked government there. The US treasury is terrified that the BOJ will dump American treasuries and use the proceeds to prop up the fiat yen.
- The bottom currency markets line is that the yen has failed badly against the dollar… and the dollar has failed even more badly against gold and will continue to do so.
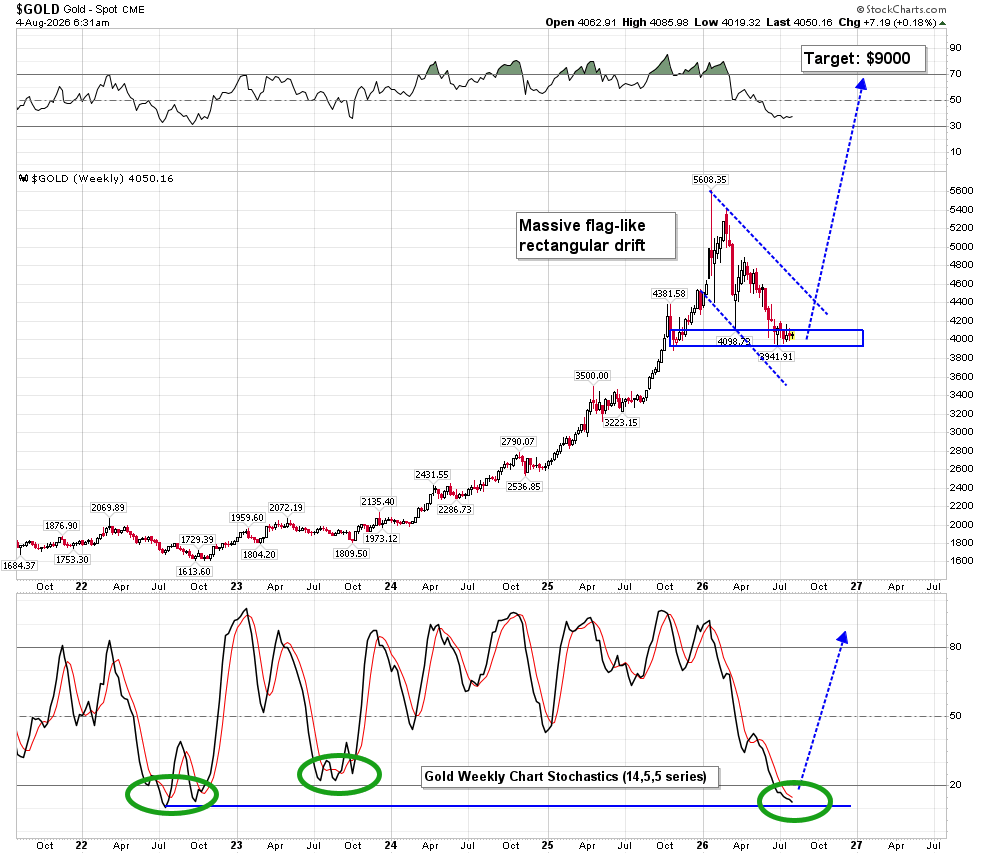
- For a look at a key weekly chart, please click here now. Double-click to enlarge. The current consolidation for gold is a massive flag-like rectangle. A breakout could see the price surge to about $9000. Oil is a potential catalyst of significance, but government debt is the biggest catalyst of them all.
- Note the action of Stochastics at the bottom of the chart. I’ve highlighted some of the previous lows of importance with green circles for a reason; sometimes the price rallies quickly from the oversold zone and at other times it can take many months before the “golden rocket” is launched. While the biggest tool in a gold investor’s toolbox should always be patience, the exciting news is that not much of it is likely to be required in the current situation.
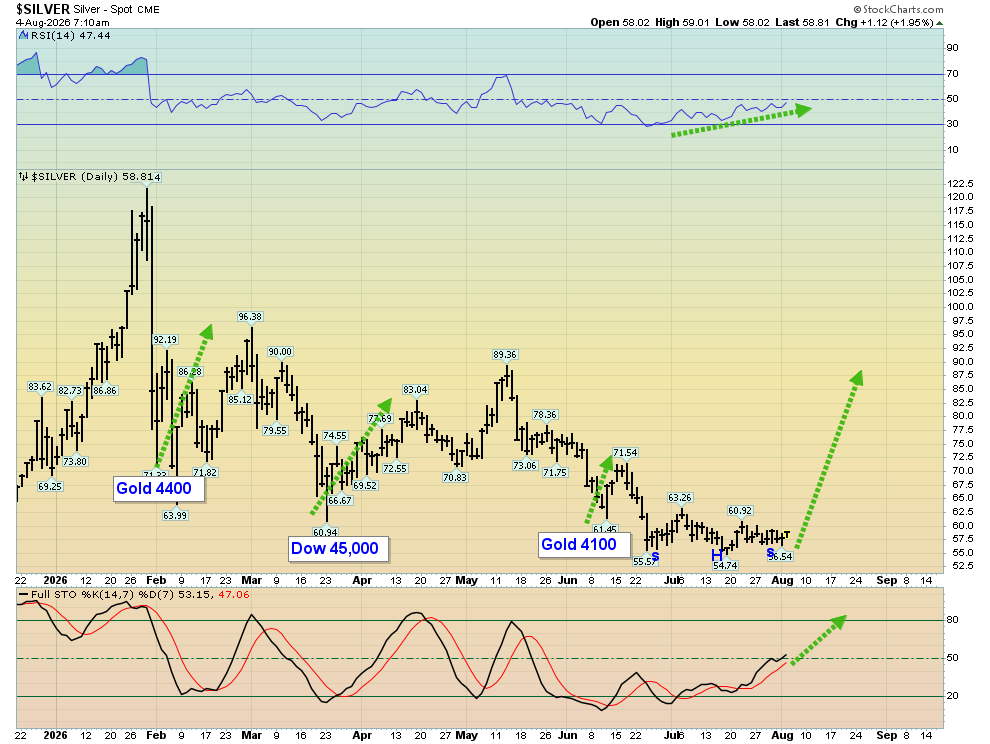
- For a look at silver, please click here now. Double-click to enlarge this daily chart. Within the overall consolidation, there have been three waves down.
- All three waves ended at key buy zones for silver bugs and now a much bigger rally is likely to occur.
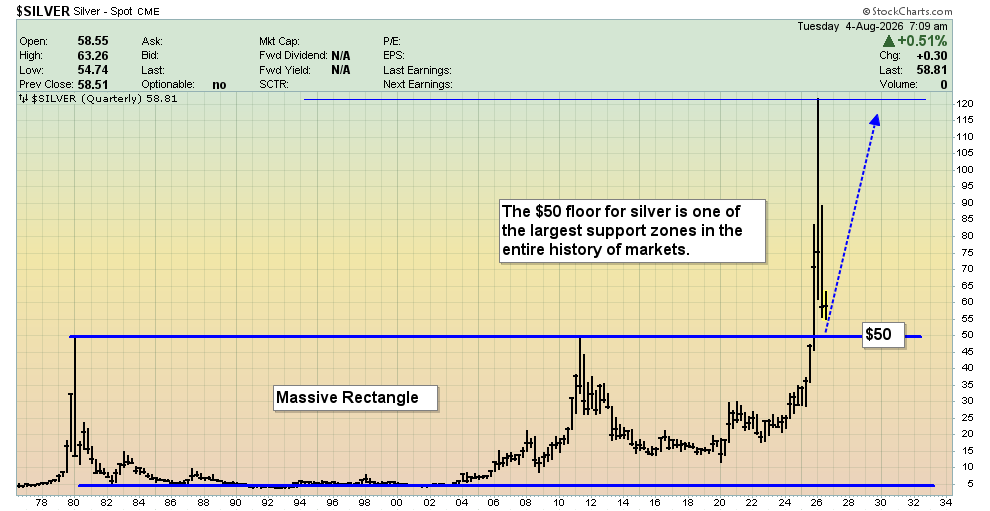
- For a look at the long-term chart, please click here now. Double-click to enlarge. It can be argued that the entire $60-$40 price area is one of the most important buy zones in the history of markets.
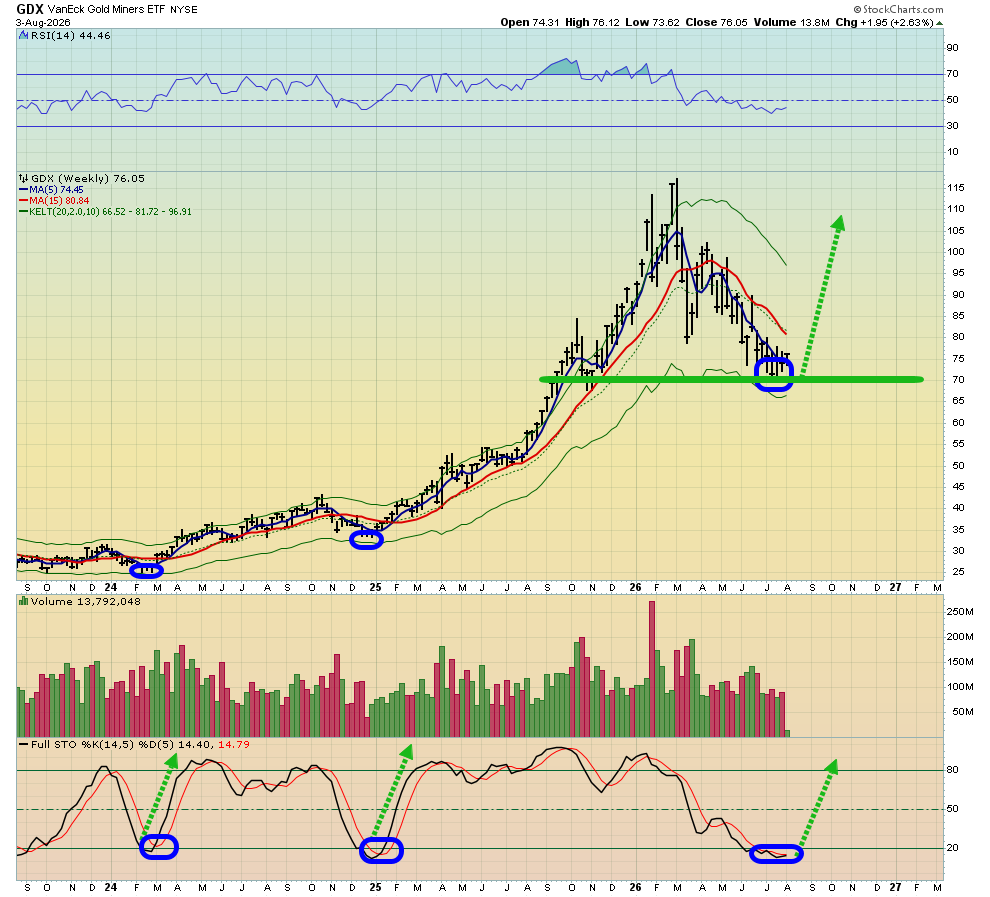
- The miners? Please click here now. Double-click to enlarge this GDX weekly chart. Interestingly, the $70 support zone coincides nicely with $4000 for gold.
- Note the oversold position of Stochastics. It’s now the most oversold in three years. For gamblers and investors alike, it’s a great time to buy!
Risks, Disclaimers, Legal
Stewart Thomson is no longer an investment advisor. The information provided by Stewart and Graceland Updates is for general information purposes only. Before taking any action on any investment, it is imperative that you consult with multiple properly licensed, experienced and qualified investment advisors and get numerous opinions before taking any action. Your minimum risk on any investment in the world is: 100% loss of all your money. You may be taking or preparing to take leveraged positions in investments and not know it, exposing yourself to unlimited risks. This is highly concerning if you are an investor in any derivatives products. There is an approx $700 trillion OTC Derivatives Iceberg with a tiny portion written off officially.
About the author
