
- Money continues to flow into sovereign bonds around the world… but what kind of money is it?
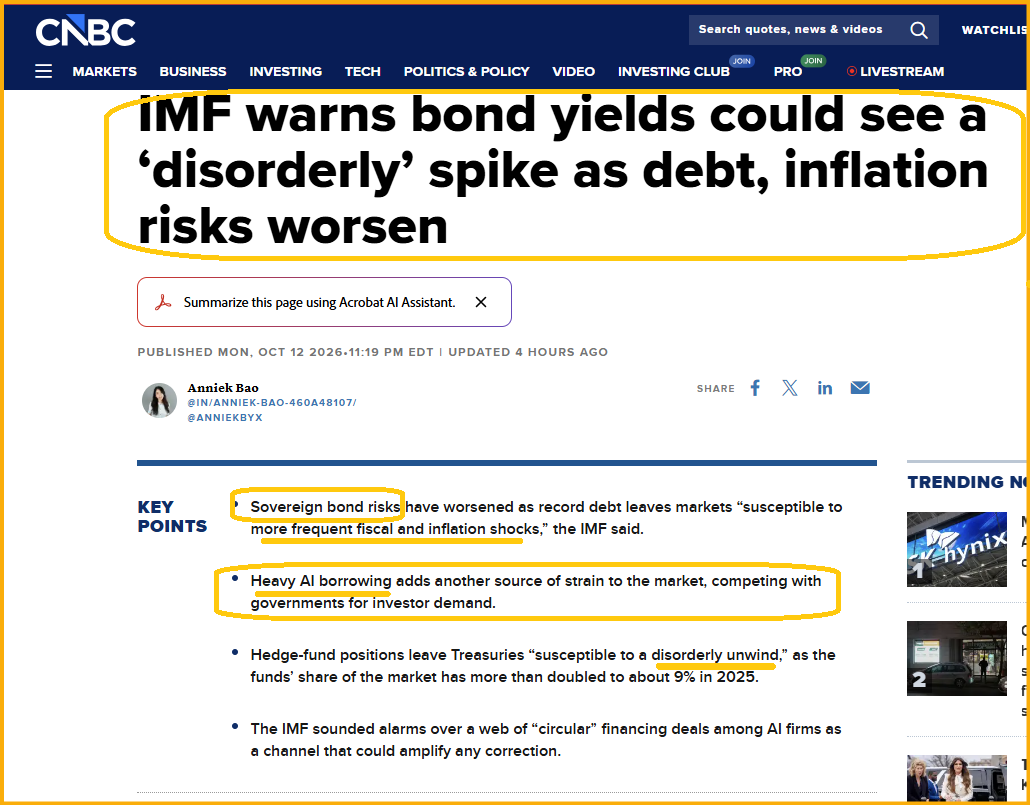
- First, it’s fiat money, and that’s a problem. Second, it’s money that’s aggressively leveraged by hedge funds, which is another big problem.
- Could the next global crisis be a sovereign debt crisis?
- It could, and to view the IMF’s take on this disturbing matter, please click here now. Click to enlarge. In a nutshell, while hedge funds gamble on sovereign debt, there’s an institutional stampede into high-risk AI bonds.
- The obvious question for all citizens of the world: Got gold?
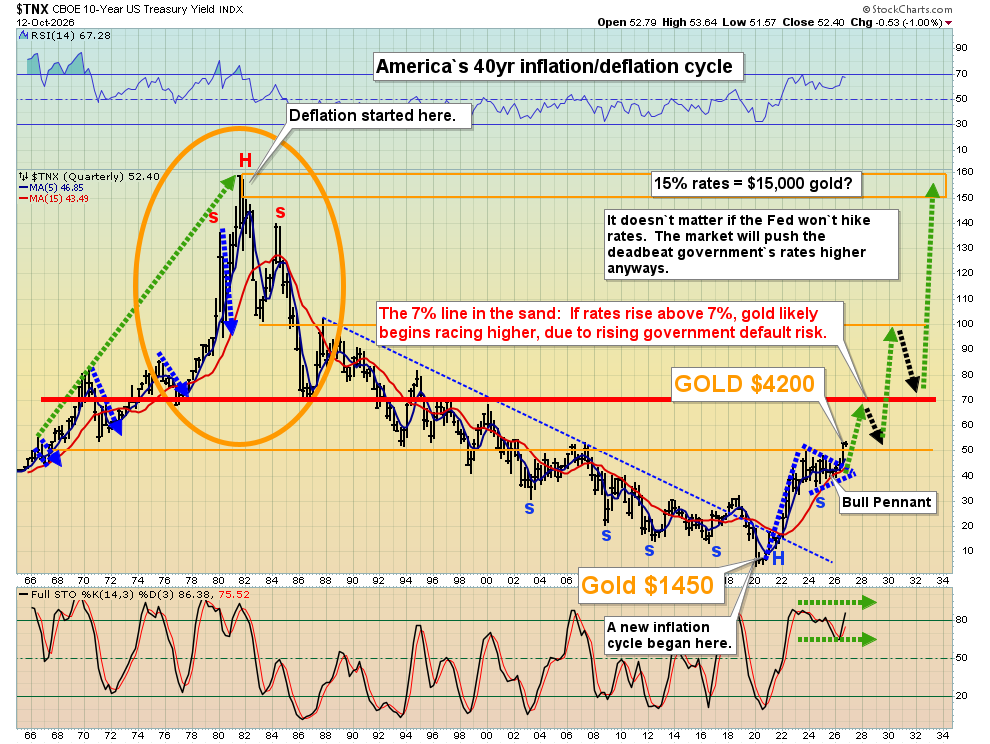
- Please click here now. Click to enlarge. High rates destroy most debtors, and the threshold for widespread destruction of government debtors is likely 7%-8%, based on US 10-year debt.
- Interestingly, gold has already moved from about $1450 to $4200… while rates have climbed from near-zero to over 5%.
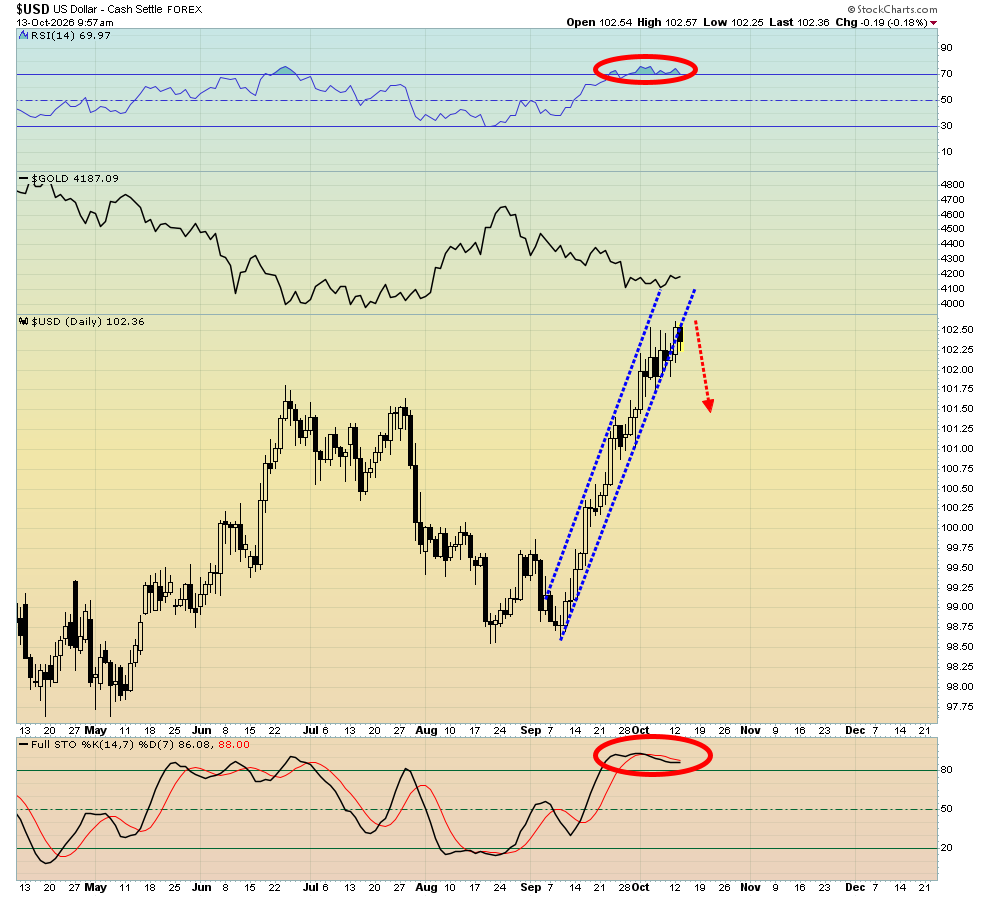
- Having said that, the biggest short-term spurts in gold have generally occurred when rates and the dollar index have fallen in tandem.
- While a sovereign debt crisis can drive gold tens of thousands of fiat dollars higher, when rates are well below the 7%-8% line in the sand, money managers, hedge funds, and retail investors are focused on the fact that gold pays no interest (in the West).
- On that note, please click here now. Click to enlarge. The dollar is significantly overbought on the daily (short-term) chart. RSI and Stochastics both have technical “nosebleeds”.
- Please click here now. Click to enlarge this short-term US 10-year rates chart. It’s also overbought. The uptrend line is being tested, and is likely to fail. http://galacticupdates.com/wp-content/uploads/2026/10/2026oc13rates.png
- That’s good news for gold.
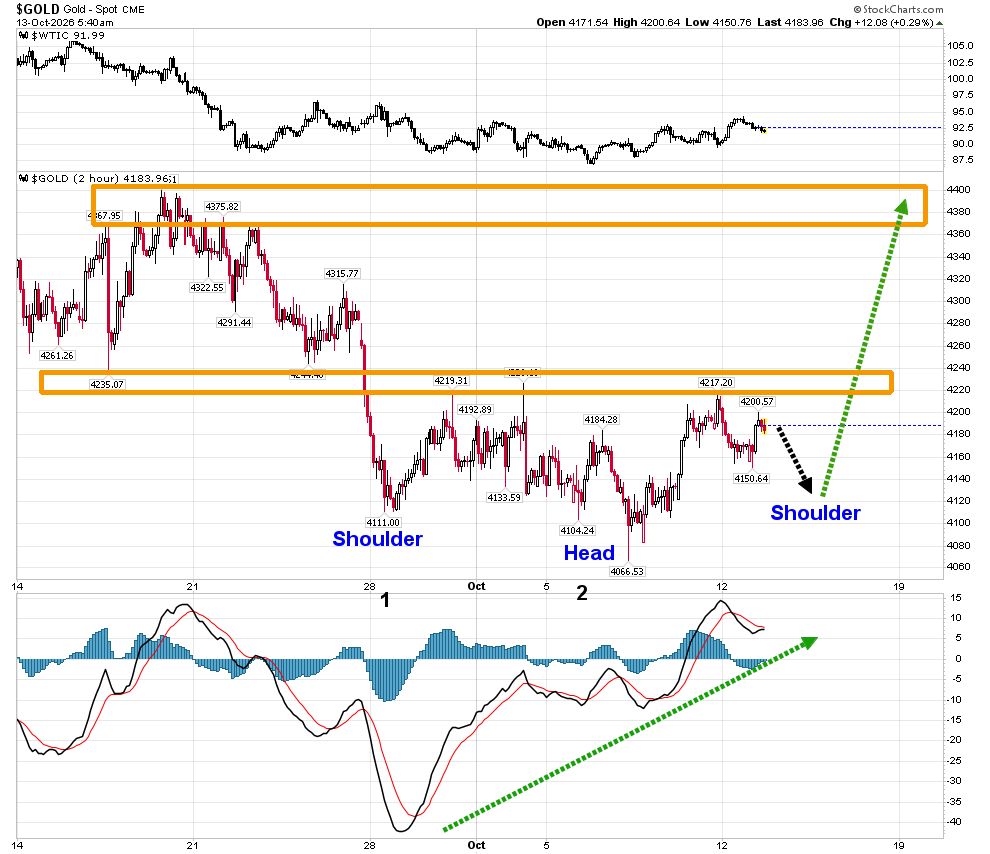
- Please click here now. Click to enlarge this hourly chart. A double bottom has morphed into a bullish inverse H&S pattern.
- The target zone is the $4400 area highs.
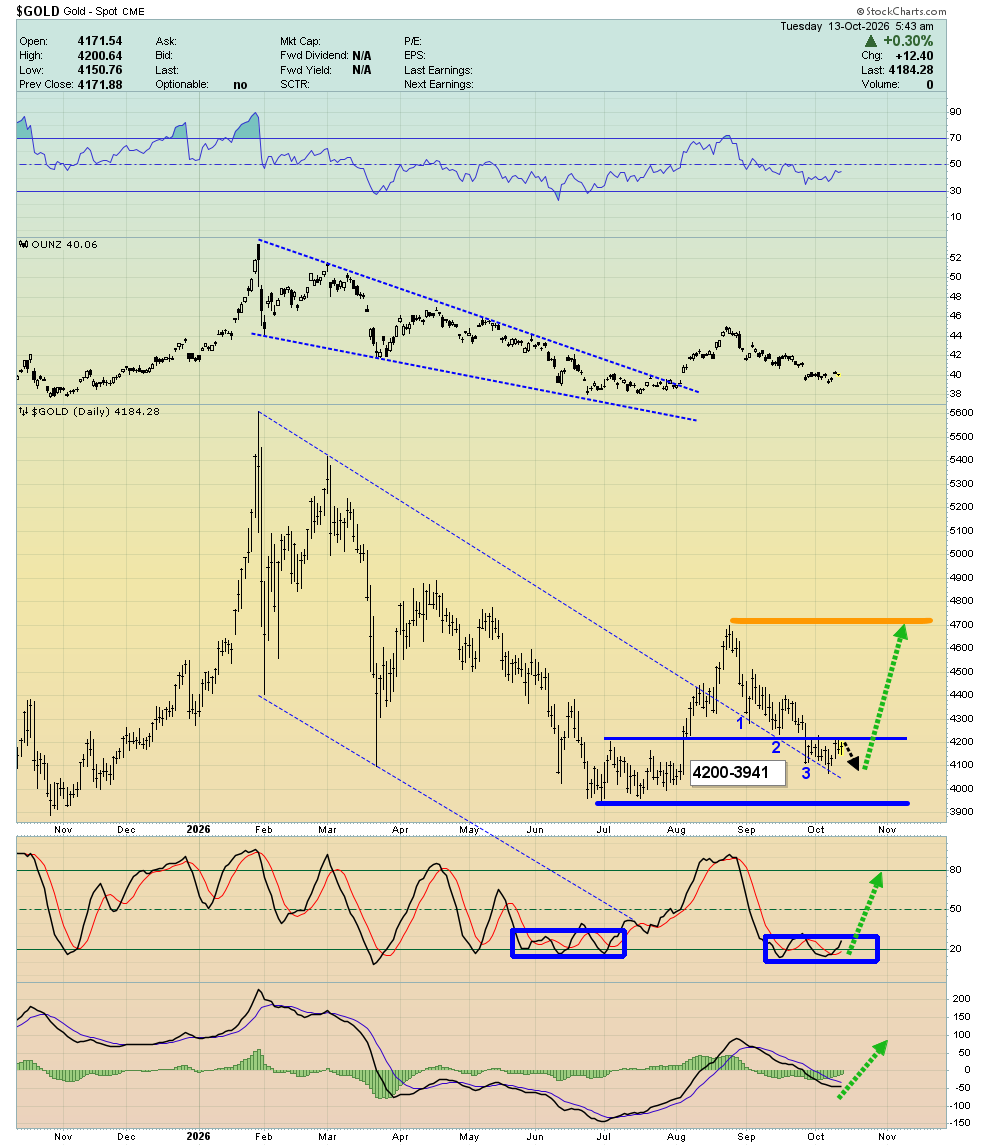
- For a look at the daily chart, please click here now. Click to enlarge. Stochastics is dramatically oversold and poised for both a buy signal and a breakout.
- That’s occurring as gold steadies in my $4200-$3941 buy zone. It’s a buy zone for not just gold, but for silver and miners too.
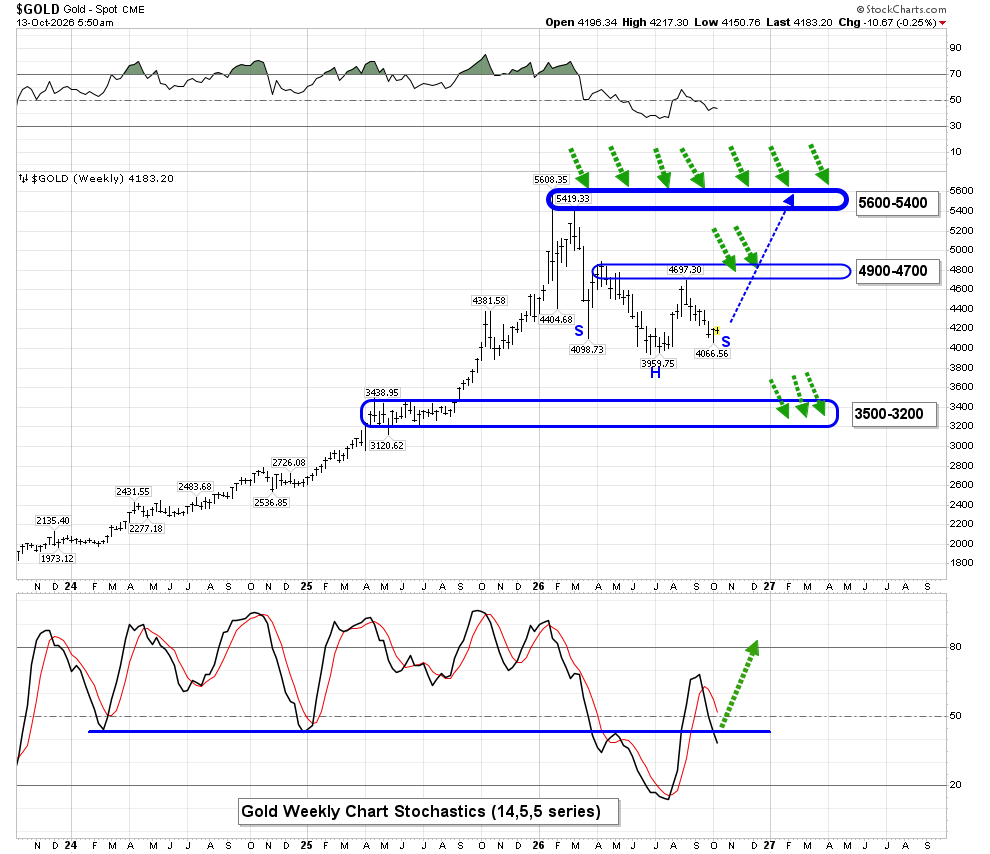
- Next, please click here now. Click to enlarge this weekly chart. A loose but large inverse H&S pattern targets the all-time highs.
- While it’s unlikely that gold trades at the buy zone of $3500-$3200, investors should be ready to buy there anyways. That’s because the fragile state of the global bond market means…“Anything can happen!”
- A daily focus on the big picture is critical for investors as inflation, tariffs, war, a wildly overvalued stock market, government debt horror, and empire transition dominate the investing landscape.
- Given the potential for a US dollar and interest rate tumble, once this week’s CPI and PPI inflation reports are out of the way, what’s most likely is a surge to $4700, and then to $5400.
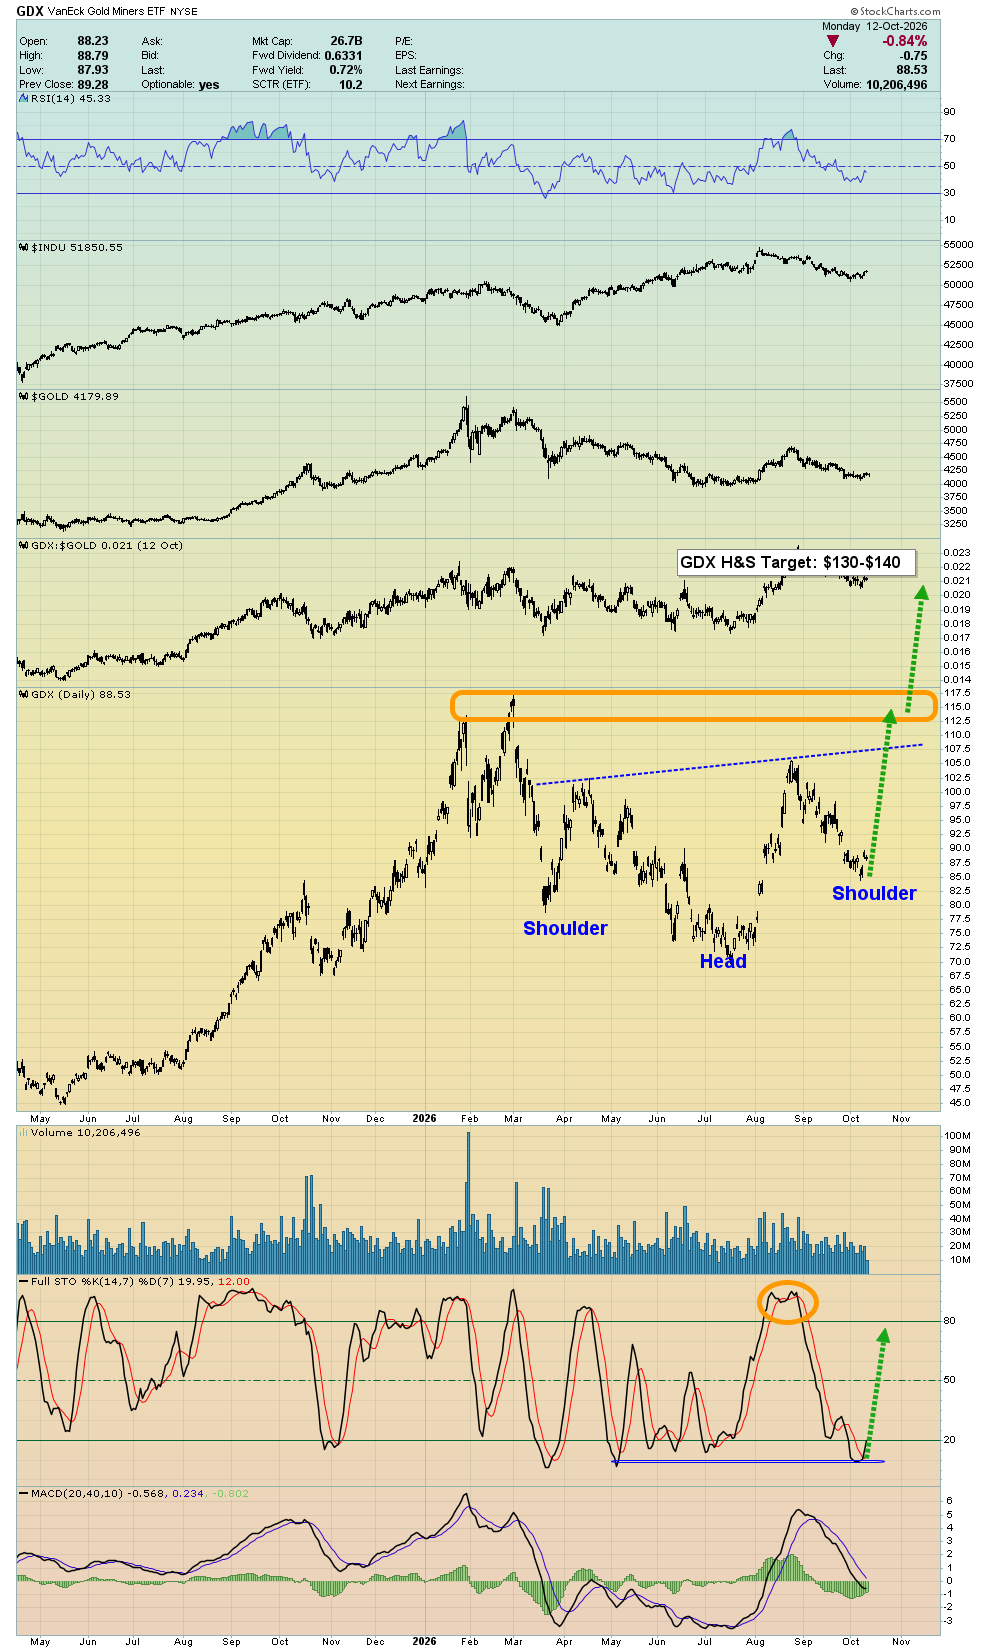
- What about the miners? Well, while the gold charts look good, the mining stock charts look truly spectacular.
- For a look at an important one, please click here now. Click to enlarge this “wow factor” GDX chart. The inverse H&S target is about $130-$140 and…
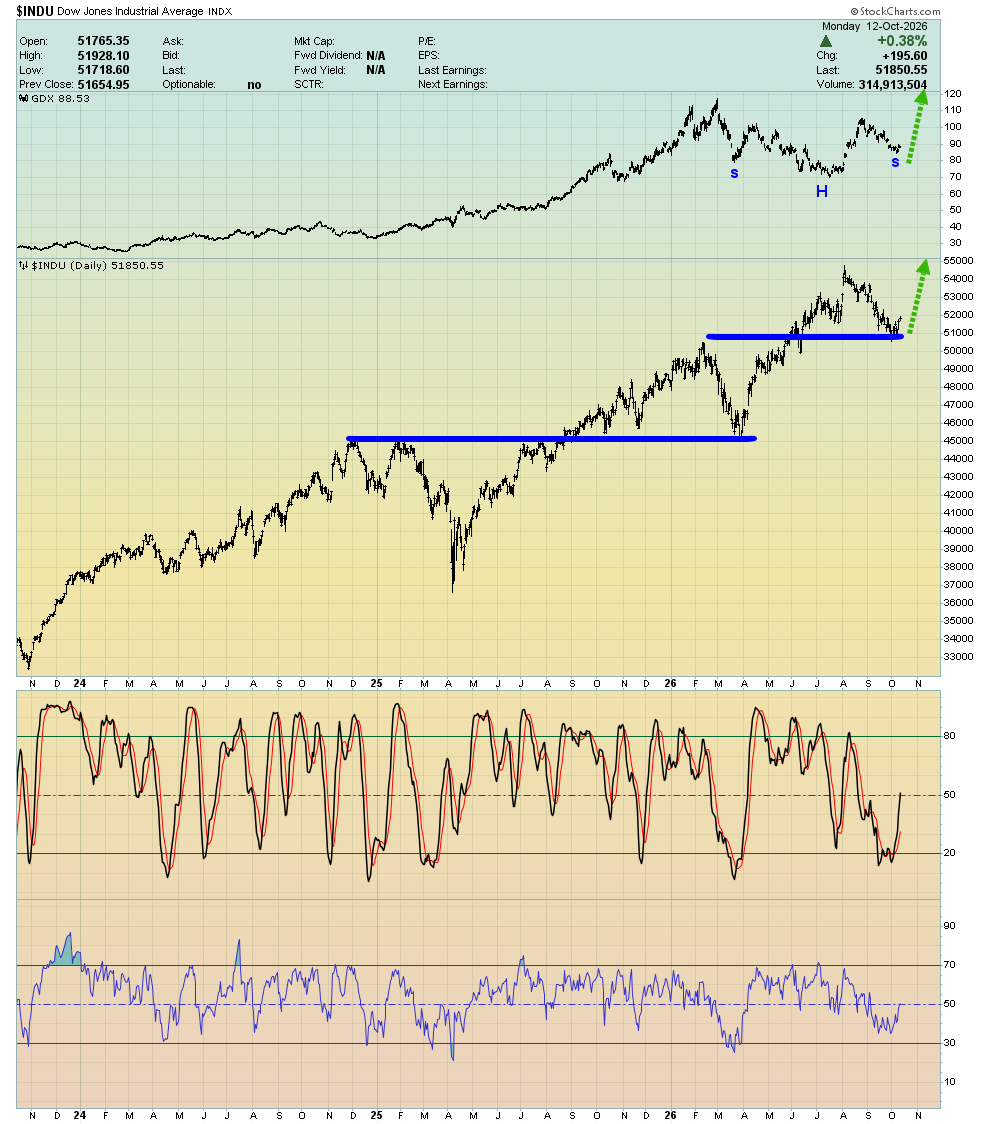
- Please click here now. Click to enlarge. Gold stocks are benefitting from the arrival of gold at the big $4200-$3941 support/buy zone, and from the Dow’s arrival at its significant support/buy zone of 50,500.
- It’s clearly win-win time for gold; a rise to 7%-8% for US rates financially annihilates a lot of global sovereign debt and probably makes the US government look like gold bull era roadkill… yet with rates in the 5% area now, a fall to about 4% is likely, and that could help blast gold to $5400 and GDX to fresh all-time highs in the $130-$140 zone!

Thanks!
Cheers
St
About the author
