
A monthly chart view of the gold price projects a break to blue sky, but needs to confirm a breakout first (and endure the noise of an ‘in the bag’ banking sector)
Lately, gold is gaining a lot of attention. Can’t you just feel it? The noise machine, long dormant with respect to the gold price and the precious metals complex in which it resides, is starting to crank up. Not surprisingly, the bullish festivities are being led by silver, the noisiest precious metal when it gets a move on. All aboard, because…

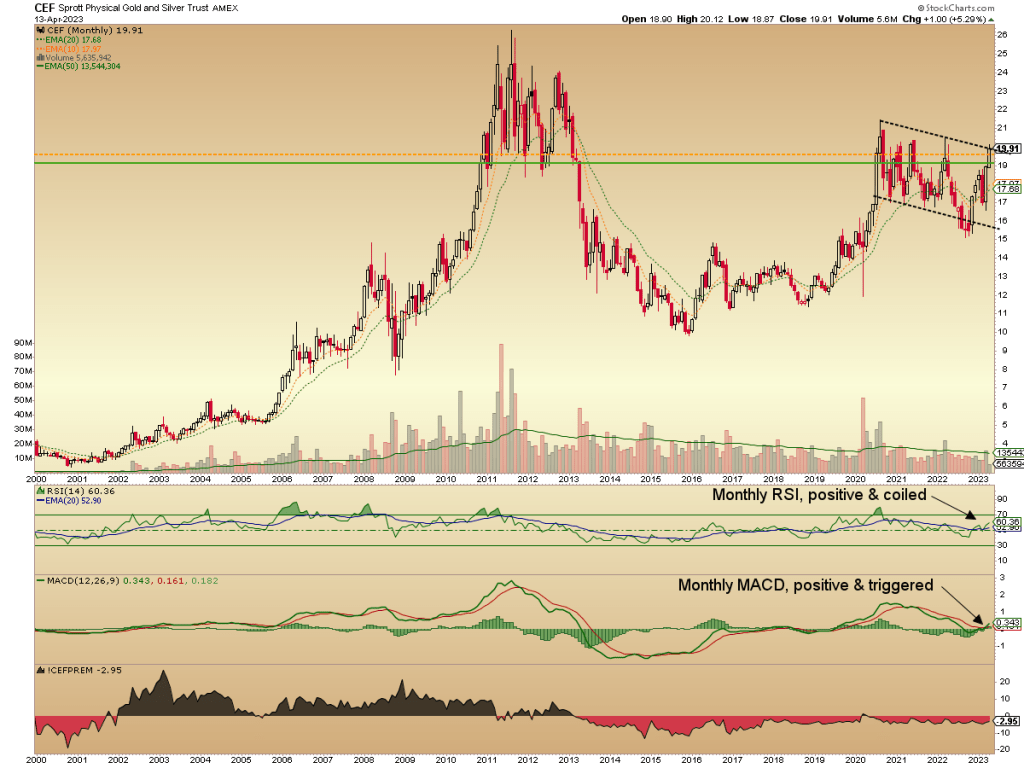
Below is a monthly chart of the Sprott Physical Gold and Silver Trust, CEF. As a Risk-o-Phobe myself, I started to get concerned about the froth that I anecdotally hear building out there in the Twitter machine and wider media. Indeed, while it does not look like much on the monthly chart, the discount to net asset value has been diminishing lately, but is still trading at a discount of 2.95%, actually retrenching yesterday on an UP day for the precious metals.
Part of my job is to manage risk and indicate risk for NFTRH subscribers. But now is a time to also realize that the other part of my job is to manage opportunity. While it is beyond the scope of this public article, NFTRH 753 is going to look at not only the precious metals, but the whole broad rally shootin’ match from both perspectives; the risk of a coming end to the broad bear market rally in stocks and some commodities, and the reward of staying with it. Top-down macro conditions for stocks, commodities and precious metals will be reviewed.
Dialing back to the bigger picture monthly TA, the chart begs attention, as it stands now. Positives are the aforementioned discount that CEF’s gold and silver is trading at along with monthly RSI now trending up (above EMA 20) and not overbought, and MACD triggered and not even in the same time zone as overbought. It’s a monthly chart and daily charts would show a different (overbought) picture. Short-term pullbacks/corrections aside, this big picture is coiled.
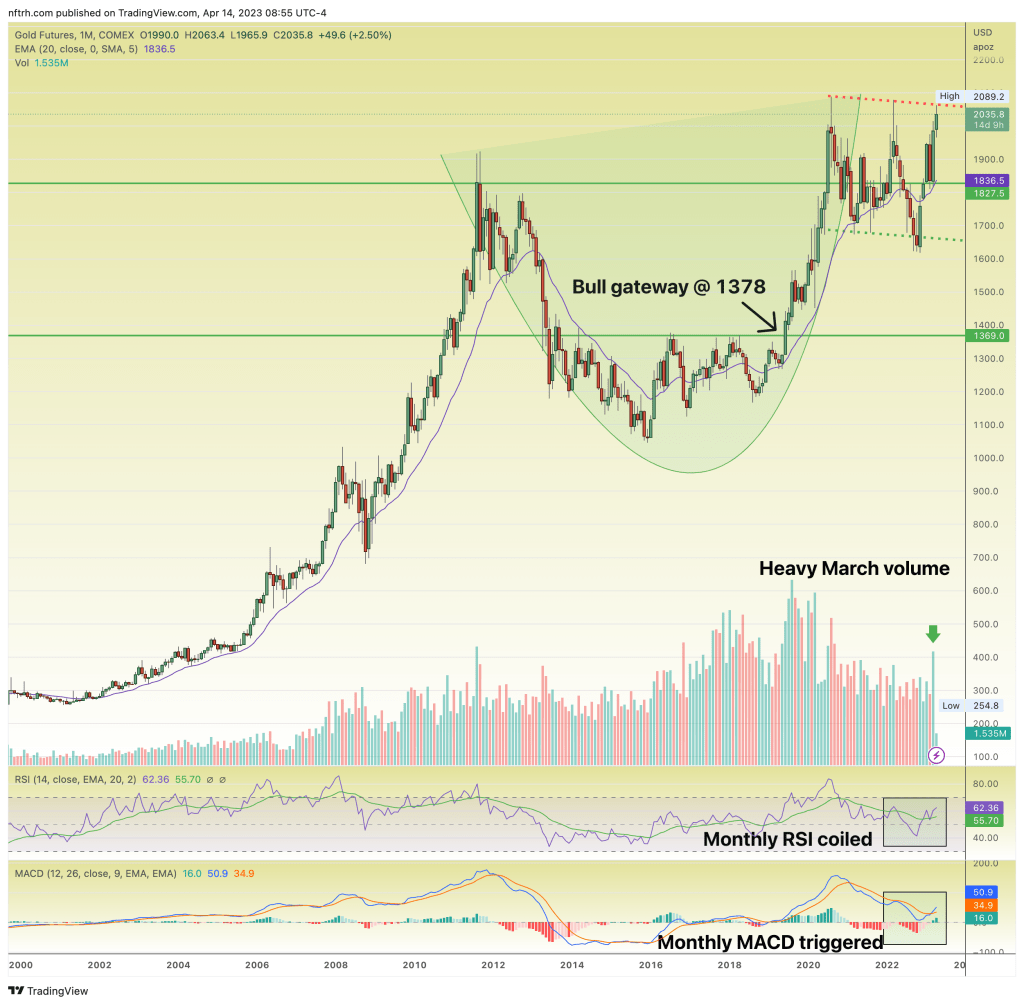
Let’s check in on the gold price using a monthly chart. As I write on Friday morning, the gold price is actually down a hearty $22/oz. after dinging the top line of the Cup’s handle. That is normal, folks. Even to be expected. There are similar structures in RSI and MACD to the Gold and Silver fund above. At this point a little tamp down of the hype is a good thing. A little corrective medicine now could go a long way toward sustaining the bullish patient’s energy for a would-be breakout from the handle in the future.
Today the gold price stopped where it probably should have. If a pullback morphs to a correction the 1950 area will be initial support. If a real ‘clean out’ correction were to come about (and I don’t see a clear reason for that at this time), then 1820 comes into play. Regardless of that, the situation is bullish. It’s just that the recent noise will have died down if an 1820 clean out were to come about.
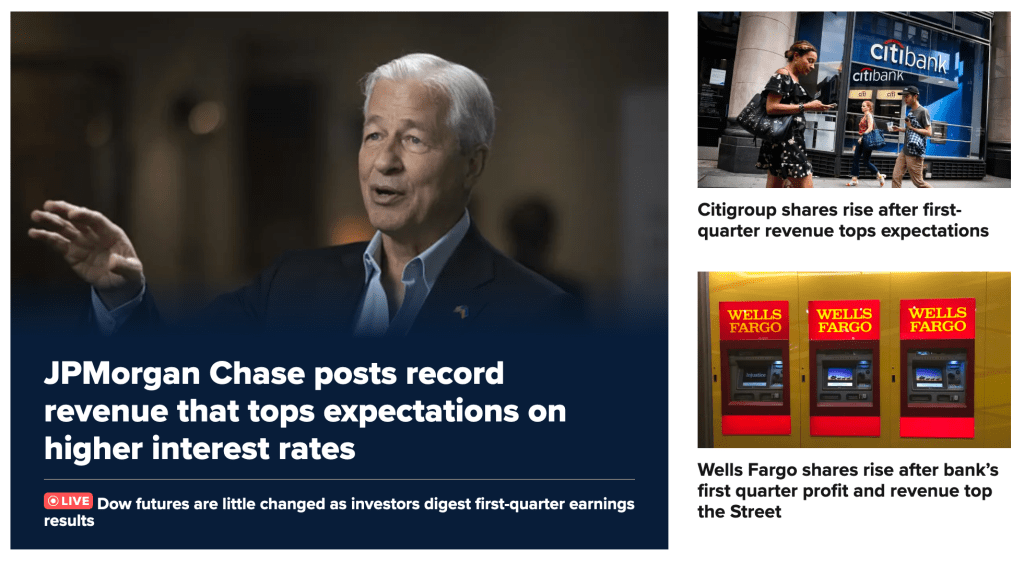
Now, why could this morning’s alarming (it’s not) drop in the gold price be taking place? Well, how about something that has been in the bag the whole time? “Banking crisis” relief, as noted in this audio/video (I’ve just started a YT channel and would appreciate it if you’d subscribe) and in several NFTRH editions to date. In the video (at 9:50) I called the banking noise a potential “sentiment afterburner” to the bear market rally in stocks, which is here to reset sentiment to over bullish from its wildly over bearish beginnings in Q4, 2022. You can click the image if you would like to read the happy JPM stuff (and note the other two happy bank headlines to its right).
[edit] The bank sector opened strong then sagged. So as yet it’s no bullish afterburner for stock market sentiment.
 cnbc.com
This NFTRH 752 excerpt explained some of the vulnerability of the gold price, which is playing out this morning as the happy bank headlines hit the wires.
The vulnerability in the gold market is in the elements that have driven the metal nominally and in relation to the cyclical, risk ‘on’ and inflation sensitive stuff. A spark of relief and casino patrons will go right back to normal “happy days are here again (and so is greed and FOMO!)” thinking. That could rhyme with our less favored broad rally upside scenario of a test of the highs (ref. SPX).
NFTRH 752
Just yesterday we noted that the Fed minutes nonsense about the “banking crisis” being the cause for a coming recession was a canard. I have not been concerned about the banks to this point as it has been little more than slight of hand for the ‘in the bag’ relief theme, not to mention a device to pull in the usual “END OF THE WORLD!!!” suspects (seriously, look around at the gold and bear websites and you’ll see plenty of those who took the bait and fed it to the herds).
It remains to be seen whether this spark from the bank sector will amount to much, but gold’s $22 pullback is on cue to that situation and a continued relief rally in the broad markets would too. Regardless of pullbacks and corrections, it never was going to be the “banking crisis” (ha ha ha) that was going to drive the gold price. Gold will go where it is going due to much bigger macro fish to fry than a papered over mini crisis in banking with the short-term relief play already in the bag.
For “best of breed” top down analysis of all major markets, subscribe to NFTRH Premium, which includes an in-depth weekly market report, detailed market updates and NFTRH+ dynamic updates and chart/trade setup ideas. Subscribe by Credit Card or PayPal using a link on the right sidebar (if using a mobile device you may need to scroll down) or see all options and more info. Keep up to date with actionable public content at NFTRH.com by using the email form on the right sidebar. Follow via Twitter@NFTRHgt.
About the author
