
Across the past 23 trading days (from 20 September) Gold traded per that date’s high of 1969 down -145 points (-7.4%) to 1824 (on 06 October) from which price then ascended +185 points (+10.1%) through yesterday (Friday) to as high as 2009 in settling out the week at 1993.
Further from the aptly-named “Short Memories Dept.” ’twas funny how the FinMedia and friends just two weeks ago were pronouncing the end of Gold as a viable source of wealth: now ‘twould seem they can’t get enough of it.
Moreover as suggested in last week’s missive, for Gold’s weekly parabolic Short trend ’twas “Three strikes and yer out!”, as provisionally penned in Thursday’s Prescient Commentary. And with the week having ended, that trend is now confirmed as Long per the fresh encircled blue dot:
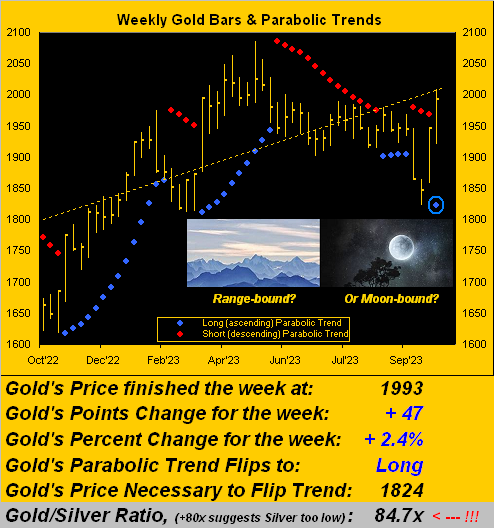
So: is Gold remaining range-bound? Or is it finally moon-bound? Let’s start with the former.
For the bazillionth time we postulate that “change is an illusion whereas price is the truth”. Whilst the low-information, short-attention span, instant gratification crowd have recently been yanked to and fro through Gold’s plunge before its ![]() “Going to a Go-Go”
“Going to a Go-Go”![]() –[Miracles, ’65], let’s focus on price, the truth to know. To wit:
–[Miracles, ’65], let’s focus on price, the truth to know. To wit:
Today’s 1993 price also traded during 34 of the prior 168 weeks going all the way back to that ending 31 July 2020. And as anyone who is paying attention knows, Gold’s infamous triple top (2089/2079/2085) has yet to be broken, (which they are meant to so do). Thus until the next All-Time High is achieved, price remains range-bound, for 1993 today ain’t anything over which to bray “Olé!” Here is price (i.e. “truth”) via the monthly candles from 2020-to-date, denoting the triple-top:
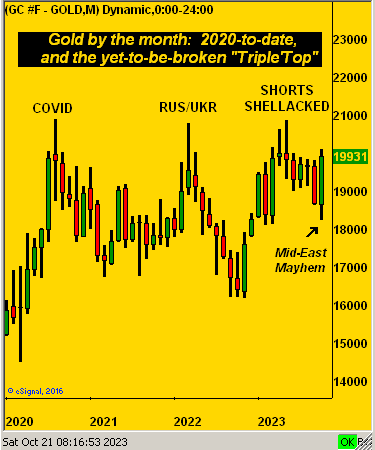
But what has not yet happened — and may not happen — is the usual Gold post-geo-political price spike decline. As herein penned a week ago: “…(to risk a terribly overused phrase) perhaps ‘it’s different this time’…” With reference to the above-labeled “Mid-East Mayhem”, two brutal weeks have passed since the Hamas/Israël incursion, Gold having initially spiked as anticipated. But given the typical historical time pattern of prior geo-political price spikes, now two full weeks hence, Gold has been void of retrenchment. The most recent prior example was early on in the RUS/UKR war, Gold twice spiking in 2022 on both 24 February and 08 March … only to trade beneath the initial spike as swiftly as 16 March, even as the war worsened. Not this time however as quite a number of bad actors fight for center stage in the “Who’s backing whom?” phase.
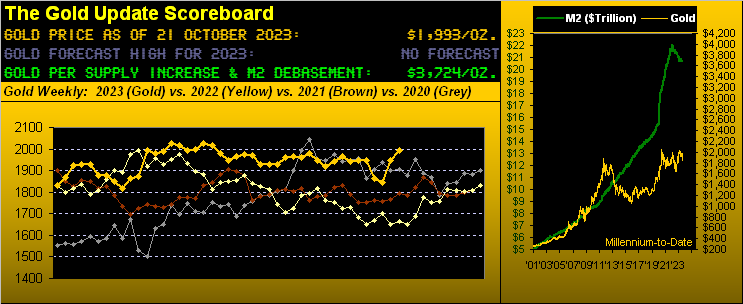
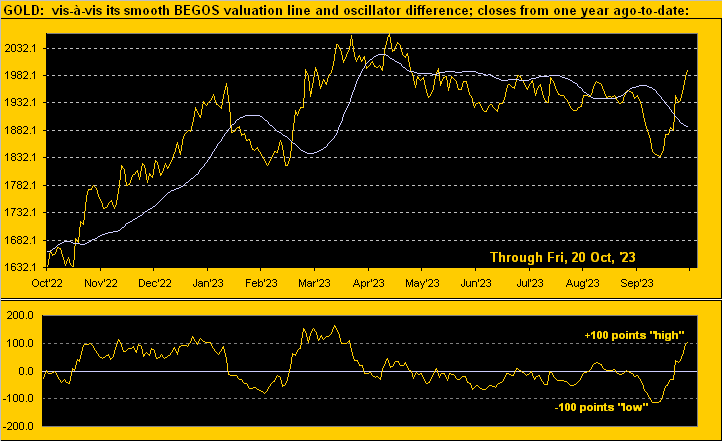
Recall too our citing Gold vis-à-vis its smooth valuation line per both the website’s Market Values and Gold pages. Just prior to the Mid-East mayhem, price already was better than -115 points below valuation: now ’tis +107 points above same per our next graphic. (Note: the valuation line compares Gold’s movement relative to those of the other primary Markets that comprise BEGOS, i.e. the Bond / Euro / Gold / Oil / S&P). Yet should Gold not materially retract — and instead its All-Time High of 2089 be eclipsed — then ’twill be fair to say Gold is moon-bound:
“So how high then is the moon, mmb?“
Squire rhetorically knows the answer to his softball question, (thanks mate!). Clearly moon-bound for Gold is to match its true Dollar debasement level, presently per the opening Gold Scoreboard at 3724. To be sure, such journeys can seemingly take forever: on 09 March 2012 that debasement level reached 2089; but such All-Time High for Gold was not achieved until better than eight years later on 07 August 2020. As valued charter reader THR oft quips “Gold will make you old”, but ‘twould be folly not to anticipate 3724 … and beyond! Or in the words of the Great Gleason: “To the moon, Alice!”
As to the destination of the economy, net-net ’twasn’t a nice week of incoming metrics for the Econ Baro. Some were improved, notably September’s Housing Starts and Industrial Production/Capacity Utilization. Conversely, October’s National Association of Home Builders Index weakened as did the NY State Empire Index; the pace of September’s Retail Sales slowed as did that for both Building Permits and Existing Home Sales; the Conference Board’s (lagging) set of Leading Indicators turned even more negative; and Business Inventories for August backed up. Nothing is easy. Here’s the Baro:
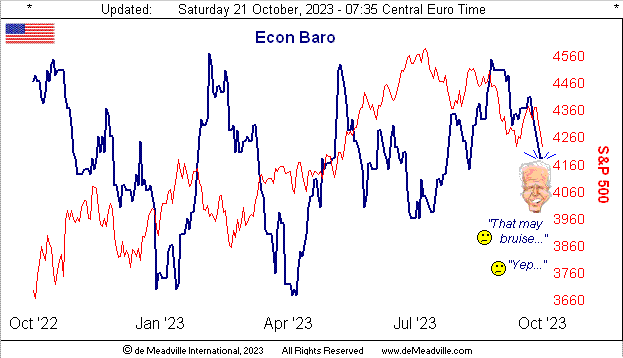
Neither is it easy for the S&P, given both the geo-political climate and the Index’s ongoing overvaluation, our “live” price/earnings ratio settling the week at 36.2x. And speaking of earnings, (or lack thereof), have you been following their Q3 season? Specific to the S&P 500, 68 constituents have thus far reported: just 34 (50%) of those bettered their bottom lines from a year ago. More broadly? ‘Tis worse: with 134 companies’ (of some 1800 to eventually report) results in hand, just 44% have bettered. Too as tweeted (@deMeadvillePro) this past Thursday, “Flow leads dough…” per our S&P MoneyFlow page depicting a more negative stance.
And again from the “They’re Just Figuring This Out Now? Dept.”, iconic ol’ Morgan Stanley finds U.S. Treasuries attractive at 5%. (‘Course you readers of The Gold Update have known for months that the T-Bill’s been yielding at least 5% since 18 April.) Oooh and this quick update: the market capitalization of the S&P 500 per Friday’s settle is now down to $36.9T; but the liquid money supply (“M2”) of the U.S. is only $20.8T. It doesn’t add up very well, does it? No it doesn’t.
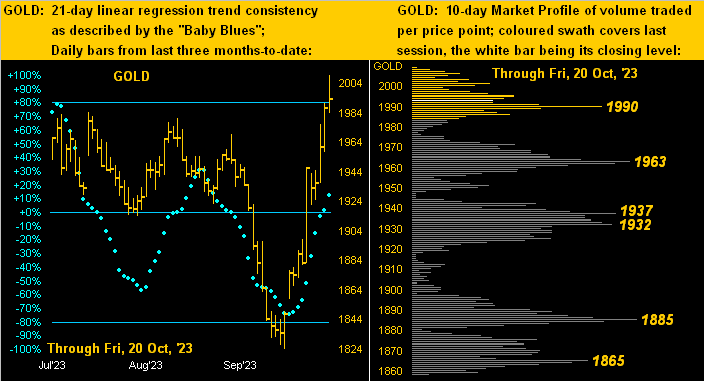
But ’tis adding up quite nicely for Gold as we next go to its two-panel display of daily bars from three months ago-to-date on the left and 10-day Market Profile on the right. The baby blue dots of trend consistency have only just crossed above their 0% axis, suggesting the uptrend has more ![]() “Room to Move”
“Room to Move”![]() –[Mayall, ’69] in spite of near-term technicals being somewhat stretched. Thus given some natural price retraction, we can see the key underlying support levels as labeled in the Profile:
–[Mayall, ’69] in spite of near-term technicals being somewhat stretched. Thus given some natural price retraction, we can see the key underlying support levels as labeled in the Profile:
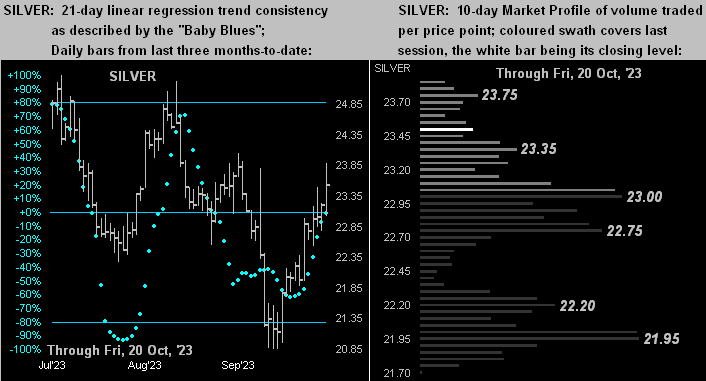
With the like drill for Silver, her “Baby Blues” (below left) are just on the threshold of turning positive whilst she exhibits a belly of Profile support (below right) in the upper 22s. (More broadly, Silver’s weekly parabolic trend still is Short, whereas aforeshown Gold’s is now Long). Nonetheless, Sister Silver is gaining that precious metal bid:
To sum up, ’twas a great week for Gold and a poor one both for equities and the StateSide Economic Barometer, the latter in the new week looking to the first peek of Q3 Gross Domestic Product and that “Fed-favoured” Core Personal Consumption Expenditures metric for September.
And with geo-politics continuing to dominate the airwaves whilst the lousy Q3 Earnings Season unfolds, one ought expect more of the same at least near-term, albeit liquid markets don’t move in a straight line. But the “Baby Blues” at the website’s Market Trends page tend to keep one on the correct side of it all.
Indeed all-in-all — at least until Gold posts a new All-Time High above 2089 — we still see price as more range-bound than moon-bound. But again, as Jackie points out to Alice:

Or as we time-to-time say: “Tick tick tick goes the clock clock clock…” Got your precious metals?
Cheers!
…m…
www.TheGoldUpdate.com
www.deMeadville.com
and now on Twitter(“X”): @deMeadvillePro
About the author
