
As a TA, I respect charts first and foremost. On occasion that respect has burned me as I’ve missed big profit opportunity or not seen a disaster unfolding that the charts missed. But much more often it helps me profit or saves me from disastrous ends. TA is just one tool in the box. An important one, but it should not stand alone. With the gold stocks especially, the correct macro-fundamentals matter.
Lately, with respect to the HUI Gold Bugs index, TA has helped me (and NFTRH subscribers) manage a low born of over-bearish sentiment at a key long-term support area (230 +/-), one of three downside targets we’ve had open since the correction began in summer 2020. For management of the correction and its bounces we’ve used various charts of varying detail and time frames. But last week in NFTRH 680 we simplified to the daily view below. With the rally now in full flight it is time to be paying attention to what may come next.
This week has seen a takeout of the pattern’s neckline and the 200 day moving average. All good, although RSI is starting to get overbought, much as it did after taking out the 50 day average. Aside from that, the yellow shaded pattern is showing up repeatedly now in the gold bug-o-sphere and that means it is being touted as well. Understand that even if this Inverted H&S expresses itself to target, it’s only a short-term situation and said target is well below the real bull/bear decision point, which is the May high of 327.45. So if you hear any talk of a ‘major bull pattern’ or some such nonsense associated with this I’d advise you to run, not walk away from that analysis.
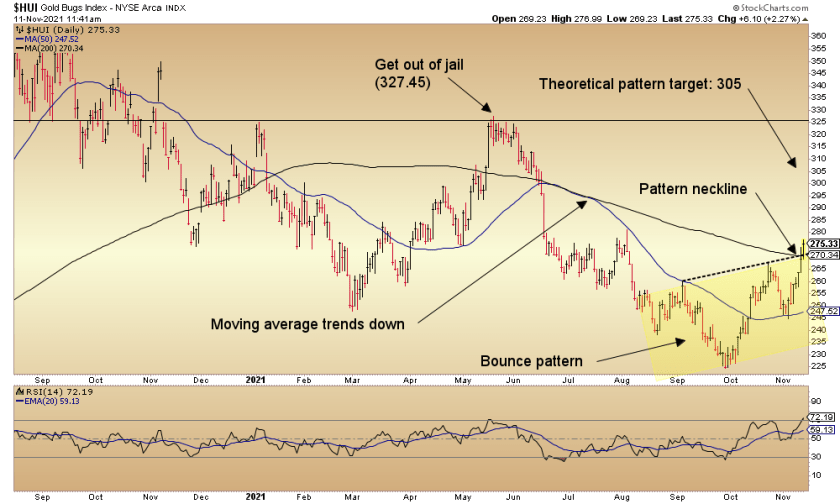
The bull pattern on the daily chart above could rally all the way to its measured target at 305 and still not break the downward Handle that has been the sum of Huey’s correction since the summer of 2020. A failure there would be painful to those expecting big upside now, but it would not alter the bullish big picture for gold stocks that is a significantly paler version of the very bullish big picture for gold.
In the short-term a gold stock rally can be enjoyable, but don’t let these girls cheer you too far in that direction unless all you care about is the big picture. These girls are cheerleaders. It’s what they do. It’s their job. Your job, however, is to get the markets right on your preferred time frame.
 The Golden Girls will always be cheering at a top. Always. No exceptions. We’ve proven that over and over again. Here is just one such occasion, which signaled for us the imminent 2020 failure.
So aside from the technical, another consideration in the gold stock sector is sentiment. If the current rally began amid bleak sentiment it will end, or at least be interrupted at some point, amid euphoric sentiment. Anecdotally, the bugs are starting to beat the drums but don’t seem to be at full, rally stopping vigor just yet.
Bottom Line
There is more to the picture, including the technical, macro/sector fundamental, sentiment and seasonal states of gold, silver and the miners. We’ll be managing all of that in NFTRH, as usual. The big picture for all three is, in my opinion, very bullish. But within that big picture there is some ‘play’ in the steering wheel in that the technicals are short-term bullish, long-term bullish and intermediate-term still open to two very different scenarios.
What’s more, the macro fundamentals have not yet decisively turned. For inflationist gold bugs they have, but inflationist gold bugs (or at least gold mining bugs) could be the problem yet again when the inflation trades fall apart and they start a new panic selling ritual.
As to HUI and the gold miners, on which I am bullish for 2022…
Short-term: Bullish technical, sentiment starting to froth, macro fundamentals not yet recovered.
Intermediate-term: Constructive technical but not triggered, macro fundamentals not yet recovered.
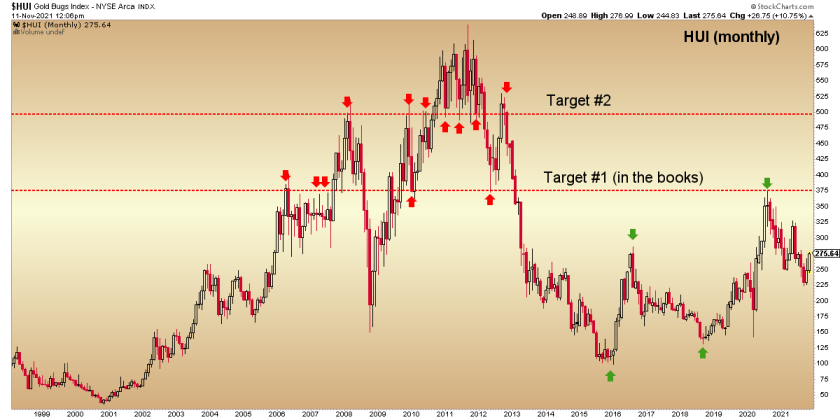
Long-term: Bullish but still potential to make another low prior to a real rally that would finally break the Handle on the monthly chart above and take out 327.45. When the cyclical inflation fails or morphs stagflationary, we’ll see a return to macro fundamental health for the counter-cyclical sector.
Consider the TA over different time frames, watch for improvements in the real fundamentals and beware loudly over-bullish sentiment and you’ll get where you’re going just fine.
Final note: Despite the cautionary tone of some of the above, I am at this time long the metals and the miners (and exploration and royalty). Hence why I want to stay on top of events every step of the way.
For “best of breed” top down analysis of all major markets, subscribe to NFTRH Premium, which includes an in-depth weekly market report, detailed market updates and NFTRH+ dynamic updates and chart/trade setup ideas. Subscribe by PayPal or credit card using a button on the right sidebar (if using a mobile device you may need to scroll down). Keep up to date with actionable public content at NFTRH.com by using the email form on the right sidebar. Follow via Twitter @NFTRHgt.
About the author
