
Analysis:
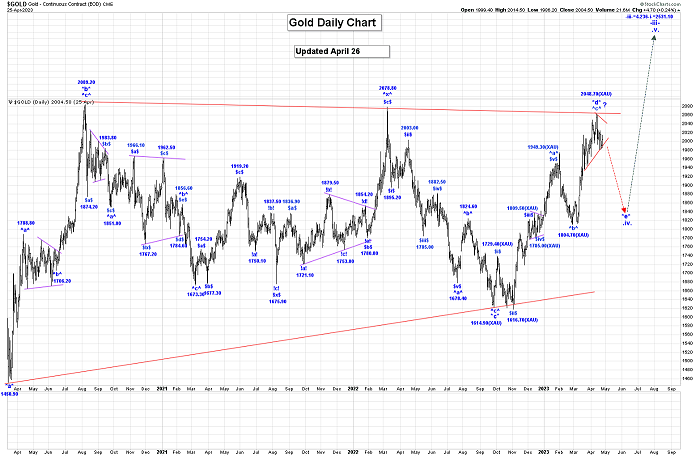
Wave *c* of our very large wave .iv. bullish triangle ended at 1614.90 (XAU). From that low we continue to rally in wave *d*, which appears to be a simple 3 wave pattern, with all of wave ^a^ ending at the 1949.30 high.
Wave ^b^ is complete at the 1804.70 low, and we are heading higher in wave ^c^ which may be complete at the 2048.70 high.
We now need to be on guard for the completion of wave ^c^ and all of wave *d*. Wave ^c^ can continue higher but for our current bullish triangle formation to remain valid we cannot now trade above the wave *b* high of 2089.20.
The one complication we have with all of wave ^c^ being complete at the 2048.70 high is that it seems like the GDX still wants to go higher!
On the Intraday Chart we are once again watching an expanding and extending bullish triangle formation that started at the 2009.80 high. The current legs of that bullish triangle are:
a = 1934.40;
b = 2048.70;
c = 1969.40, if complete;
d rally is now underway, and we cannot rally above the wave b high of 2048.70;
e drop after wave d ends.
After this bullish triangle formation ends, we expect a thrust higher.
This analysis would support what we are seeing in the GDX.
After wave *d* ends we expect another drop in wave *e* to complete all of our large wave .iv. bullish triangle.
There is an outside chance that all of wave *d* ended at the 1959.80 high and all of wave *e* at the 1804.70 low. This would indicate that our bullish wave .iv. triangle formation ended at the 1804.70 low, and we are now thrusting higher in wave .v., which has a projected target of:
-iii- = 4.236-i- = 2531.10.
Trading Recommendation: Go Long gold. Use puts as stops.
Active Positions: Long gold, with puts as stops!
Special Offer For Gold Bugs: Our subscriptions are $289 for 3 months, which is great value. For gold community readers, we have a special offer of $269 for 4 months, good through this week! If you want to do it, please click here or send us an Email and we’ll give you a payment link. Thanks!
S&P500:
Analysis:
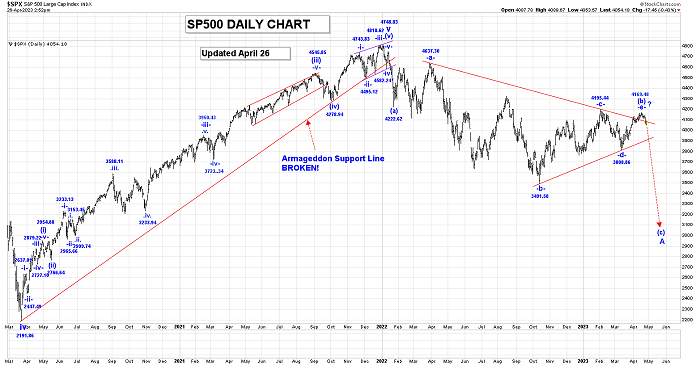
Wave v is complete at the 4748.87 high as a failure high. We have now started a multi-decade correction (bear market).
We have updated our count to adopt our large bearish triangle option as shown on our Daily SP500 Chart. In general, we are falling in a 3-wave pattern, and within that pattern we are falling in wave A.
Within wave A, we completed wave (a) at 4222.62 and are now working on an almost complete wave (b) bearish triangle.
Within that triangle, wave -c- ended at 4195.44 and wave -d- at 3808.86, and we are now rallying in wave -e-, which could be complete at the 4169.48 high. After our large wave (b) bearish triangle ends we expect a very large thrust lower in wave (c) to complete all of wave A.
For our current wave (b) bearish triangle formation to remain valid we cannot rally above the 4195.44 high, otherwise it is likely expanding and extending.
We will need to update the count our 60 Min SP500 Chart to reflect our bearish wave (b) triangle option, which we will do after wave (b) officially ends.
Trading Recommendation: Go short with calls as stops.
Active Positions: Very short with calls as stops!
USDX:
Analysis:
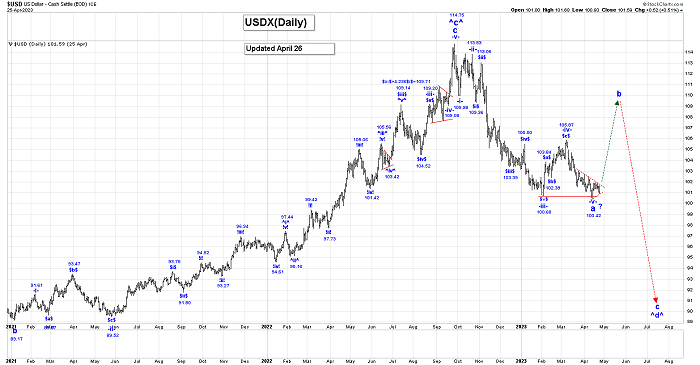
All of wave ^c^ is complete at the 114.75 high and we are falling in wave ^d^. The wave ^d^ drop must consist of at least one 3 wave pattern, so for the moment we will assume that we are falling in wave a of ^d^.
On our Daily USDX Chart we have shown our count for wave a, which may now be complete at the 100.42 low, although we are still waiting for confirmation.
On the Intraday Chart we are watching a potential bearish triangle formation that started at the 101.55 low. That triangle formation looks like:
a = 103.10;
b = 100.47;
c = 101.94;
d = 100.93;
e = 101.58, if complete, to complete the bearish triangle formation.
If this observation is correct then wave a is not complete at the 100.47 low, and we should expect one more drop below that level, before all of wave a ends. This triangle formation could expand and extend.
After wave a ends we expect a wave b rally that is expected to retrace between 50 to 61.8% of the entire wave a drop.
Trading Recommendation: Flat.
Active Positions: Flat!
Thank-you!
Captain Ewave & Crew
Email: admin@captainewave.com
Website: www.captainewave.com
Free Offer For Website Readers: Please send me an Email to admin@captainewave.com and I’ll send you our free “GDX: Bullish Wave Counts In Play!” report. A special update on Kinross is also included in the report!
About the author
