The Gold Update by Mark Mead Baillie --- 651st Edition --- Monte-Carlo --- 07 May 2022 (published each Saturday) --- www.deMeadville.com
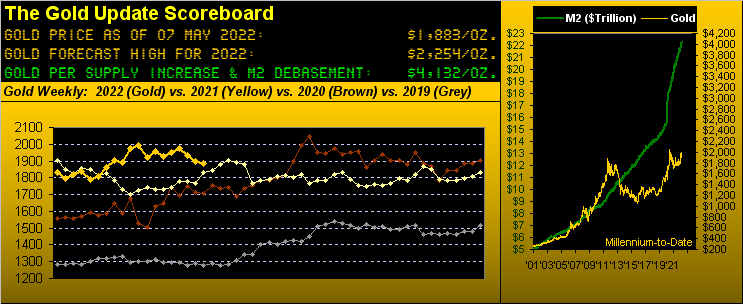
With reference back to our 02 April missive entitled "Gold Seeks Support as its Trend Flips Short", price this past Monday and Tuesday finally tested the uppermost area of said 1854-1779 critical support zone; Gold then bounced a bit in settling its weak week yesterday (Friday) at 1883. To wit, the updated graphic of Gold by the day-to-date in 2022. At right you can see the test of the support zone, price's geo-political RUS/UKR "spike and fade" now some two months in arrears:
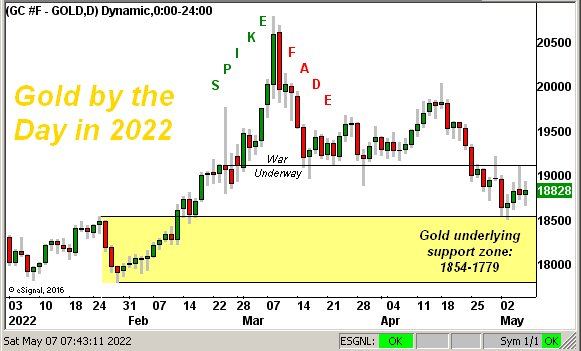
'Course, it remains to be seen if Gold re-tests that support zone, let alone penetrate it more deeply. As stupefying as 'tis to find Gold at such lowly levels given our 4132 opening Scoreboard valuation -- like it or not -- the weekly parabolic trend as below shown remains Short, the rightmost declining red dots now six weeks in duration per our year ago-to-date view. Note the Gold/Silver ratio is up to 84.2x, nearly a 22-month high:
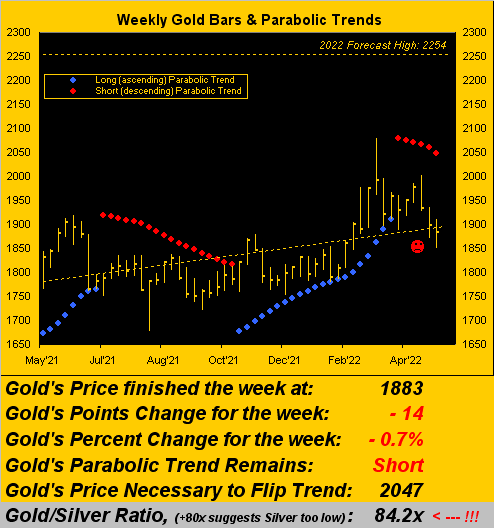
And it can be said -- as much as we oft put forth that Gold plays no currency favourites -- the Almighty Dollar by its Index just recorded a high (104.105) not seen in nearly 20 years (since 23 December 2002). The first occurrence of Gold reaching today's 1883 level was on 22 August 2011, "The Dixie" that day settling at 74.250; yet too, (by "M2"), there are 2.4x as many Dollars out there now as there were then. Clearly a "Federal Reserve Note" is worth more than a Gold anything. (By the way, we've a bridge for sale, if you're interested). "Got Gold?"
Sharing this week's title of course are stocks, which as measured from the S&P 500's 04 January all-time high of 4819 have since corrected -14% in settling the week at 4123. You regular readers know we're anticipating the S&P's correction this year to reach down into the 3587-3198 structural support zone: that begins -13% below present price.
But wait, there's more: in the spirit of the long-running 1950s TV series "You Asked For It" --[DuMont Television Network], now back by popular readership demand we've updated the following two daunting S&P graphics, both as last herein presented on 04 September 2021 ("Own Gold with Reason into S&P Crash Season") in anticipation of it all going wrong, which obviously it now rightly is.
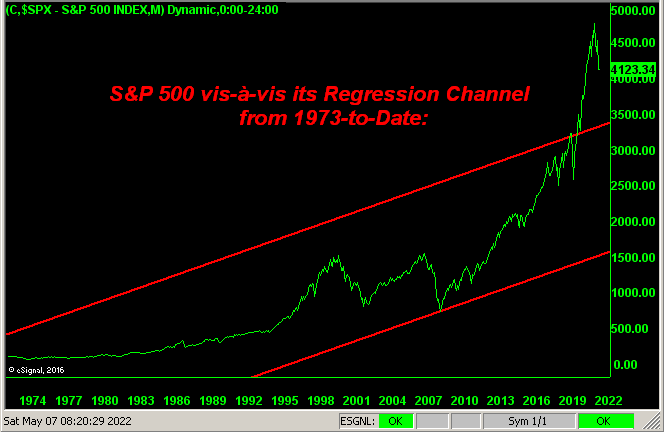
■ First for the past 50 years-to-date, we've the S&P's regression channel vis-à-vis the Index's monthly closing prices, provisionally including yesterday's settle at 4123 for May. The current level of the upper channel line is 3325; that is -19% below present price:
■ Second for the entire lifetime of the S&P 500 (i.e. from March 1957-to-date) we've the evolving mean (red line) of the "live" price/earnings ratio (green line) right up through yesterday's settle at 32.3x. Obviously as you can see, the P/E has always returned to its mean, (today 22.3x); that is -45% below the present P/E:
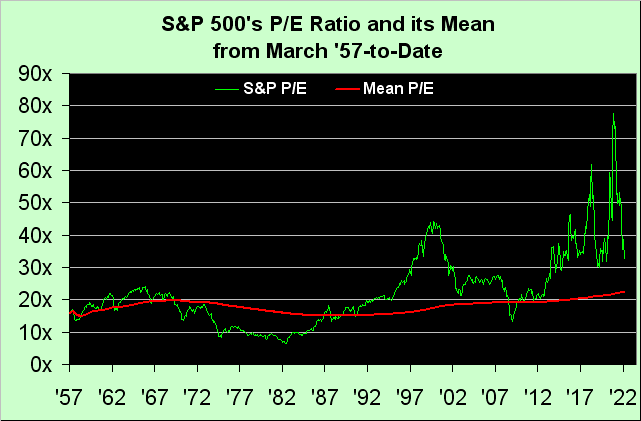
'Course, as stodgy as is Q1 Earnings Season (413 of the S&P's 504 constituents having thus far reported) with a full third having not bettered their bottom lines from COVID-infused Q1 of 2021, the median year-over-year increase of the 399 constituents having reported positive earnings in both Q1s is +9.7%. But clearly that's not been good enough to move the P/E needle back down to normality, (although by the graphic it looks well en route toward getting there as is its historical wont).
Indeed for those of you scoring at home, if we arbitrarily assign a median year-over-year earnings increase of +10%, at today's S&P level of 4123, that only lowers the P/E to 29.4x. Thus to meet today's mean of 22.3x, the S&P need drop to 2843, well below our aforementioned 3587-3198 structural support zone. (Too much math perhaps, but with the summer BBQ season soon setting in, you'll need to be able to expound upon all this to keep your neighbours in awe). Have a great day.
Further -- albeit hardly aiding the state of earnings going forward -- is the Federal Reserve's seemingly adamant stance to continue interest rate increases, even as REAL Gross Domestic Product has shrunk for three consecutive quarters, (see the scary graphical depiction in last week's missive "Gold's Lower Grind and the Fed's REAL Bind").
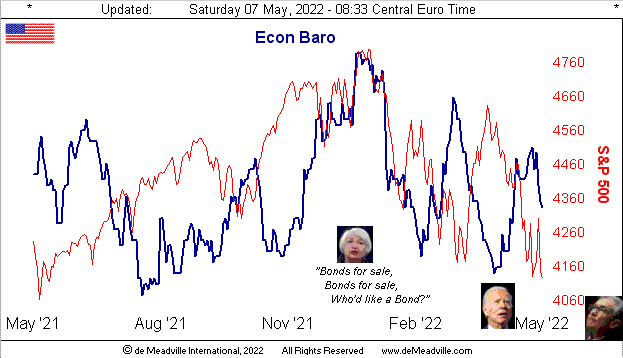
Moreover, 'twas a bum week for the Economic Barometer. Of the 14 incoming Econ Baro metrics, only three improved. And March's Consumer Credit hit its highest level for the 25 years we've been recording data, even as American's are "quitting" their jobs in droves. That is not good. And how about Q1's Productivity declining -7.5% --- with Unit Labor Costs rising +11.6% --- OUCH! Here's the Baro:
"But mmb, why work when you can sit home and day trade..."
Again, Squire, that is the quintessential sign of a market top!
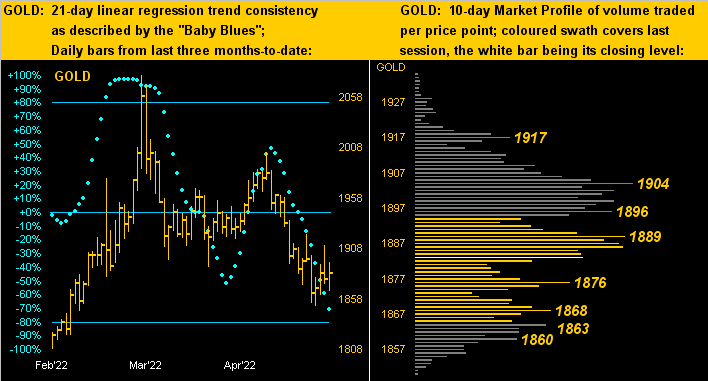
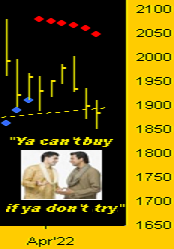
'Course, far from its top (2089) -- let alone its valuation level (4132) -- is Gold as we next see on the left in the three-month panel of daily bars, the baby blue dots of trend consistency in full cascade. Whereas on the right in Gold's 10-day Market Profile, price at least made some headway from the low (1850) traded earlier in the week:
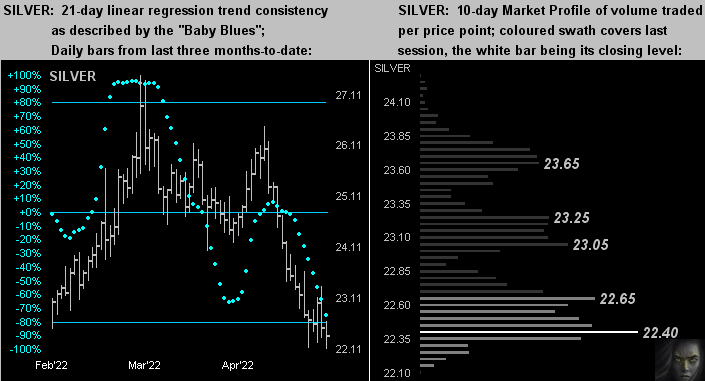
Silver naturally hasn't had nearly the respect accorded Gold (the Gold/Silver ratio earlier noted). Friday saw price hits its lowest level (22.11) in three full months per the rightmost bar below left, whilst in the Profile below right, 'tis still the basement for poor ole Sister Silver:
Peeking ahead at next week's Econ Baro gathering of 10 incoming metrics, there's a bit of further down-side bias based upon "consensus" versus "prior period". Inflation data highlights the week with that at the Retail level on Wednesday, then that for the Wholesale level come Thursday. And some highlighted upside Gold grind against stocks' decline would be most welcome!
Cheers!
...m...

