Gold’s reactions to material US-Iran war news in recent months have been backwards. Contrary to logic and precedent, gold has plunged when the war intensified and rallied when it cooled. Several potential explanations for this odd technical behavior suggest it will prove a short-lived anomaly. The longer Iran can keep the globally-critical Strait of Hormuz closed, the more bullish gold’s short-term outlook becomes.
Since Trump went to war with Iran at the end of February, most of gold’s biggest daily moves have been spawned by war news. For example on March 18th gold plunged 3.6% after Israeli airstrikes hit Iran’s South Pars natural-gas field, the largest in the world by far. On March 31st, gold blasted 3.7% higher on the WSJ reporting that Trump told his top advisors he was willing to end his war without the Strait being reopened.
This war-is-bearish-peace-is-bullish gold trade has become so pronounced that gold charts reveal when material war news hits. The last thing I do before bed and first thing when I wake up is check out 24-hour price charts to see what key markets did overnight. If gold surged, I know there was some peace-deal-imminent hype even before I check newsflow. If gold plunged, I know there was some military escalation.
Those reactions are the exact opposite of how gold reacted to flaring geopolitical risks in many decades of history. Normally crises arising or worsening fuel a strong gold bid, with safe-haven demand from flight capital driving it higher. After Russia invaded Ukraine in late February 2022, gold soared 7.5% in under two weeks! Despite this Iran war being radically riskier economically, gold has plunged 15.3% since it launched.
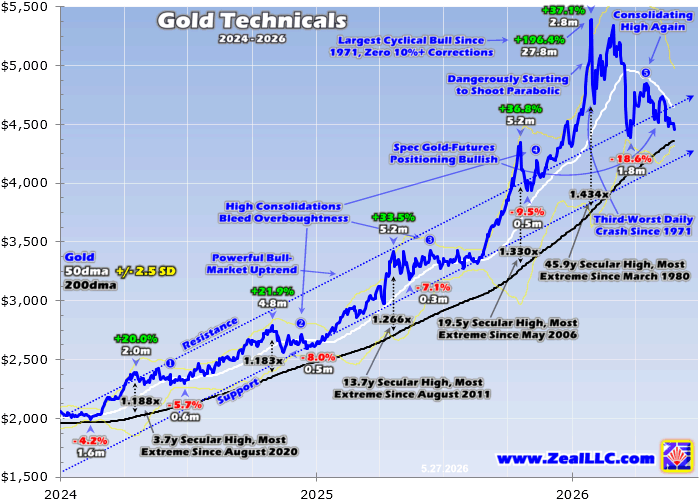
Back in late March I wrote an essay on gold’s war disconnect trying to explain this mounting anomaly. Gold had just soared an astonishing 196.4% in 27.8 months into late January, its biggest cyclical bull ever in US-dollar terms! That epic monster record bull climaxed with gold’s most-extreme overboughtness in a whopping 45.9 years, since March 1980! That demanded a serious reckoning to rebalance sentiment and technicals.
On average after gold’s next-ten-largest cyclical bulls since 1971, the subsequent drawdown ran 20.8% over just 2.1 months! By late March gold was indeed challenging that post-extreme-bull standard, falling 18.6% in 1.8 months. When gold bounced hard out of that selloff low despite plenty of escalatory war news at the time, it looked like that healthy corrective process had largely or completely run its course.
Yet in April and May, gold’s biggest daily moves continued to be sparked by war news. And those price reactions continued to be backward, gold falling when things heated up and rallying mostly on Trump’s many Truth Social posts touting an impending US-Iran deal. Thus there had to be more to gold’s ongoing contrary reactions than a post-monster-bull reckoning. Gold’s late-March low of $4,390 has still held strong since.
Wall Street analysts have lately described gold as a source of funds or emerging-market piggy bank. The first idea is gold is selling off when Trump’s war intensifies because worried traders are selling one of the most-liquid assets to raise cash. That could be used to ensure adequate margin on other trades, to finance buying other assets lower on selloffs, or simply to boost cash balances to reduce overall portfolio risks.
Yet the second idea is more compelling and more likely to explain gold’s backward war trade. The Strait of Hormuz has been effectively closed for 89 days now! About 1/5th of both this entire planet’s crude-oil and liquefied-natural-gas demand need to pass through that narrow strategic chokepoint every day! It also hosts about 1/3rd of the world’s seaborne fertilizer trade, 1/3rd of its helium, and half its seaborne sulfur.
And there’s more, including about 1/5th of the world’s raw aluminum exports transiting the Strait. So the longer it is pretty much shuttered, the worse global supply situations get for many key industrial feedstocks and products. The resulting soaring prices particularly in energy are putting extreme pressure on plenty of countries’ economies. The biggest case in point is Turkey, which has faced a rough war-driven crisis.
Turkey is a major importer of crude oil and oil products, relying on other countries for over 9/10ths of its entire demand! While most comes from Russia and Iraq, crude-oil prices skyrocketing 45.8% in the first two weeks of Trump’s war put tremendous pressure on Turkey’s currency which it needs to sell to buy oil. The long-troubled Turkish lira plunged to record lows against the US dollar, a serious problem for that country.
That not only restricted Turkey’s ability to import critical oil, but catapulted domestic inflation way higher. In mid-May, the Central Bank of the Republic of Turkey hiked its year-end inflation target from 16% to 24% as the latest annual read blasted over 32%! Nothing fuels political unrest like people not being able to afford life’s necessities. Turkish 10-year bond yields soared to record highs of 35.8%, which is dreadful!
Turkey’s central bank saw this coming back in mid-March as oil prices soared, and quickly tried to arrest the lira’s plunge. So it dumped about 1/10th of its official gold reserves, including 52.4 metric tons in a single week! Before that Turkey’s gold reserves were the 10th largest in the world, so that was a lot of gold to force feed into global markets. That’s why gold plummeted 14.9% in eight trading days in mid-March!
That shocking drop as Trump’s war raged seriously impaired investors’ confidence in gold. That was how the emerging-market-piggy-bank thesis arose. Countries struggling with soaring energy prices need to raise big funds to either import oil and its products, subsidize energy prices in their own economies to keep them lower for political reasons, and shore up their falling currencies. Turkey didn’t just dump gold either.
That central bank’s latest reserves data last week revealed in March it also liquidated an astonishing 7/8ths of its entire US Treasury holdings worth $14.2b! So Turkey’s frantic gold puking wasn’t just a gold thing, its central bank was desperately selling anything to attempt to defend its free-falling currency. India has had similar problems since, as that country also relies on imports for 7/8ths of its oil and oil-products demand.
That’s also a political crisis, as over 2/3rds of Indian households rely on liquefied petroleum gas to cook their food. Over 6/10ths of that is imported as a finished product from the Persian Gulf through the Strait, with the rest refined domestically with about half those oil and natural-gas feedstocks also coming from the Gulf. LPG isn’t common in the US, and is mostly a mix of propane and butane. It is very important to India.
India’s rupee has also plunged to record lows against the US dollar on the worst energy shock in world history from the Strait’s closure. So in mid-May its desperate government took a different tack on gold. Gold is India’s second-largest import after oil, so India’s government more than doubled import tariffs on gold and silver from 6% to 15% to retard demand! Indians are big gold buyers with a deep cultural affinity.
Global investors worrying about the impact of India’s gold restrictions were a major factor in gold’s slump in recent weeks to retest late March’s post-Turkey-dump selloff low. Gold’s brutal mid-March plunge on Turkey’s liquidation and mid-May’s slump partially on India clamping down on gold imports are readily evident in this chart. These two unusual events largely fueled then reinforced gold’s backward war trade.
So it’s understandable why the narrative on gold has grown so bearish in recent months. But that doesn’t mean gold’s backward war trade will persist in coming months. Like most popular themes in markets, this one is exaggerated and oversubscribed by the herd. Key fundamental data has already proven the primary component of gold’s backward war trade is false. Despite Turkey’s dump, central banks aren’t fleeing gold.
After every quarter, the World Gold Council publishes the best-available global gold supply-and-demand data in its fantastic must-read Gold Demand Trends reports. With Turkey’s central bank reporting puking out 58.4t of gold over two weeks in mid-March, analysts following this expected to see world central-bank demand plunge. Yet Q1’26’s still weighed in at a strong 243.7t, right at the prior-eight-quarter average of 242.8t!
The WGC’s analysts reported “The largest seller of gold in Q1 was Turkey, where official sector holdings fell around 70t (approximately 10% of total official sector holdings) … The bulk of the sales came in March … these sales appear to be tactical in nature, with holdings having stabilised around 535t during April … There is precedent in both 2020 and 2023, when Turkey employed its substantial gold holdings in times of need.”
On India’s import restrictions announced weeks after that Q1 GDT’s release, analysts estimate those way-higher tariffs could slow India’s gold demand by up to 1/4th in 2026. Per that GDT, Indian consumer gold demand including jewelry and bars and coins totaled 721.1t in 2025. A quarter of that would make for a 180.3t shortfall this year. But that could easily be absorbed by other investors around the world.
The WGC’s data pegged global gold investment demand at 2,204.0t in 2025, 3/7ths of overall world gold demand. That projected Indian shortfall would be less than 1/12th of that. While certainly material, that wouldn’t be a mortal blow to global gold demand. And that’s likely to prove quite strong in 2026 as the inflation tsunami unleashed by Trump’s war increasingly hits. That’s going to wreak havoc around the world.
Global crude-oil and oil-products demand is about 103m barrels per day. Pre-war about 20m of that flowed from the Persian Gulf through the Strait of Hormuz. Now three months into the Strait’s effective closure, cumulative losses to oil supplies are estimated to be over 1,100m barrels. That’s about 12m per day, mostly because Saudi Arabia and UAE have pipelines bypassing the Strait allowing them to export about 7m.
But despite oil, diesel, gasoline, and jet-fuel prices soaring during this war, they would’ve shot way higher if there wasn’t a colossal drawdown in global stockpiles to avert a devastating supply shock. Those came from both national strategic petroleum reserves and commercial tank farms. By all accounts that flood of stored oil will dwindle in June as tanks near the lowest levels their pumping systems or owners will allow.
Meanwhile Iran has realized its greatest weapon isn’t nukes but its ability to effectively halt shipping traffic through the Strait. As a huge mountainous country with endless asymmetric-warfare capabilities surrounding the Strait on three sides, Iran can periodically lob drones or missiles at commercial ships to keep them from attempting transit. Every day the Strait remains largely closed puts more pressure on Trump to fold.
Iran is well aware of the rapidly-approaching US midterm elections, and Trump’s deeply-unpopular war and its economic consequences fueling growing anger among American voters. Iran knows Trump faces endless political problems if Democrats regain control of Congress, so Iran will keep the Strait as closed as it can for as long as possible. That means the war inflation is going to get much worse later this year.
When global oil stockpiles buffering the lost Strait supply wane, crude-oil and oil-products prices will shoot much higher. Necessary to transport all physical products, already-soaring diesel prices will push general prices higher. Soaring fertilizer prices and shortages resulting from the Strait’s closure hit at the worst-possible time, the northern hemisphere’s spring planting season. So food yields will be lower come harvest.
And it gets worse. The US is experiencing a severe drought, the driest start to any year in recorded history! At the same time a Super El Nino is forming in the tropical Pacific Ocean, as water temperatures are way above average. That will also adversely affect US food production in different ways depending on the region. Farmers also planted less crops as they struggle to afford soaring fertilizer and diesel prices.
These coming well-higher energy and food prices are going to put serious stress on all economies, including the US. Consumers forced to pay much more for life’s necessities will have less discretionary income to spend, weighing on corporate earnings. That will hit lofty stock markets, along with bond yields driven higher by rising inflation. Weaker stock markets really boost gold investment demand for diversification.
American stock investors who command the largest pools of capital in the world by far remain virtually uninvested in gold. Enamored by the AI stock bubble, they continue to largely ignore gold. One way to consider their portfolio allocations compares the value of the gold bullion held by the massive world-dominating US GLD, IAU, and GLDM gold ETFs with the total market capitalization of the elite S&P 500 stocks.
Midweek GLD+IAU+GLDM held $247.0b worth of physical gold bars in trust for American stock investors. That’s considerable, yet still dwarfed by the S&P 500 stocks’ total value of $68,423.6b. That implies the portfolio gold allocation of American stock investors is 0.36%, just over 1/3rd of one percent! So they have vast room to buy as inflation inexorably marches higher really weighing on bubble-valued stock markets.
American gold-futures speculators who often dominate short-term gold price action with their extreme leverage also have huge room to buy. Per the latest-available weekly data, total spec long contracts are running less than 3% up into their trading range during gold’s late monster record gold bull! Spec longs are back near late-February-2024 levels when gold was still near $2,030. Specs can chase and amplify gains.
Technically gold slumped back down to just 2.1% above its baseline 200-day moving average midweek. That was a far cry from late January’s crazy-dangerous 43.4% above, so gold’s high consolidation since has mostly normalized technicals. That left gold the least overbought it has been in fully 27.4 months, since mid-February 2024! After consolidating high for 3.9 months now, the stars are aligning for a gold upleg.
The enduring high gold prices since late January despite the big ongoing war disruptions to gold markets is a great show of strength. Maybe gold’s next upleg won’t start quite yet, as June is the peak of its lethargic summer doldrums. But once gold’s seasonal autumn rally starts powering higher likely in July, the looming serious inflation from Trump’s war really ought to boost gold investment accelerating price upside.
The biggest beneficiaries of coming higher gold prices will be the fundamentally-superior smaller gold miners. We’ve specialized in trading that mid-tier and junior realm for decades, with great success. They just finished reporting the best quarter in the history of gold mining, earning so much their valuations are running near really-undervalued decade-plus lows! So get deployed before gold really starts running again.
Successful trading demands always staying informed on markets, to understand opportunities as they arise. We can help! For decades we’ve published popular weekly and monthly newsletters focused on contrarian speculation and investment. They draw on my vast experience, knowledge, wisdom, and ongoing research to explain what’s going on in the markets, why, and how to trade them with specific stocks.
Our holistic integrated contrarian approach has proven very successful, and you can reap the benefits for only $12 an issue. We extensively research gold and silver miners to find cheap fundamentally-superior mid-tiers and juniors with outsized upside potential. Sign up for free e-mail notifications when we publish new content. Even better, subscribe today to our acclaimed newsletters and start growing smarter and richer!
The bottom line is gold’s war trade has been backwards. The longer Trump’s war with Iran largely keeps the globally-critical Strait of Hormuz closed, the more bullish gold’s outlook becomes. So recent months’ anomaly of gold falling when the war intensifies won’t last. That contrary psychology was largely fueled by Turkey’s central bank dumping big gold in mid-March to defend its currency, hammering gold sharply lower.
Yet overall global central-bank demand remained strong in Q1, at recent years’ quarterly average. And well-higher energy and food prices are coming as the world’s oil stockpiles offsetting the Strait’s long closure dwindle. That will weigh on global stock markets while lifting bond yields, leaving gold way more attractive for prudent portfolio diversification. And American stock investors still have virtually no gold allocation.
Adam Hamilton, CPA
May 29, 2026
Copyright 2000 - 2026 Zeal LLC (www.ZealLLC.com)
About the author