Gold just experienced a stunning plot twist really shifting its outlook. A couple months ago, gold soared into crazy-overbought extremes. That sharp rally sure looked gold-futures-driven, but the government shutdown forced crucial futures-positioning data to go dark for seven weeks. Now being released on a catch-up schedule, it reveals far-different-than-assumed gold-futures trading proving much more bullish for gold.
Gold blasted 27.2% higher in just over seven weeks into mid-October, achieving 24 new all-time-record closes in that short span! That capped a far-larger monster 139.1% cyclical bull born in early October 2023. Gold soared so far so fast that it stretched an incredible 33.0% above its baseline 200-day moving average! That was the most overbought gold had been in fully 19.5 years, a crazy-high secular extreme.
That certainly appeared to be a major topping, as I analyzed at the time. It was gold’s biggest cyclical bull ever stretching all the way back to January 1971, the year Nixon severed the dollar from the gold standard! After the next-ten-largest gold bulls in that vast half-century-plus span, gold fell hard averaging big-and-fast drawdowns of 20.8% over 2.1 months! So out of such extremes, odds favored another sharp selloff.
That initially unfolded right on schedule, with gold plunging 9.5% in just over a couple weeks. But in the month since that large-pullback low, gold has ground sideways-to-higher on balance defying precedent after extreme toppings. After those high consolidations are possible, but 10%+ correction-grade or 20%+ bear-level selloffs are far more probable. They are necessary to rebalance extreme technicals and sentiment.
Unfortunately gold’s topping was way murkier than it should’ve been due to the government shutdown. The single-most-important data by far for confirming major gold toppings or bottomings is speculators’ gold-futures trading. These guys punch way above their weights in bullying around gold prices due to the radical leverage inherent in that realm. Maxing at 20x to 25x, that grants them outsized influence on gold prices.
Each gold-futures contract controls 100 troy ounces of gold. At current $4,200 prices, those are worth $420k. Yet midweek speculators are only required to keep $20k cash margins in their accounts for each contract traded. That makes for maximum leverage to gold of 21.0x, an order of magnitude greater than the long-time legal limit in the stock markets of 2.0x! Specs’ influence on gold prices is proportional to that.
At 21x, each dollar traded in gold futures has 21x the price impact on gold as a dollar invested outright! So how these guys are collectively trading often dominates gold’s short-term price action. Specs’ gold-futures positioning is detailed in weekly Commitments of Traders reports published by the Commodity Futures Trading Commission. These are current to Tuesday closes, but released late Friday afternoons.
Because spec gold-futures trading is so central to gold’s near-term directionality, I’ve intensely studied it for a quarter-century now. Every weekly CoT is analyzed in our popular subscription newsletters, to help illuminate what gold is likely to do next. But incredibly unluckily, what specs were doing was hidden by that recent record 43-day government shutdown. The CFTC didn’t produce a single CoT report in that span!
The last one before that unfortunate event was only current to September 23rd. That day gold closed at $3,763, just 3/8ths up into its massive seven-plus-week breakout rally. So how speculators were trading gold futures after that was a mystery, at the worst-possible time with gold looking to be at such a critical technical juncture! The CFTC finally resumed releasing CoTs after that shutdown ended, starting with the oldest.
Those chronological catch-up reports are coming out Tuesdays and Fridays, except holiday weeks. The September 30th report originally due out on October 3rd was finally published on November 19th. That was followed by the October 7th CoT on November 21st, October 14th on November 25th, and October 21st just this Tuesday. Those first four missing-in-action CoTs are critical, encompassing gold’s blowout surge.
During that four-CoT-week span proper, gold soared 9.5% higher. It peaked on Monday October 20th at a dazzling record $4,350, one day before that last-reported CoT week ended. Then that Tuesday gold plummeted 5.3% which proved its 39th-largest daily loss since January 1971, or top-0.28% across 54.8 years! The day before that, gold had actually been up 15.6% through the great majority of those four CoT weeks.
Because of gold futures’ extreme leverage, big-and-fast intraday gold moves are often futures-driven. Investment capital flows generally don’t slosh swiftly enough to fuel such sharp moves. And boy gold saw some big up days in that terminal four-CoT-week span, including +1.7%, +1.9%, +1.5%, +2.5%, +1.6%, +2.5%, and +2.8%! So everyone well-versed in gold-futures trading assumed specs were doing big buying.
On September 23rd before those CoT reports went dark, speculators’ total gold-futures longs and shorts were running 390.5k and 92.1k contracts. Over the 52 weeks leading into that, longs had outnumbered shorts an average of 4.1x making them proportionally more important for driving short-term gold price action. Those spec longs were already very high relative to their own precedent well before gold peaked.
Since gold’s epic record cyclical bull was born in early October 2023, total spec longs have meandered in a trading range between 252.9k to 441.0k contracts. The latter was a 4.6-year high seen in late September 2024 during another episode of gold extreme overboughtness. Spec longs’ all-time-record high in CoT data stretching way back to January 1986 was 473.2k contracts in mid-February 2020, just before COVID hit.
Based on all that, the only prudent assumption to make in the exceedingly-rare absence of crucial CoTs was that specs were flooding into longs. Then I figured spec longs must have surged way up to 450k to 475k+, extreme levels portending an imminent big-and-sharp selloff. When gold rolls over, specs can’t afford to be wrong for long at extreme leverage. At 21x, a 4.8% gold retreat wipes out 100% of their capital risked!
So October 21st’s brutal 5.3% gold plummeting should’ve been a sledgehammer to the skulls of these guys, forcing big cascading long dumping. And coming from presumably 450k+ longs, there was plenty of selling firepower available to force gold into that big 21%ish-in-a-couple-months drawdown. But that hasn’t happened yet in the six-plus weeks since, and those catch-up CoT reports are finally revealing why.
This chart superimposes daily gold prices and key technicals over speculators’ weekly total longs and total shorts over these past several years or so. Stunningly, shockingly, unbelievably, when gold went terminal into mid-October specs were fleeing longs hard! If this catch-up CoT data is indeed righteous, it paints gold’s recent topping in a much-more-bullish light. Curse the government shutdown for obscuring this.
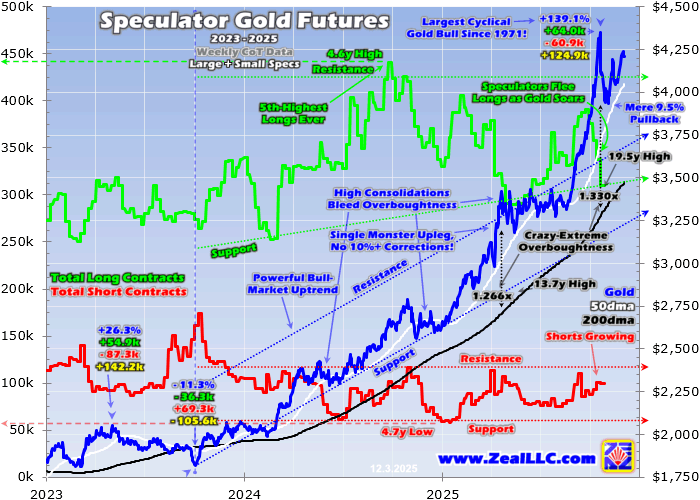
Had someone warped back in time six weeks ago and shown me this chart, I wouldn’t have believed it. During those first four CoT weeks into October 21st missing reports until just recently, gold soared 2.3%, 3.3%, 4.0%, and then slumped 0.5% due to that single colossal down day. Utterly astoundingly, total spec longs collapsed 14.2k, 19.0k, 19.7k, and 27.9k contracts during these same four gold-soaring CoT weeks!
For some context, any change in spec longs or shorts in any single CoT week is considered huge once it exceeds 20k. And any 15k+ swing is really big. So much to their credit, these hyper-leveraged speculators were fleeing gold upside bets in a massive way as gold threatened to shoot parabolic hitting dangerous extremely-overbought territory. They were proactively managing their serious risks as a reckoning loomed.
Had I known this crucial spec-gold-futures-positioning data normally as gold soared into mid-October, my gold prognosis would’ve been considerably-less drawdowny. Again the dominant driver of big-and-fast gold selloffs after major toppings is specs quickly unwinding excessive longs. But since they had already just spent four weeks dumping them, longs were miraculously nowhere near extremes as gold soared to that peaking!
On October 21st, the latest-available catch-up CoT date and that day gold plummeted 5.3%, total spec longs had already fallen way back to just 309.8k contracts! We should’ve known that on October 24th rather than December 2nd. And total spec shorts were running 99.7k contracts. Those are much better than late-August levels before gold broke out of its previous high consolidation, which I predicted at that time.
On CoT Tuesday August 26th, gold was trading at $3,389 after mostly drifting sideways for 4.2 months since its previous episode of extreme overboughtness in mid-April. That day total spec longs and shorts were running 332.5k and 81.5k contracts, which was quite bullish for gold. Indeed over the next eight CoT weeks, gold blasted 21.5% higher! Dumbfoundingly, October 21st’s spec positioning was even more bullish.
Then after gold had rocketed total spec longs were somehow 22.7k contracts lower while their total shorts were 18.1k higher! How could this happen brings up big questions, led by who the heck was deluging into gold fast enough into mid-October to overcome specs’ massive gold-futures selling? In those four missing-report CoT weeks into October 21st, specs dumped the equivalent of a huge 274.6 metric tons of gold!
For well over a decade, American stock investors’ capital flows into and out of gold ETFs have been the other dominant driver of gold price trends along with spec gold-futures trading. Those are evident in the combined bullion holdings of the world-leading GLD, IAU, and GLDM gold ETFs. Yet in that same four-CoT-week gold-terminal span, those merely climbed 4.9% or 81.0t! Huge gold buying came from elsewhere.
Looking into that is another-whole-essay topic, so we’ll stick to spec gold-futures trading today. Their extraordinary gold-bullish positioning the day after gold peaked tilts the near-term odds away from a big-and-fast drawdown to a milder high consolidation. Sideways drifts also rebalance extreme technicals and sentiment, but take much longer than selloffs to accomplish that essential mission. This gold bull exemplifies that.
Almost as unbelievably as specs’ gold-futures trading into mid-October, gold’s epic record 139.1% bull hasn’t suffered a single 10%+ correction! The worst selloff was that 9.5% into early November 2025, and before that another large 8.0% pullback into mid-November 2024. Rather than correcting like usual, this mighty gold bull has amazingly enjoyed three previous high consolidations which are highlighted in this chart.
All three earlier sideways drifts mostly in Q2’24, Q4’24, and Q2’25 happened after gold had soared into extreme overboughtness. That has grown progressively worse as gold powers ever-higher, starting at 18.8% above its 200dma in mid-April 2024, 18.3% over in late October 2024, then 26.6% above in mid-April 2025. Again mid-October’s latest extreme of 33.0% over continues this increasingly-overbought trend.
Yet if global gold demand remains sufficiently-large, and speculators aren’t all-in forcing them to quickly liquidate excessive upside bets, another high consolidation is certainly possible. Gold’s post-peaking trading range has run between that large-pullback low of $3,935 in early November to mid-October’s cresting at $4,350. And as gold’s last high consolidation showed, marginal new highs are possible within them.
In mid-April gold peaked at $3,421, then started drifting on balance out of that extreme overboughtness. It edged up to $3,422 in early May, then suffered its biggest pullback of that high consolidation down 7.1% in just over a week. Gold later recovered back to $3,431 in mid-June, 0.3% above mid-April’s original peak. Gold didn’t decisively break out from that then-4.2-month-old drift until August’s final trading day.
Maybe gold is now in this record bull’s fourth high consolidation, so far running between that $3,935 to $4,350. This range could expand slightly, but any gold close below $3,915 makes for a 10% correction formally slaying this epic record bull. If gold is in a high consolidation, redeploying in great fundamentally-superior gold stocks requires a different strategy than if gold had suffered a normal big-and-fast drawdown.
Such major selloffs tend to bottom fairly rapidly in relatively-oversold conditions, often creating a shorter optimal buying window. That requires concentrating the adding of new trades surrounding that probable bottoming. But high consolidations take much more time, as milder selling is much slower in restoring normal technicals and bleeding off topping greed. So gold-stock redeployments in them are more measured.
Gold gradually meanders sideways in high consolidations, so the best times to add gold-stock positions is when their metal is in the lower quartile of its recent trading range. In this current high consolidation if it ultimately proves to be one, gold’s 25%, 50%, and 75% up-in levels are $4,039, $4,143, and $4,246. So under the former is where we’ll be looking to start rebuilding our newsletter portfolios as market conditions allow.
I’m sure looking forward to that, as the getting has been very good in great fundamentally-superior mid-tier and junior gold miners. Our entire newsletter trading books were stopped out in mid-October as gold stocks plummeted with their metal, which was good with a probable serious drawdown looming. But with smaller gold miners earning astounding all-time-record profits, gold stocks are still undervalued relative to gold.
While a big-and-fast selloff would’ve spawned better reentry prices sooner, a high consolidation will do. As speculators and investors, we can’t be choosy and have to take whatever the markets deign to provide. In 2025 alone, we’ve realized 60 stock trades between our weekly and monthly subscription newsletters. Their average annualized realized gains including all losers is a spectacular +119.9%! Gold stocks are killing it.
As a financial-newsletter guy and professional gold-stock speculator, that government shutdown forcing no CoT reporting was exceedingly-frustrating. Plenty of times during that seven-CoT-week span with no crucial spec-gold-futures-positioning data, I wrote that its absence meant we were mostly flying blind. It’s hard to imagine a worse-possible time to have no idea what gold-futures traders were collectively doing!
Yet as famous English economist John Maynard Keynes once reportedly said in a debate, “When the facts change, I change my mind. What do you do, sir?” We didn’t have any spec gold-futures data as gold was soaring and cresting, and acted accordingly looking for history’s highest-probability outcome. But now catch-up CoTs are painting a quite-different picture for gold ahead, much more bullish than assumed.
Successful trading demands always staying informed on markets, to understand opportunities as they arise. We can help! For decades we’ve published popular weekly and monthly newsletters focused on contrarian speculation and investment. They draw on my vast experience, knowledge, wisdom, and ongoing research to explain what’s going on in the markets, why, and how to trade them with specific stocks.
Our holistic integrated contrarian approach has proven very successful, and you can reap the benefits for only $10 an issue. We extensively research gold and silver miners to find cheap fundamentally-superior mid-tiers and juniors with outsized upside potential. Sign up for free e-mail notifications when we publish new content. Even better, subscribe today to our acclaimed newsletters and start growing smarter and richer!
The bottom line is gold just saw a big futures plot twist. As gold soared into extreme overboughtness into mid-October, there was no speculator-gold-futures-positioning data due to the government shutdown. But given how fast gold was surging, specs looked to be frenzied buyers. That implied their bullish bets were growing excessive, necessitating a big-and-fast gold drawdown right in line with post-big-bull historical precedent.
Now with those delayed CoT reports slowly trickling out, gold’s narrative is being rewritten. Speculators grew so worried about gold’s mounting overboughtness that they aggressively dumped longs for an entire month leading into that topping! That left their positioning then much more bullish than pre-gold-breakout levels in late August. This stunning revelation really ups the odds for another gold high consolidation instead.
Adam Hamilton, CPA
December 5, 2025
Copyright 2000 - 2025 Zeal LLC (www.ZealLLC.com)
About the author