"Gold's Lower Grind and the Fed's REAL Bind"
"Pardonnez notre français, mais le Fed est phoqué."

Yes, Gold's price continues its lower grind, (the current Short trend in mind), but 'tis the Fed that's in a REAL bind. StateSide annualized REAL Gross Domestic Product (GDP less Chain Deflator) just shrunk for the third successive quarter (-3.7% in Q3 2021, -0.2% in Q4 2021, and now a whopping -9.4% in Q1 2022). With prices on the rise, that's a stagflationary recession well underway. Period!
Worse still, toward memorializing this now nine-month stint of higher prices and REAL economic shrinkage, come Wednesday the Federal Open Market Committee shall (we think unanimously as they've all been blabbing about it) increase their Bank's Funds Rate by 50 basis points: right in the face of it all going wrong. Live by the credibility and die by it. This is the Fed's worst bind in its 108-year history.
"Well, mmb, they were pretty entrapped back in the late 70s..."
A devil's advocate point there, Squire, within which came the Volcker-administered Saturday Night Massacre. But the money supply in those days was just 7% of what 'tis today, and the Debt/GDP ratio just 35%, whereas today 'tis 137%.
But to the point: As reported this past Monday by Dow Jones Newswires, "The Fed Wants to Raise Rates Quickly, but May Not Know Where to Stop", Chair Powell inferring a target of "neutral". In thus looking to the Fed's favoured inflation gauge -- the Core Personal Consumption Expenditures Index -- March's just-reported +0.3% figure annualized is +3.6%. Were that the Fed's "neutral" target, then following this Wednesday's 50-basis point FedFunds rate increase (to the 0.75%-1.00% range), six subsequent 50-basis point increases targets the 3.75%-4.00% range come the FOMC's 01 February 2023 Policy Statement, (just in case you're planning ahead). 'Course, this assumes that you neither drive nor eat.
Moreover, should REAL economic shrinkage continue such that consumers (the 70% driver of the U.S. economy) materially reign in their spending -- lacking the dough with which to go -- in turn making the Fed nervous over missed debt service, then 'tis QE Seven [sic] all over again. Remember when Bazooka Joe cost 1¢? (We do...) Today 'tis 25¢. Tomorrow $25? (See
Still, such shock can be somewhat mitigated. From COVID-to-date, the
As for the "It Always Comes Back" crowd, historically yes, the stock market always has come all the way back. But can you last that long? To briefly review yet again: the S&P's high on 24 March 2000 was 1553: that level was not breached until 1555 traded over seven years later on 17 July 2007. Then barely higher in hitting 1576 on 11 October 2007, 'twas better than five years until 1589 traded on 10 April 2013. Or put another way (for you WestPalmBeachers down there), it took the S&P 500 more than 13 years to rise just 36 points (+2.3%) from 1553 to 1589. To be sure, we're all taught in Finance 101 that "stocks are a hedge against inflation". So, if we're still around, we may compare notes in 2035. (And don't forget the Gold).
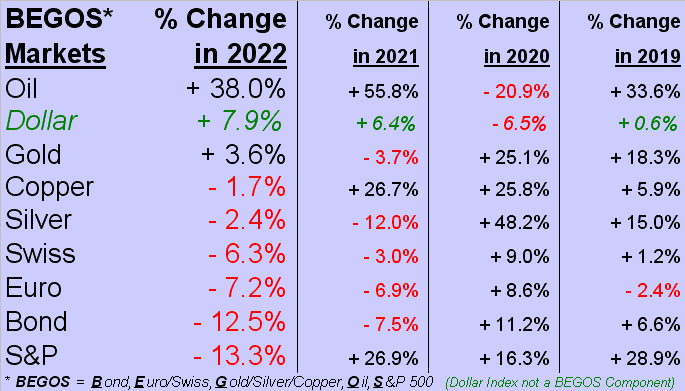
It being month-end, here we've got the BEGOS Markets Standings through April. With a third of 2022 in the books, Oil obviously remains far out ahead, followed on the podium by the Dollar (itself not a BEGOS component, but a mainstay of this table), and Gold. All the others are underwater year-to-date, the S&P 500 being at the bottom of the barrel. As put forth a week ago, we see the S&P's high for this year (4819 on 04 January) as being in place, with underlying structural support in the 3587-3198 band. Here's the whole bunch:
In fact, speaking of stocks, the "Looney Headline of the Week Award" goes to MarketWatch for their Thursday news-breaker "Dow jumps nearly 600 points as tech stocks rally after Facebook parent's [
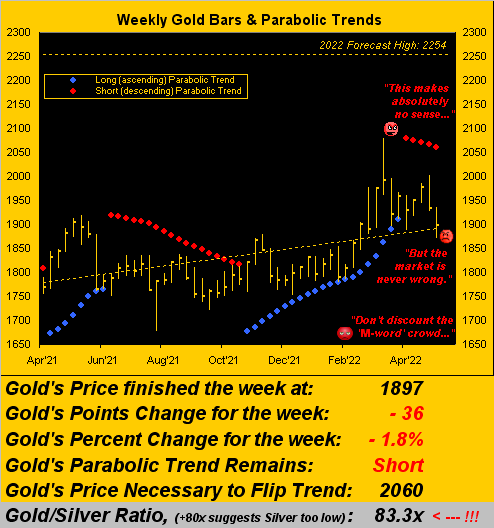
Equally ungraceful remains Gold's lower grind, the weekly parabolic Short trend now five weeks in duration, with price itself this past week recording an 10-week low at 1871 en route to settling yesterday (Friday) at 1897, (the first sub-1900 weekly close since that ending 25 February). But the bigger story is poor ole Sister Silver in succumbing to her lowest weekly settle (22.785) since that ending 31 January. Further exacerbated is the Gold/Silver ratio, which at the foot of this next graphic reads as 83.3x, the highest level since the COVID gloom of 21 July 2020. Nonetheless (or perhaps nonethemore) for Gold, the Short trend's rightmost red dots continue their cascade in this year-over-year view:
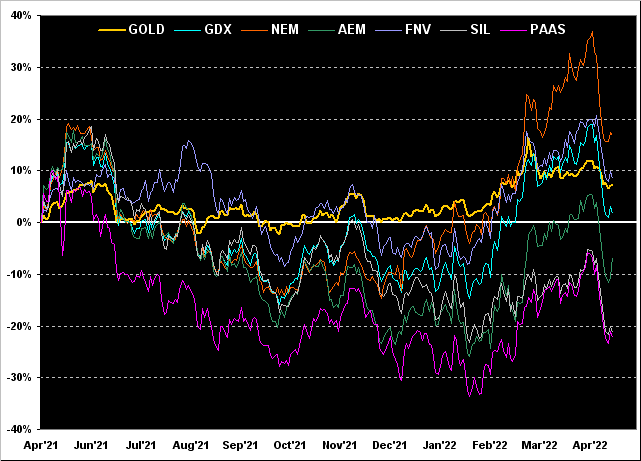
Year-over-year too we've these precious metal high-level equities by their percentage tracks, featuring Newmont (NEM) +17%, Franco-Nevada (FNV) +9%, Gold itself +7%, the VanEck Vectors Gold Miners exchange-traded fund (GDX) +2%, Agnico Eagle Mines (AEM) -7%, the Global X Silver Miners exchange-traded fund (SIL) -21%, and Pan American Silver (PAAS) -22%. A vastly mixed-bag of performance there:
Mixed as well is the careening Economic Barometer's bounding about in search of direction. We rightly account for inflation data as an economic positive, that notion being the "rising tide lifts all boats." But problematic thereto today is that lots of the boats are leaky. Indeed in a note to our Investors Roundtable this past week as regards the negative GDP and rising Chain Deflator (i.e. stagflation), we penned 'tis "Analogous to pedaling your bicycle up an oil-slick hill whilst slipping backward throughout." Don't forget the meclizine:
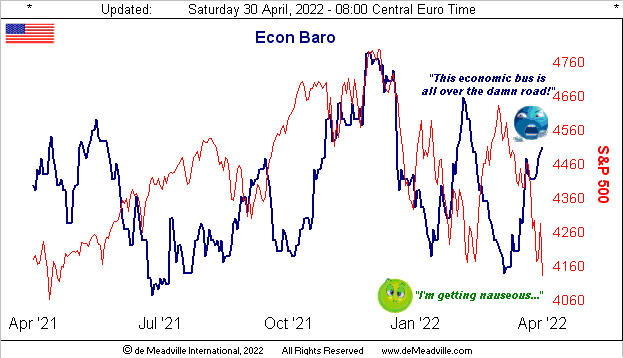
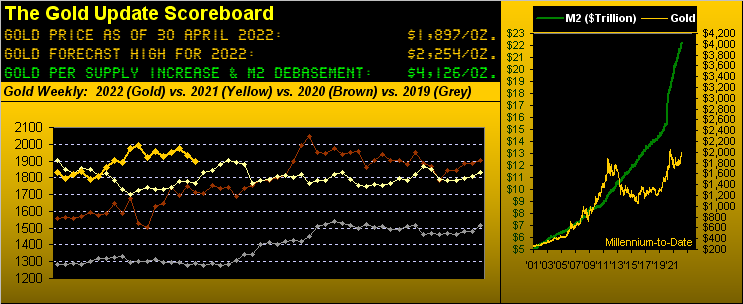
Notable amongst the past week's cavalcade of incoming Econ Baro metrics was Personal Spending having increased in March, whilst Personal Income declined. Too, March's Durable Orders improved, but the Chicago Purchasing Managers Index for April declined. Growth slowed in March's New Home Sales as Pending Home Sales declined. And then of course is our opening whopper: shrinking GDP made all the worse by a rampant Chain Deflator. And Gold is priced at but 1897? (Note the Scoreboard's valuation of 4126: tick... tick... tick...)
Meanwhile on this side of the pond, The Macaroon won another five-year stint overseeing La Belle France, the FinTimes in turn reporting the €uro as "steady" even as it straightaway declined -0.9% against the Dollar from election night into the next day; and by week's end, the €uro's loss amounted to -2.4%. Then as for the ¥en, it hasn't been this cheap since the DotComBomb, the Bank of Japan keeping rates low, 180° out-of-phase with the Fed's show. (Speaking of which, a congratulatory tip of the cap to Lael "The Brain" Brainard's Senate confirmation as FedViceChair, albeit not the most enviable position in which to now be).
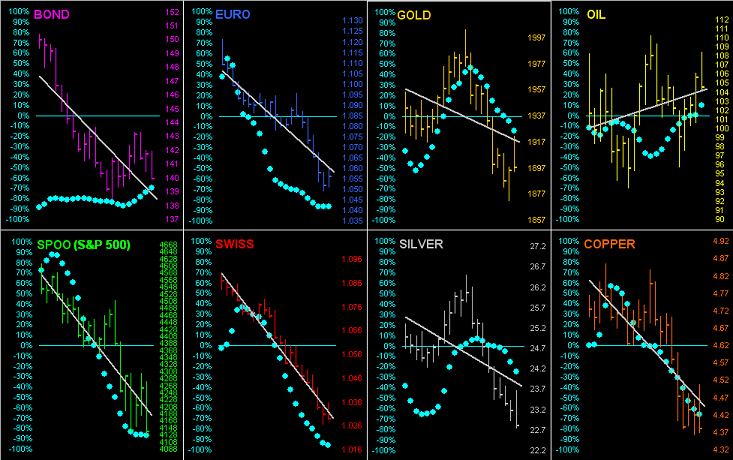
Unenviable as well are the negative 21-day linear regression trends for seven of the eight BEGOS Markets. Save for Oil, when the truck's backed up to load the Buck, the other markets run out of luck:
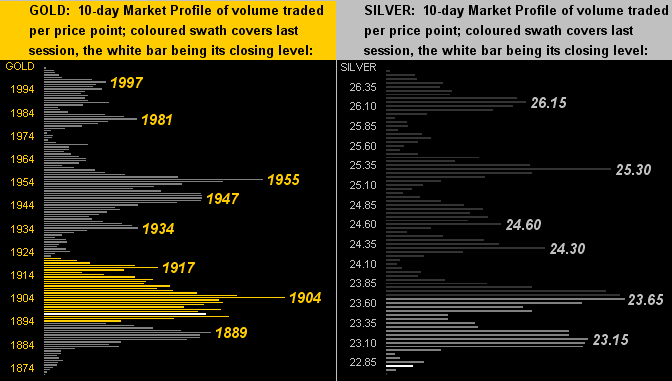
Now let's zoom in on the lowly levels of the precious metals per their 10-day Market Profiles as we see below left for Gold and below right for Silver. The positive view of this is there being significant porousness throughout the overhead apices such that a material buy can return price to high:
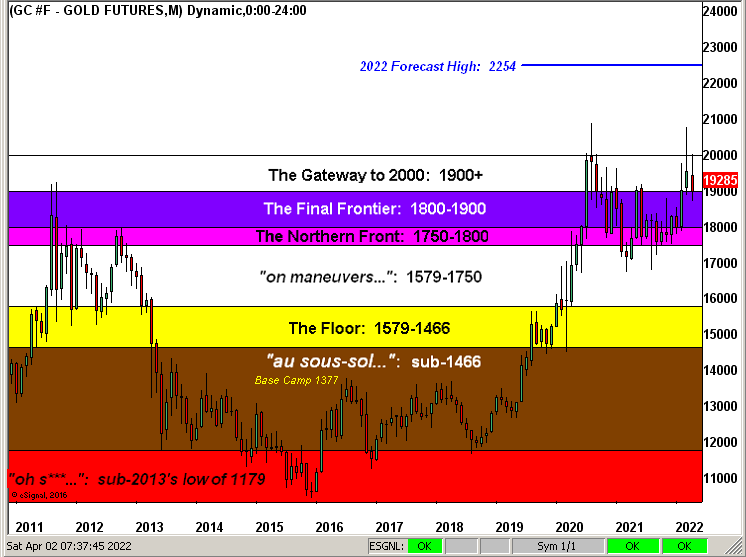
Again as 'tis month-end, we shan't check out without presenting The Gold Structure from 2011-to-date by monthly candles. Forever in "The Final Frontier" dwells our Gold these many recent months, even as the world diabolically comes unglued both monetarily and geo-politically. But to reprise the fighting phrase from the late, great, Jim Valvano, "Don't give up, don't ever give up!" For emotion is the trader's killer whereas patience is the trader's ally:
To close -- and within our caveat of not making equity recommendations -- yours truly was a privileged invitee to a presentation by the Chairman of African Lion Gold as regards their due diligence and progress with respect the Chifunde mining project in
Indeed for the present: with the Fed in a REAL bind and Gold trading at but 46% of our valuation, you do have some, right?

Cheers!
...m...

