“2022: The Golden Year” activates…
…as gold and the miners hit our short-term upside targets this week.
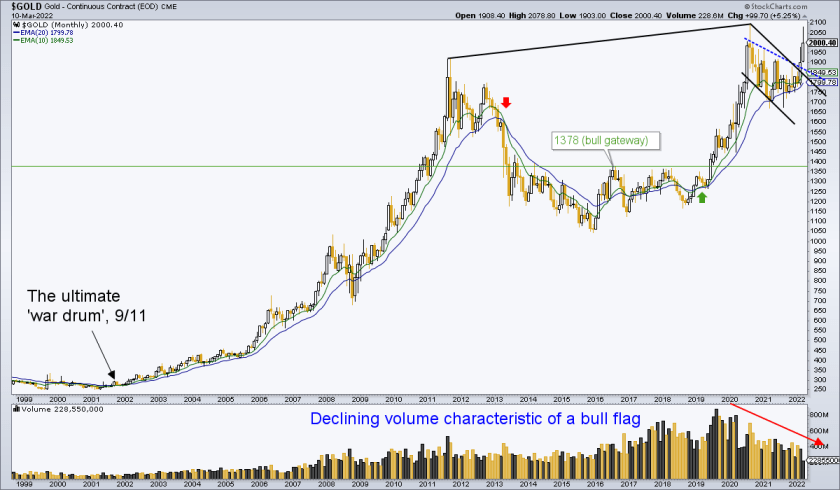
In August of 2020 we noted the danger signals for gold based on sentiment excess coming out of the acute pandemic fear phase. We also noted the need for a multi-year bullish Cup to build a proper handle after that excess. A Cup’s handle is actually a downward trending bull flag.
In December of 2021we noted that 2022 would be the “Golden Year”.
And so it is. It took 1.5 years of handle-making (see chart below) and that phase, which cast doubt on the monetary metal among the public and even some of gold’s staunchest supporters, was so healthy that words cannot describe. The angst was fueled by gold’s failure to act as an inflation hedge while cyclical commodities flew during the inflation trades of 2020-2021. And thus, an excellent handle to a bullish Cup is in the books.
As I have repeated to many deaf ears over the years, gold and especially gold stocks are not about inflation. Gold can hedge inflation well under certain economically corrosive circumstances, but when inflation is working toward a positive economic cycle, gold rightly under-performs (at best).
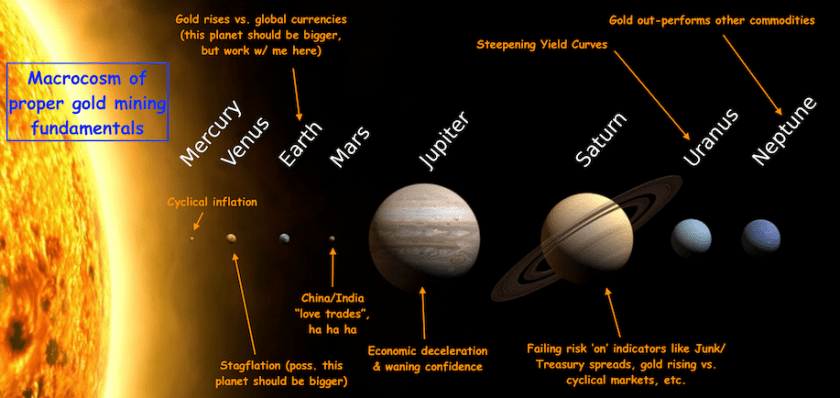
I’ve used this graphic over the years to the viewership of many a blind eye. As perma-bull gold stock boosters rail against manipulation of gold stocks, which they insist should rise while inflation rages, we speculate in other areas that are right with the macro at such times. Gold stocks have not been right with the macro since mid-2020.
Back to the miners’ product, the handle breakout came amid Putin’s war on Ukraine and while I am always skeptical of moves in gold that are launched by war, terror or pestilence, this monthly chart makes a note that gold’s major secular bull market (still intact, by the way) launched when 9/11 coincided with an economic recession and inflating central banks.
Insofar as the current inflated economy remains stable gold will be vulnerable to ‘war relief’ in whatever form that may take. But the current leg (that began in 2019 as we noted in real time the takeout of the 1378 cyclical bear-ending gateway) of the bull market is still intact and its trigger, the breakout from the handle, is subject to a test.
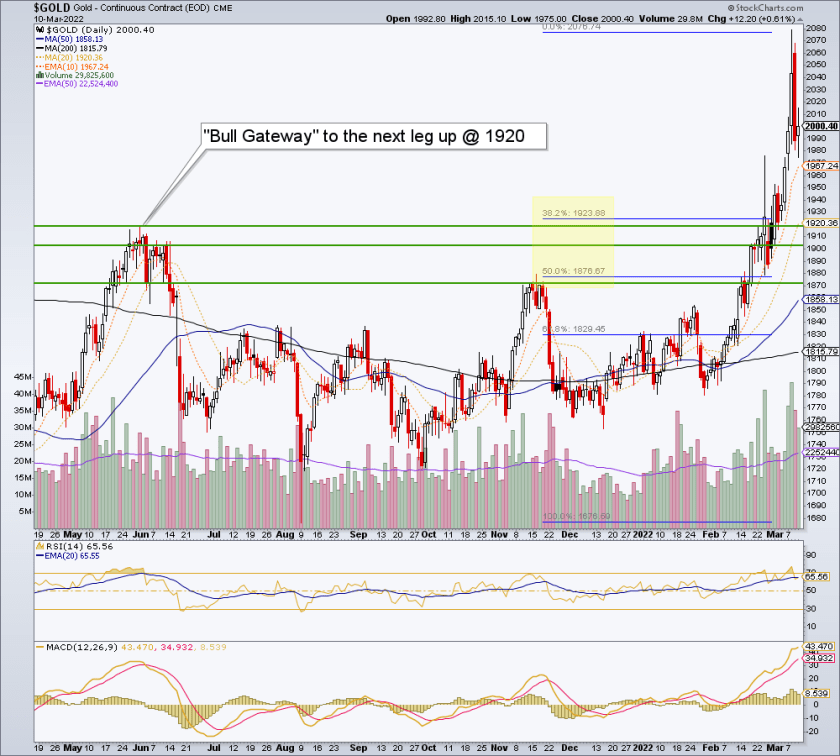
Very simply, the 1920 area, which has been the next ‘bull gateway’ objective for calling the next leg up, will likely be tested in order to punish the war jumping knee-jerks. While downside support/buy opportunity management for the miners is reserved for NFTRH subscribers, the daily chart of gold below shows some pretty clear projections for a pullback to test the new bull market leg.
A 38% Fibonacci retrace from the August 2021 low to the March 2022 high matches nicely with the gateway area at 1900-1920. Just as nicely, a 50% Fib retrace syncs up with another clear support level at the November 2021 high. Don’t think a drop to 1830 is possible? Think again. While maybe not probable, it is very possible.
Such pullbacks are opportunities to buy gold for the next bull market leg now that it has taken out the gateway. As a side note, I would not get overly concerned about 50% or 62% retraces even though they’d put gold back below the key 1920 level. The move has been made, is subject to correction/testing and 2022 AKA “the Golden Year” is in progress.
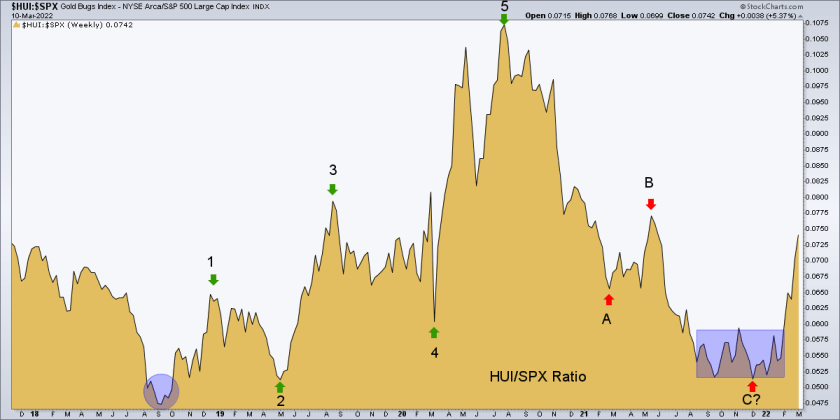
As for the miners, they have made a definitive move out of a low vs. the broad stock market after testing the 2019 low. This relational move probably needs correcting as well.
While specific buy areas for HUI/GDX/GDXJ and individual gold miners/royalty/juniors are going to be managed in NFTRH but not in public, the monthly chart of HUI shows a bull flag breakout of its own after the long consolidation that came about in tandem with gold after our upside target of 375 was in essence hit amid much fanfare (and perma-pumping). The chart also shows positive RSI and MACD.
The monthly (March) stick shows a clear breakout that has beckoned the momo crowd to get aboard. When they get corrected it is likely we’ll be strapping in for the upside target of 500. This is when markets get fun, not only with the flashy upside, but also when volatility provides opportunity on the downside.
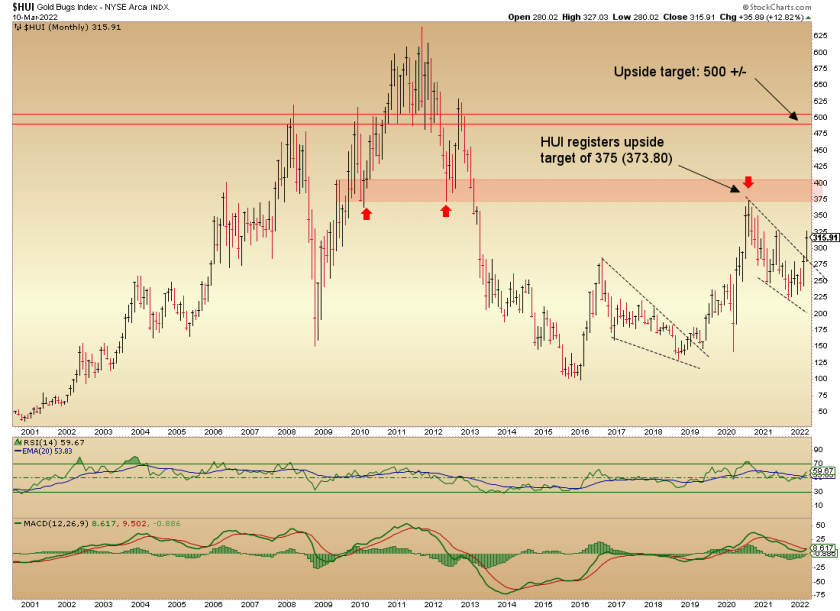
Regardless of the near-term correction likelihood, 2022 looks to be shaping up as the “Golden Year” we projected in December as linked above. It’s been a long 1.5 years in coming, but the pent up energy that those handles built up should ultimately reward patient gold stock speculators as well as gold investors.*
* Those terms are delineated “speculator” and “investor” for a reason, as there is a major difference between them.
For “best of breed” top down analysis of all major markets, subscribe to NFTRH Premium, which includes an in-depth weekly market report, detailed market updates and NFTRH+ dynamic updates and chart/trade setup ideas. Subscribe by PayPal or credit card using a button on the right sidebar (if using a mobile device you may need to scroll down) or see other options. Keep up to date with actionable public content at NFTRH.com by using the email form on the right sidebar. Follow via Twitter @NFTRHgt.

