Gold’s performance during Trump’s Iran war has been quite ugly, worrying traders. Usually geopolitical shocks boost gold, and effectively shutting down the world’s most-important oil-and-LNG artery could be the biggest of our lifetimes. Yet gold’s war disconnect has really mounted, selling off hard despite soaring risks of serious global economic consequences including resurgent inflation. So what gives in this anomaly?
On the eve of Trump going to war with Iran on February’s final trading day, gold rallied 1.2% to $5,257. That was only 2.5% under late January’s record peak, and spirits were high in precious-metals land. That was evident in the leading GDX gold-stock ETF rallying 1.7% to a record close of $115.84. Gold stocks act like a gold sentiment gauge. Gold-ETF holdings were also climbing as American stock investors chased.
That day the combined holdings of the globally-dominant US GLD, IAU, and GLDM gold ETFs edged up 0.2% to 1,802.7 metric tons which was a 5.3-year secular high. While potential US military action against Iran had been speculated about for some time, negotiators from both countries met in Geneva that day discussing Iran’s nuclear program. So an imminent war didn’t seem like a high probability as February ended.
Yet the next morning, the US and Israel unleashed massive surprise airstrikes against Iran in campaigns called Operation Epic Fury and Operation Roaring Lion. The initial attack assassinated Iran’s supreme leader and dozens of top government officials, and thousands of Iranian targets got struck that weekend! This frenzied new war closed the Strait of Hormuz, the most important strategic chokepoint in the world.
About 1/5th of both the entire planet’s crude-oil and liquefied-natural-gas supplies steam through that narrow waterway every day! And another 1/3rd of the world’s seaborne fertilizer trade also transits that strait. So every day tankers, carriers, and freighters can’t pass due to threats of Iranian drone, missile, mine, and autonomous-boat attacks, the global economy tilts closer to a serious recession and resurgent inflation.
And Iran’s threat to these critical shipping lanes just off its coast is all but impossible to counter. Iran is huge, ranking as the 17th-largest country in both area and population terms. It is also among the most-mountainous countries on Earth. Its rugged 125-mile coastline hugging the Strait has endless places to hide weapons. Iran can’t fight the US militarily, but it can fight economically by keeping the Strait mostly closed.
That ratchets up political pressure on Trump to wind down his war sooner rather than later, especially with US midterm elections looming. All Iran needs to do is periodically attack commercial ships to keep that threat real. Then insurers won’t underwrite those expensive vessels and crews won’t want to risk their lives transiting the Strait, so oil, LNG, and fertilizer won’t move. This disaster ought to be fantastic for gold.
When I saw that war news early Saturday February 28th, I figured gold would blast 5%+ higher when trading reopened in Asia late that Sunday New York time. Initially gold did surge to $5,420, 3.1% over its war-eve Friday close and 0.5% above late January’s peak. Back in February 2022 after Russia invaded Ukraine, gold blasted up 7.5% over the next nine trading days. And this Iran geopolitical shock was far worse.
Yet by the US close on Monday March 2nd, gold had retreated back to a mere 1.5% gain to $5,337. The war news was bad, with Iran responding to the endless American and Israeli airstrikes on it by attacking key oil-and-gas infrastructure in neighboring Persian Gulf countries as well as commercial vessels near the Strait of Hormuz. Despite that spiraling mess, the next day instead of rallying gold plummeted a brutal 4.5%!
That was its worst down day since late January’s 10.3% single-day crash right out of gold’s peak. And the bad news for the world economy kept on coming. Iran attacked the world’s largest LNG complex in Qatar, Saudi Arabia’s largest oil refinery, and Oman’s largest oil port just outside the Strait. Yet gold kept on falling on balance, with additional 1.3%, 1.8%, and 1.3% down days into mid-March. Then it got much worse!
Despite moving contrary to this crazy geopolitical shock, gold was still holding above the psychologically-important $5,000 level. But last Wednesday the 18th that failed spectacularly. The initial catalyst was an Israeli airstrike on the world’s largest natural-gas field by far, offshore in the Persian Gulf shared by Iran and Qatar. Later red-hot US wholesale-inflation data then a hawkish Fed exacerbated that gold selling.
Gold plunged 3.6% that day, shattering $5k support. That unleashed frenzied momentum selling over the subsequent three trading days into this Monday, where gold plunged another 3.6%, 3.0%, and 2.3%! By this Tuesday, gold had collapsed 16.3% month-to-date to just $4,402! Considering soaring global energy and food prices for months or years to come due to the Strait’s closure, gold’s March performance was dismal.
That counter-geopolitical-shock plunge has unleashed torrents of bearishness, with gold’s secular bull and even safe-haven status increasingly questioned. But gold’s war disconnect isn’t some paradigm shift, just the consequence of festering extreme overboughtness. Gold’s falling March action is actually so bullish we started redeploying in great mid-tier and junior gold miners this month as their stock prices plunged!
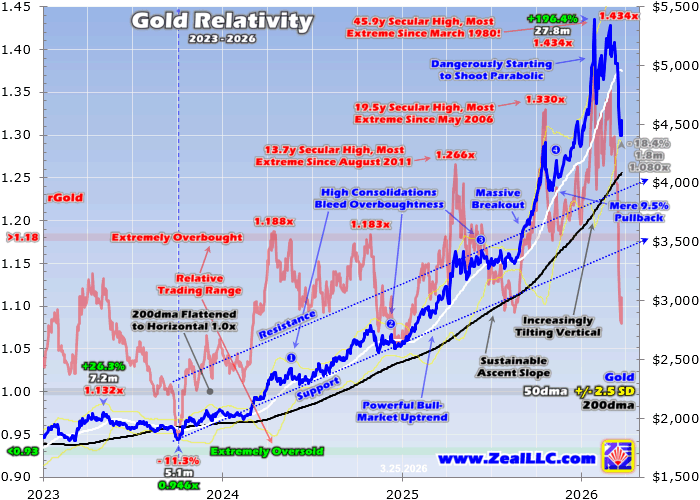
This chart puts everything in context. It superimposes gold and its key technicals over a construct called Relative Gold that measures overboughtness. It simply divides gold’s closes by their 200-day moving average, with the resulting rGold multiples showing where gold is trading relative to that key baseline. Gold exited February still overdue for a serious big-and-fast selloff, which the Iran war likely moderated some.
Gold’s late-January record peak was truly extraordinary. Getting there gold enjoyed its biggest cyclical bull ever in US-dollar terms, a 196.4% monster over 27.8 months without a single 10%+ correction! That tripling in a couple years stretched gold an astounding 43.4% above its 200dma, the most overbought it had been in 45.9 years since March 1980! I wrote extensively about those dangerous extremes at the time.
That included looking at gold’s biggest cyclical bulls and most-overbought cyclical-bull toppings in its entire US-dollar history since 1971. After the next-ten-largest cyclical bulls, gold averaged subsequent big-and-fast drawdowns of 20.8% over just 2.1 months! January 2026’s peak ranked as gold’s fifth-most-overbought cyclical-bull topping. The subsequent drawdowns after the other-ten-highest ones were similar.
Those weighed in averaging 20.7% selloffs over 2.1 months. So in late January’s popular speculative mania in gold, the odds favored a 21%ish gold plunge over the next couple months or so. Indeed that got underway with a vengeance. The day after gold crested, it crashed 10.3% for its third-worst down day in US-dollar history! On the following trading day, gold plunged another 3.4% making for a blistering 13.3% collapse.
Certainly a bounce was due out of such a violent hammering, and gold blasted 6.0% higher on the third trading day. But interestingly as February marched on, gold stabilized and resumed rallying on balance. The steady background drumbeat of potential US military action in Iran may have contributed. All this is readily evident in this chart, which pretty much explains gold’s war disconnect suffered throughout March.
Whether it was geopolitical fears or lingering herd greed, gold’s necessary and healthy rebalancing out of late January’s epic technical and sentimental extremes was short-circuited in February. Instead of selling resuming, impressive buying returned. Gold inexplicably blasted 8.7% higher in February, not far behind January’s colossal 12.1% gains! But no rebalancing left gold extremely overbought, a serious problem.
On average in February, gold closed an astounding 30.2% above its 200dma baseline! While nowhere near as crazy as late January’s 43.4%-over peak, 30%+ is still unbelievably extreme. As of late January, since 1971 gold had only closed 30%+ above its 200dma on 2.4% of all trading days. Yet over 14/15ths of those came before April 1980 in gold’s 1970s super-bull, so a more-modern comparison is way more telling.
Since 2000 which is far more relevant now, only 0.3% of all trading days into January 2026’s peak saw gold close 30%+ above its 200dma! That’s 1/312th of them, well less than one a year! Seeing an entire month averaging such extremes after gold’s most-extreme peak in a half-century was incredible festering overboughtness. Gold left February needing a big-and-fast-selloff reckoning almost as much as in late January!
Had Trump not gone to war with Iran, gold’s March selloff could have been considerably worse. Gold likely did respond to this probably-worst geopolitical shock of our lifetimes. The great pall the Strait of Hormuz’s closure casts on world markets and the global economy almost certainly ameliorated gold’s overdue selling. While gold’s drawdown might not be over, it shouldn’t grow as big as it otherwise could have.
Again on average after past extreme cyclical-bull toppings, gold suffered about 21% selloffs over a couple months or so. Thanks to last week’s brutal $5k-support-failure momentum-fueled selling, gold’s overall drawdown from late January’s record peak grew to 18.4% over 1.8 months. That is starting to challenge past extreme toppings’ drawdown averages, which leaves gold in a much better place than a month earlier.
Before this Iran-war mess which is already looking like another intractable Middle East quagmire, gold was likely due for a bigger-than-average drawdown after tripling in a couple years into 46-year extremes of overboughtness. After the only comparable peak in January 1980 for example, gold plummeted 43.4% in only 1.9 months! Gold didn’t need anything that radical this time, since it got nowhere near as overbought.
But 25% to even 30% wouldn’t have been a big surprise, and indeed is still possible. But given the epic uncertainty and tremendous risks Trump has unleashed in global crude-oil, LNG, and fertilizer supplies, gold looks far more important as a portfolio hedge than it would’ve been without this war. So maybe 18% to 21% will prove enough in this wildly-unprecedented environment. Gold could be carving a major bottoming.
Just this Tuesday, gold plunged way back down to only 8.0% above its 200dma. While nowhere near the oversold levels seen at deep secular lows, that still proved the least overbought gold has been since way back in mid-January 2025 fully 14.2 months earlier! And if gold’s drawdown extends to that past-average 21%, that would be around $4,261 which isn’t too much lower. And geopolitical and economic risks are mounting.
The longer the world starves without 1/5th of its crude oil, 1/5th of its LNG, and 1/3rd of its fertilizer, the worse global economic impacts grow. Saudi Arabia can reroute some of its oil to a major Red Sea port, but at best that would only cover 1/4th of normal Strait of Hormuz flows. Qatar’s national energy company has warned it will take several-plus years to repair its damaged largest-in-the-world LNG-exporting complex.
This has little to do with the US’s unparalleled military superiority. Iran is very resourceful and has long excelled in asymmetric warfare. Iran disguises autonomous explosive drone boats as fishing boats, which are all over the Strait. The Shahed aerial drones Iran developed are so effective Russia has used them extensively against Ukraine and the US reverse-engineered and copied their design! Iran has endless Shaheds.
The main ones are estimated to cost under $50k to manufacture, and can fly payloads of 110 pounds of high explosives about 1,600 miles. Their total weight is only 440 pounds, and their 8-foot wingspan means they can fit in the back of a pickup under a tarp. Their launch frames fit on the back of any small commercial truck. These drones use inertial guidance augmented by Russia’s equivalent of GPS satellites.
No matter how many bombs and missiles the US and Israel rain on Iran, it will easily remain able to fire Shaheds at tankers, carriers, and freighters in the Strait. A handful could disable or even sink the largest ULCC oil tankers, which cost about $200m each and can transport 2m barrels of oil. More complex, the largest LNG carriers cost over $300m. Iran only has to fire on ships every week or two to keep the Strait closed.
Iran could never beat the US militarily, so its government’s only strategy for survival is making the costs of this war so great that Trump is pressured to back down. Soaring energy and food prices worldwide driven by the Strait’s closure is Iran’s greatest weapon. Coming resurgent inflation, recessions, and stock bears if this persists for months or longer are all very bullish for gold demand. Gold’s broader secular bull isn’t over.
At the end of February just before Trump launched his war, all 500 elite stocks in the S&P 500 averaged bubble-level trailing-twelve-month price-to-earnings ratios of 32.4x. What will happen to stretched corporate earnings as higher energy prices jack up costs for transporting everything? Even if the Strait reopened tomorrow, it would take months to restart oil, LNG, and fertilizer production and normalize global supply chains.
These AI-bubble stock markets were overdue for a major bear even before this extreme geopolitical shock, which will almost certainly hasten it. Meanwhile American stock investors’ portfolio allocations to gold remain vanishingly small. At the end of February, those combined GLD+IAU+GLDM bullion holdings were worth $304.7b. That was still less than 0.5% of the combined market capitalizations of all S&P 500 stocks!
So far in this war, the vast majority of investors and speculators seem to assume it will end quickly due to overwhelming US air power. But that didn’t prove decisive in Vietnam, Afghanistan, or Iraq. Iran’s regime is deeply entrenched, and will never surrender for political and religious reasons. The Middle East reportedly has a saying “no victor, no vanquished”. Iran will wait out Trump by exacting the highest costs possible.
The serious global economic consequences from this Iran quagmire will ultimately prove bullish for gold, boosting world investment demand. So though no one knows where gold will bottom, we’ve been adding new newsletter trades in fundamentally-superior smaller gold miners trying to straddle that. Staring down the double-barrels of big coming price inflation and much-weaker stock markets, gold looks very attractive.
Successful trading demands always staying informed on markets, to understand opportunities as they arise. We can help! For decades we’ve published popular weekly and monthly newsletters focused on contrarian speculation and investment. They draw on my vast experience, knowledge, wisdom, and ongoing research to explain what’s going on in the markets, why, and how to trade them with specific stocks.
Our holistic integrated contrarian approach has proven very successful, and you can reap the benefits for only $12 an issue. We extensively research gold and silver miners to find cheap fundamentally-superior mid-tiers and juniors with outsized upside potential. Sign up for free e-mail notifications when we publish new content. Even better, subscribe today to our acclaimed newsletters and start growing smarter and richer!
The bottom line is gold has suffered a big war disconnect, plunging in March instead of surging. But that seemingly-anomalous selloff mostly resulted from festering extreme overboughtness leading into the war. Gold was still overdue for a serious reckoning following late January’s extraordinary peak, a big-and-fast selloff to rebalance extreme technicals and sentiment. Trump’s Iran war probably ameliorated that some.
Because of that plunge, gold looks way more bullish today than pre-war. Iran will never surrender, and has plenty of asymmetric-warfare options to keep the critical Strait of Hormuz largely shuttered indefinitely. Resulting way-higher global energy and food prices will weigh on stock markets, upping gold’s relative attractiveness. And with trivial portfolio allocations, American stock investors still need to do massive buying.
Adam Hamilton, CPA
March 27, 2026
Copyright 2000 - 2026 Zeal LLC (www.ZealLLC.com)
About the author