
In the hierarchy of money gold is superior to fiat money. From an historical perspective the past decades have been characterized by trust in fiat money, whereby fiat made up the lion share of global international reserves. The war between Russia and Ukraine (and by extension West and East), inflation, and systemic risks are reversing this trend. A long-term gold valuation model, which assumes gold will account for the majority of international reserves, suggests the gold price to exceed $8,000 in the coming decade.
The trend of central banks increasing gold reserves is likely to continue.
The Hierarchy of Money
Reading Zoltan Pozsar’s analyses for a few years led me to read books and follow lectures by his intellectual mentor Perry Mehrling, Professor of International Political Economy. According to Mehrling there is a natural hierarchy of money, to be visualized as a pyramid.
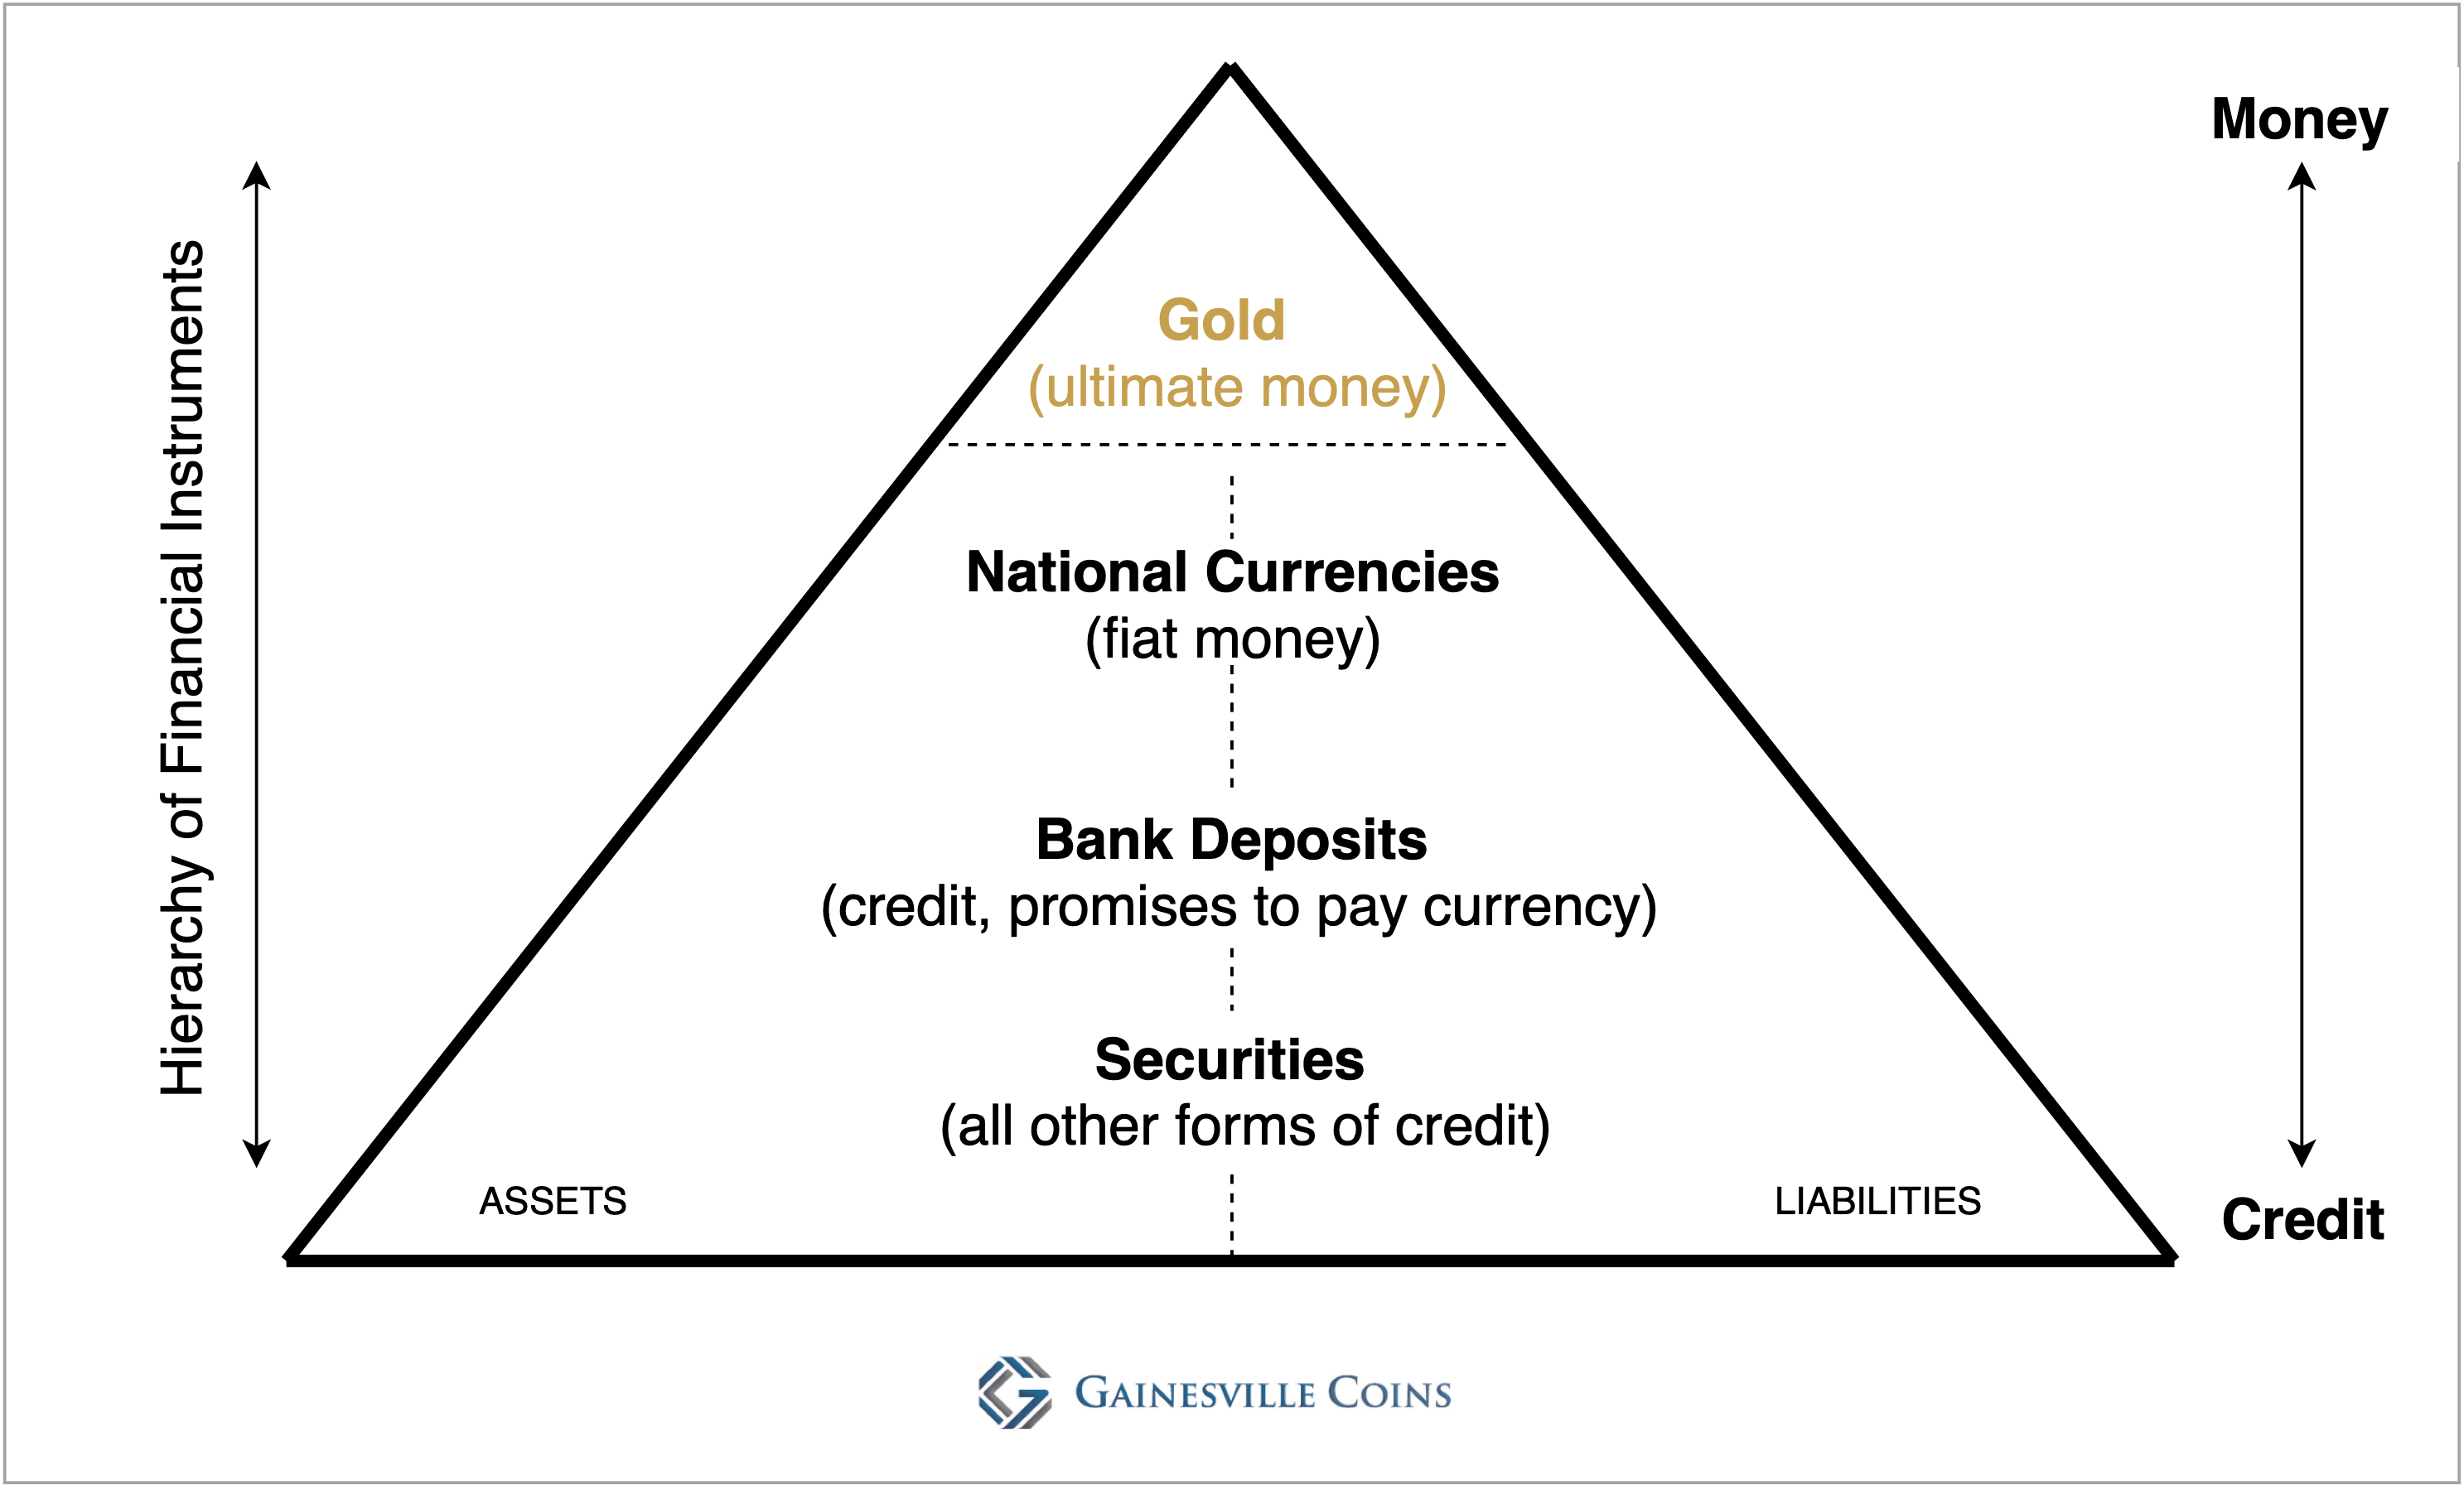
Pyramid of the hierarchy of money.
At the top of the pyramid sits the ultimate money, which is scarce, universally accepted, and has no counterparty risk because it’s no one’s liability: gold. Below gold are national currencies issued by central banks. Then come deposits that are created by commercial banks. Securities, such as bonds and equity, are at the bottom.
Because everything underneath gold can be created out of thin air, the base of the pyramid can be easily widened. Throughout the business cycle balance sheets (assets and liabilities) are extended—credit is created—causing an economic boom. During a recession, balance sheets contract and the shape of the pyramid is remodeled.
Horizontally, the pyramid is all about quantity and leverage. Vertically, the pyramid is about quality: the higher up the better the quality of money. From Mehrling:
In a boom, credit begins to look like money. Forms of credit become much more liquid, they become much more usable to make payments with. And in contraction, you find out that what you have is not money, it's credit actually. In a contraction, you find out that gold and currency are not the same thing. That gold is better. You find out that deposits and currency are not the same thing. That currency is better.
Now my interpretation…
A Long-term Gold Valuation Model
What has happened in the past decades, after severing the gold standard in 1971, is a massive increase in supply of fiat money, credit, and securities. The pyramid is out of shape with a tiny tip and a fat debt belly. Global debt to GDP is near its all-time high established in 2020.
Policy makers won’t allow the debt to default—a contraction of credit—because the global financial system has grown too big and intertwined. One default too much could risk the stability of the entire arrangement. The only way to restore the shape of the pyramid is by an increase in the price of gold.
In a previous article we discussed the relationship between the price of gold and equities over the past one hundred years. These are dynamics between the top of the pyramid and the bottom. We concluded that the current decline of the equity market capitalization, relative to GDP, is signaling a new gold bull market.
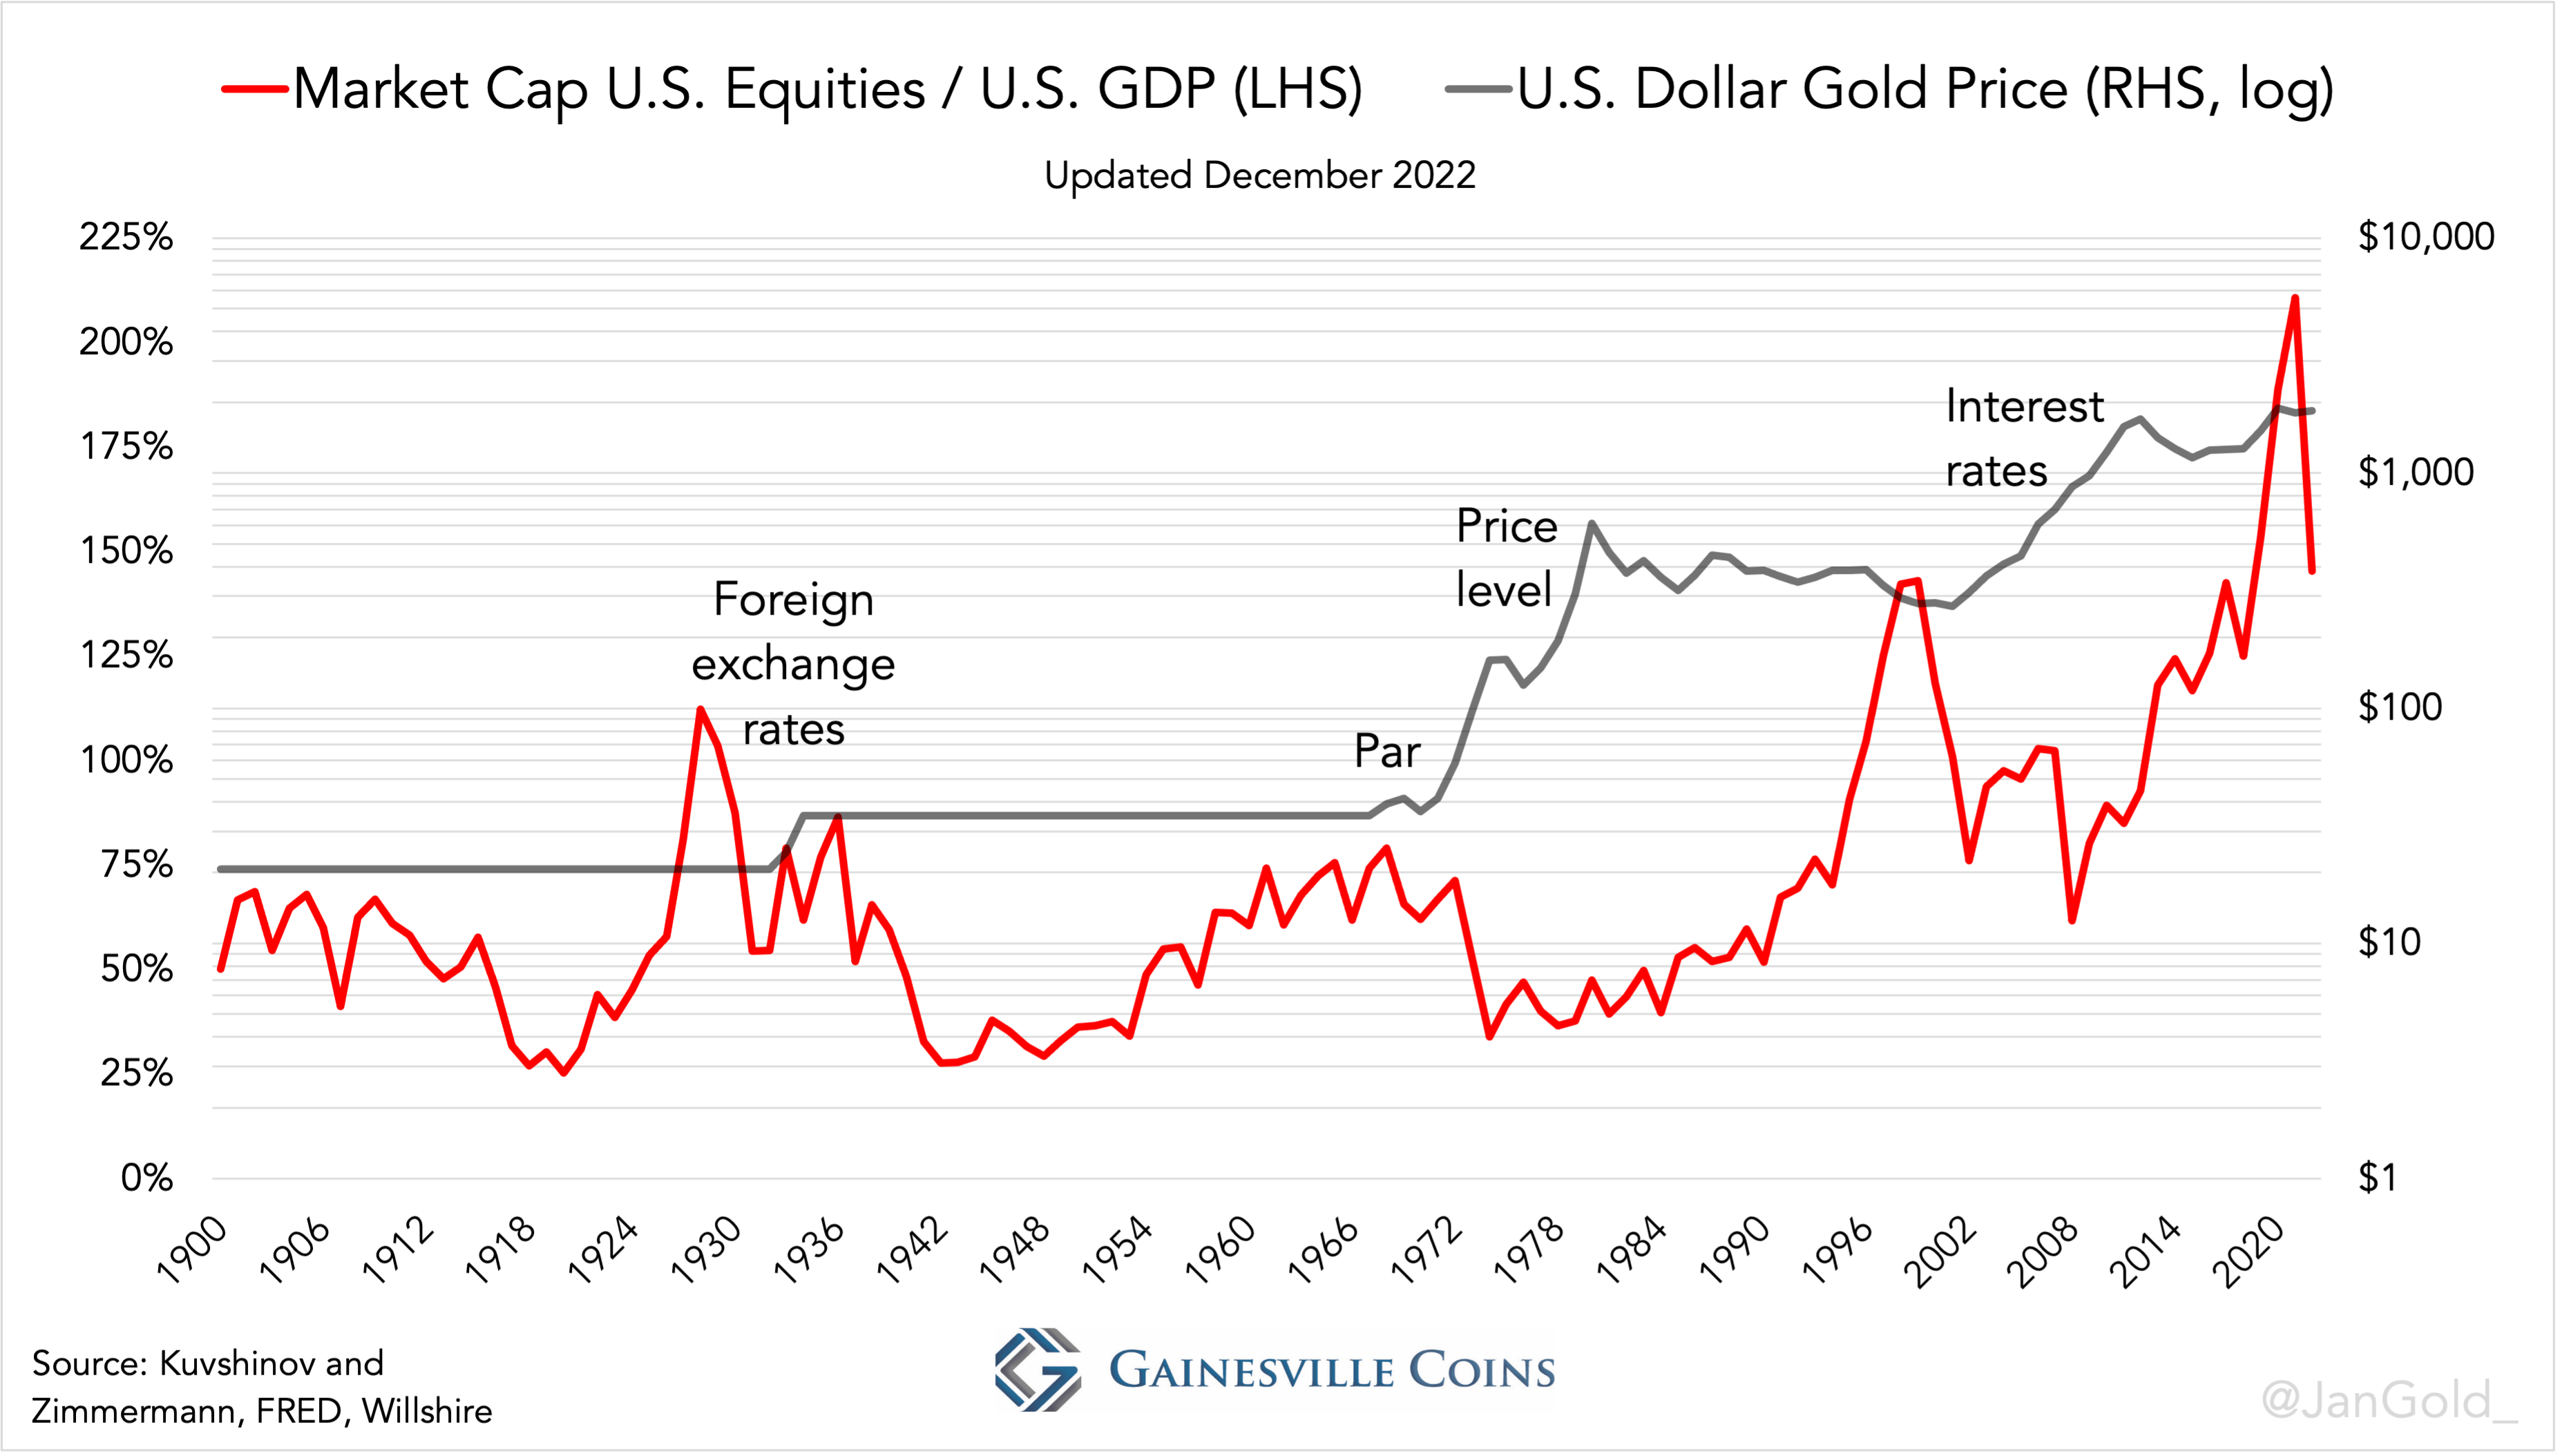
In an economic downturn the US equity market cap to GDP ratio falls, and the dollar is debased through one of the four prices of money (par, interest rates, foreign exchange rates, price level) to boost the economy. As a result, the price of gold denominated in dollars increases.
In today’s article, we will use Mehrling’s hierarchy of money framework, and examine the relationship between national currencies and gold to get a sense of where the price of gold is headed.
Central banks have created so much “money” since 2008 that from an economic perspective the relation with bank deposits has weakened. Measuring the value of official gold reserves versus the monetary base (central bank money) may not satisfy to predict the future price of gold.
Instead, we will evaluate how much gold central banks are willing to hold relative to foreign national currencies. In other words, the composition of international reserves (foreign exchange and gold), which underpin their balance sheets. By going through the archives, I have been able to conceive a long run data series of gold as a percentage of international reserves from 1880 until present*.
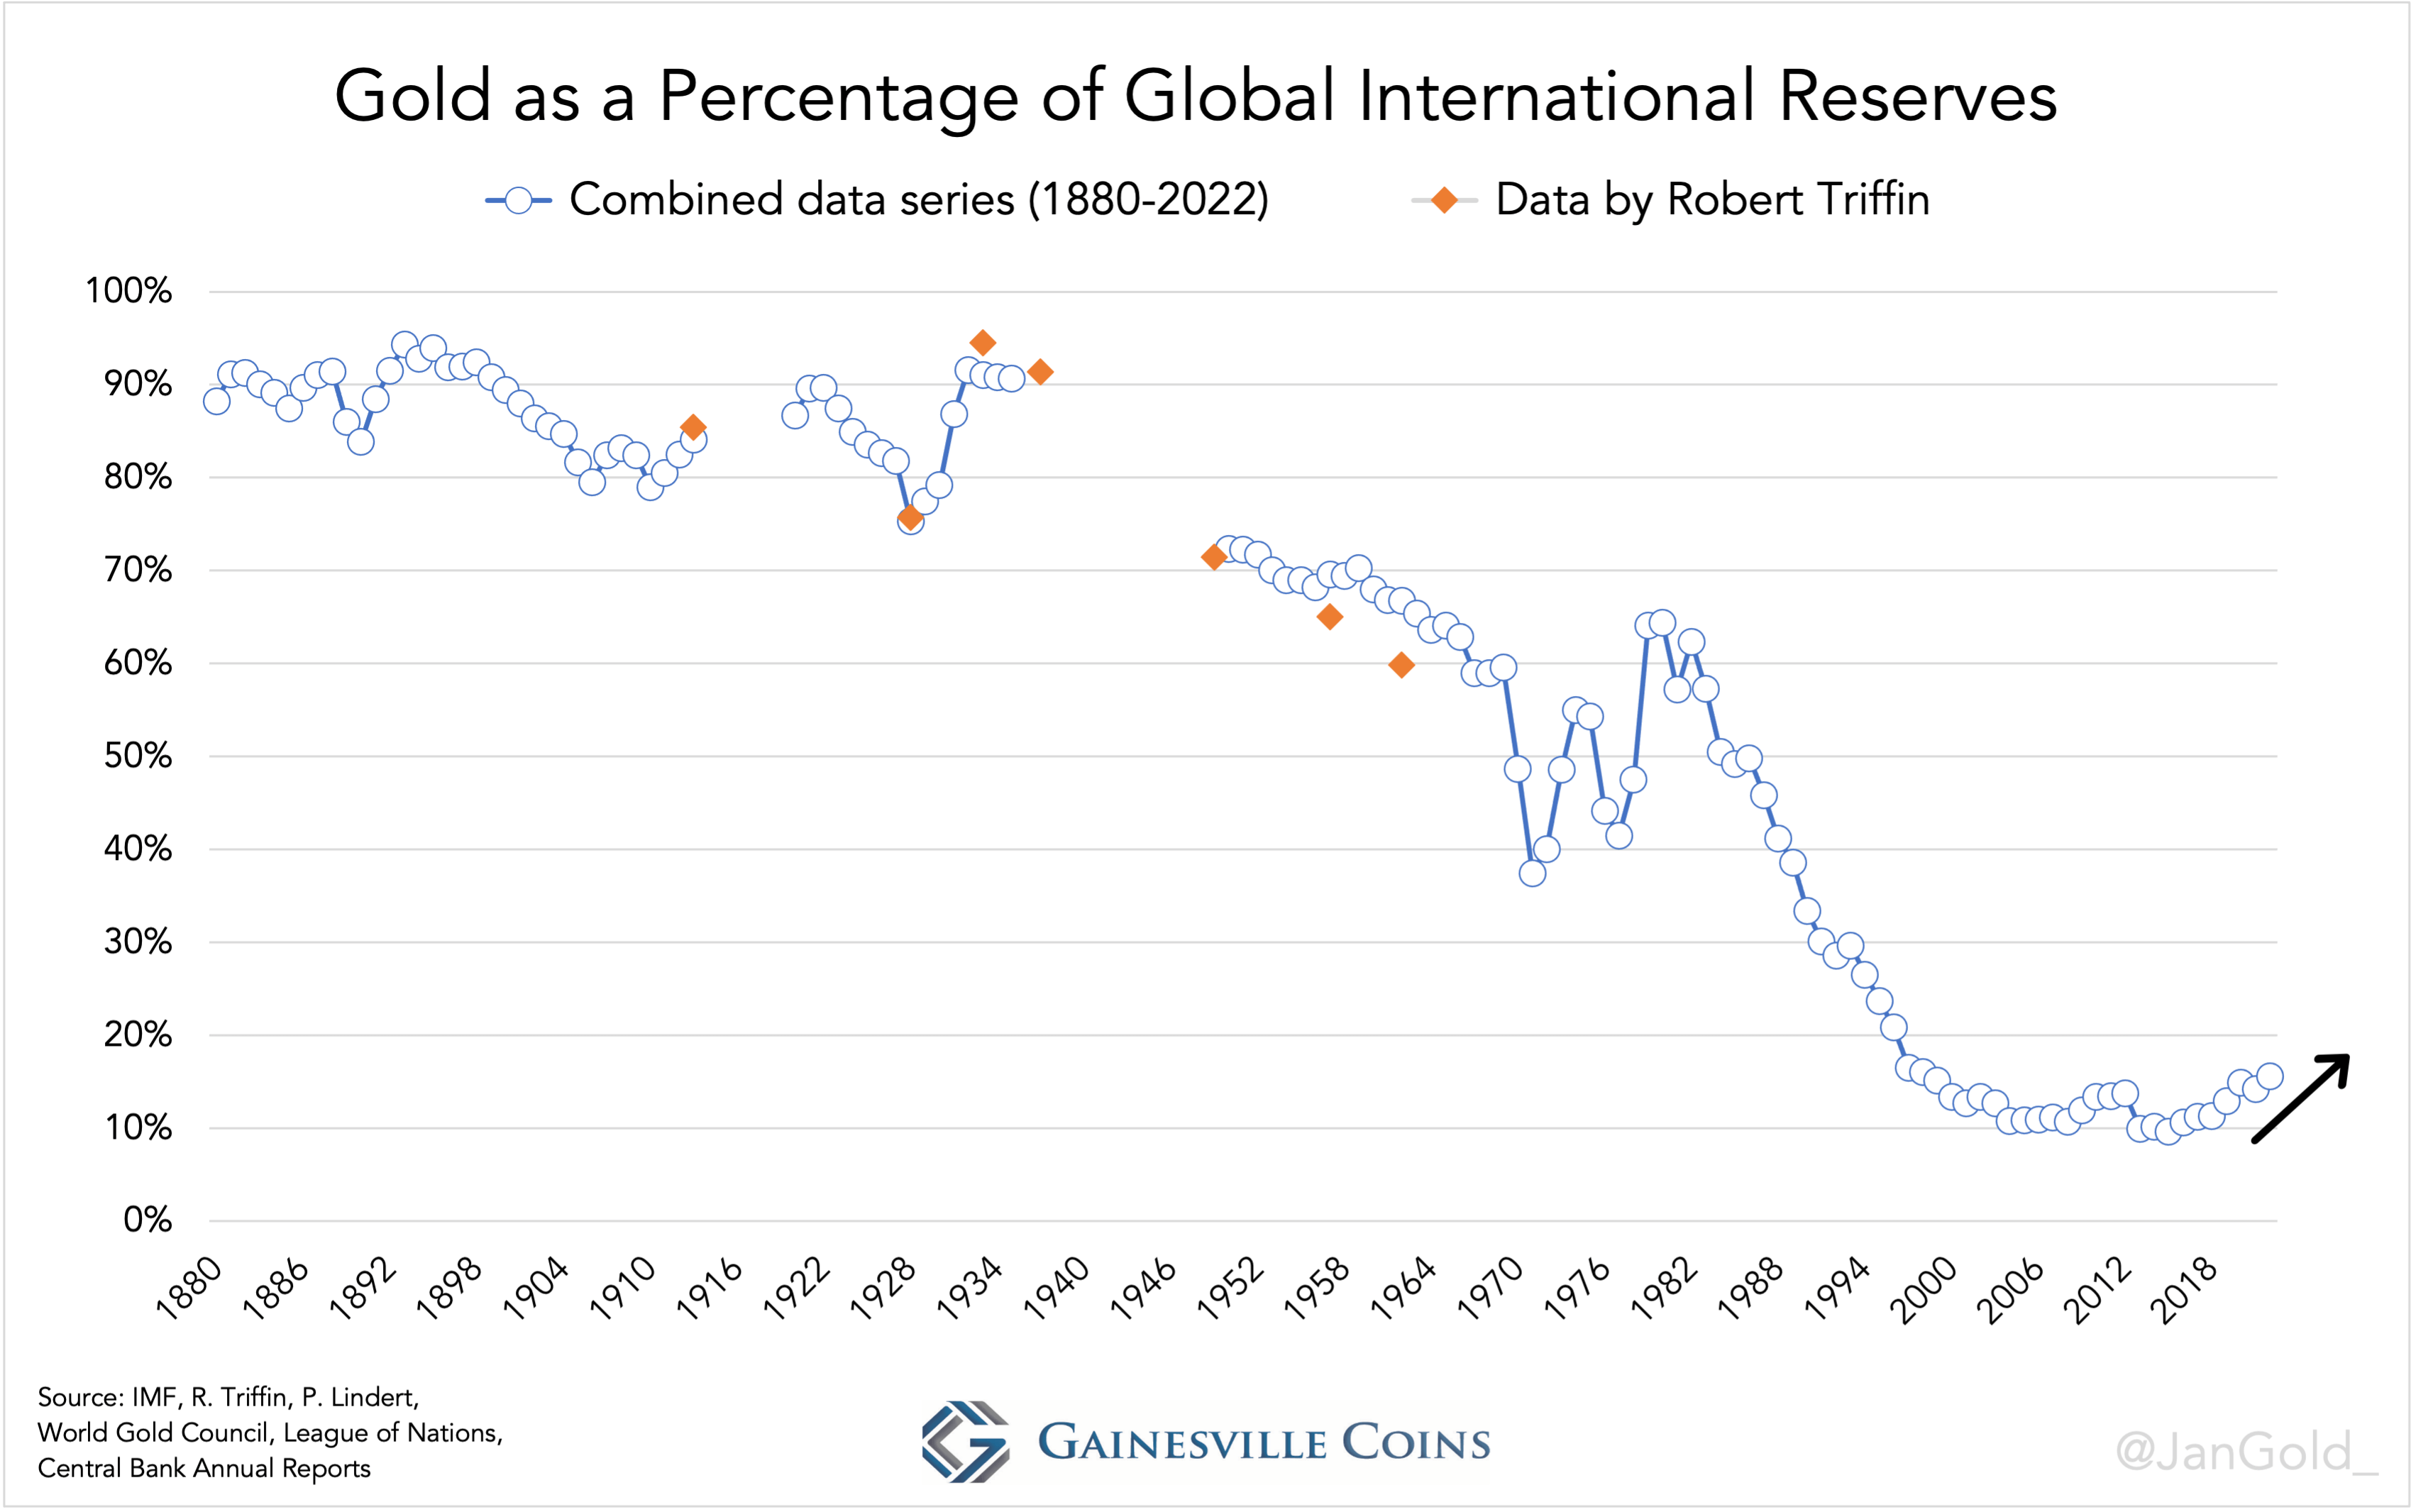
The chart shows world official gold reserves as a percentage of official international reserves.
Central banks in aggregate have an unusual faith in foreign exchange, as gold’s percentage of total reserves accounted for 16% in 2022, against a historical average of 59%. These central banks, however, are starting to lose confidence in the currencies issued by their peers. In 2022 official gold reserves went up by a record 1,136 tonnes, while foreign exchange reserves went down by a record $950 billion. Large purchases by central banks on all continents in recent years indicate how central banks think the system will stabilize, by a rising gold price, confirming they have no intention in designing a new pyramid.
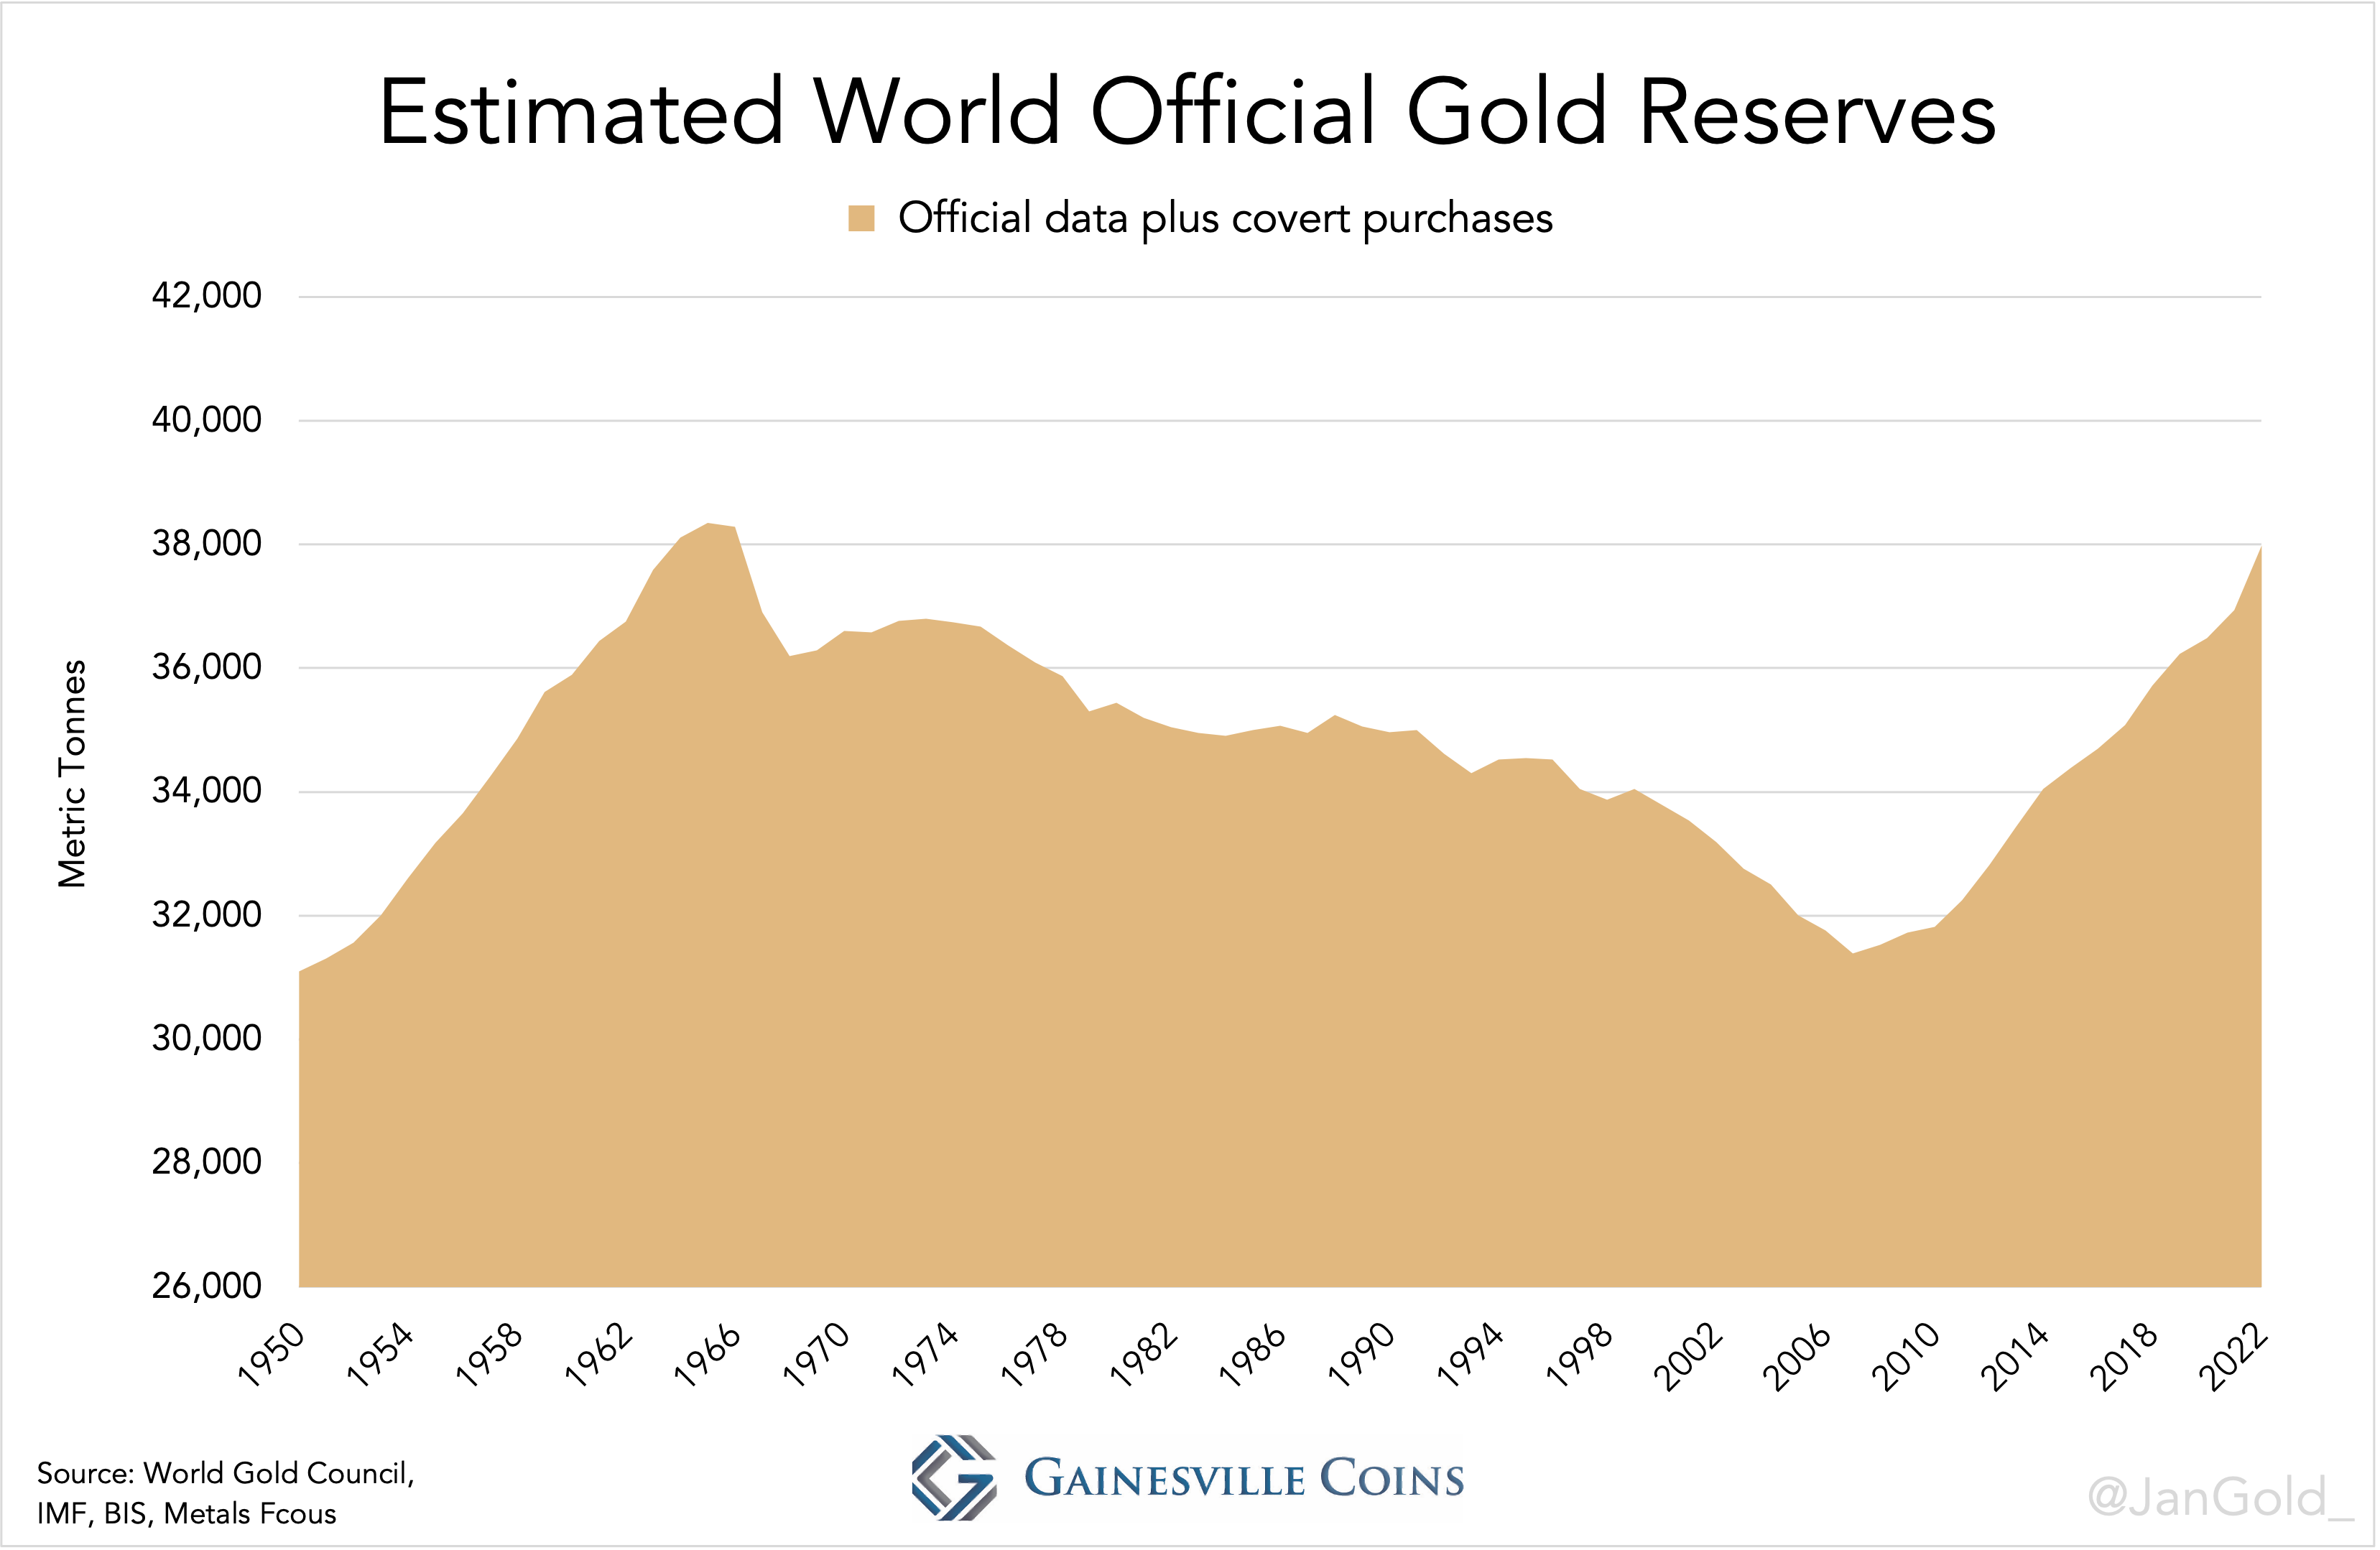
Global gold reserves.
In light of the war, which caused the US to freeze the Russian central bank’s dollar holdings, inflation, and systemic risks, the trend of gold increasing its share of total reserves is logical.
Should we extend this trend and assume gold to make up a conservative 51% of global international reserves, the price of gold would need to be $10,000 per troy ounce. Naturally, in the process of raising the gold price central banks increase the weight of their gold and sell foreign exchange, resulting in a lower price of gold required to make up the majority of total reserves. On the other hand, over time central bank balance sheets grow and so does their demand for international reserves, possibly revaluing gold in urgency.
I use central banks as a proxy for the entire economy. The private sector is in a similar boat as central banks: they have little exposure to gold versus credit assets as well. It’s definitely not just central banks that will drive up the price. Let’s say $8,000 per ounce, a ballpark figure, would make gold’s share of total reserves exceed 50%.
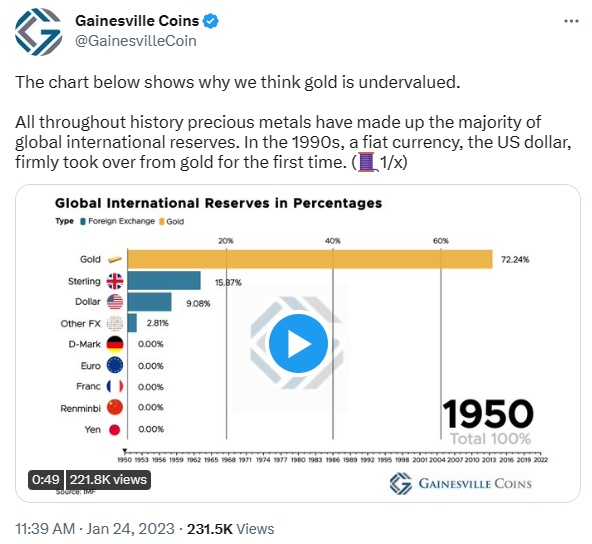
Click the image to view the animated chart!
Conclusion
Throughout the ages the price of gold always rises as the amount of physical metal available is insufficient to meet mankind’s liquidity needs. National currencies devaluing against gold to increase liquidity is a fact of life.
In the old days, coins were debased by lowering their bullion content, resulting in more units of national currency. Since the gold standard was abandoned in 1971, fiat money can be created by the stroke of a key, aimed at boosting growth, or revitalizing the base of the pyramid. But the top inevitably follows. The price of gold has to go up to reset the shape of the pyramid. Now—given war, inflation, and systemic risk—will be one of those moments for the gold price to adjust.
*For this article I have excluded Special Drawing Rights, IMF Tranche Positions, and silver from international reserves, for the consistency of the data series and because they make up only a small part of total international reserves. Data from 1880 until 1913 is mainly sourced from Peter Lindert and Timothy Green. The numbers include official gold and foreign exchange reserves, not foreign exchange held by private banks or gold coins in circulation. Data from the interwar period is sourced from multiple publications by the League of Nations, Central Bank Annual Reports, the World Gold Council, and the Federal Reserve. Data since 1950 is sourced from the IMF, the World Gold Council, Metals Focus, and the BIS. Data from Robert Triffin is used as a check on my calculations. The numbers from 1880 until 1935 must be viewed as estimates.
Sources
- Bank for International Settlements (BIS), Annual and Monthly Reports.
- Banca D’Italia (1987). Gold In the International Financial System.
- Bloomfield, A. I. (1963). Short-Term Capital Movements Under the Pre-1914 Gold Standard.
- Board of Governors of the Federal Reserve System (1943). Banking and Monetary Statistics 1914-1941. Part 1.
- Eichengreen, B. & Flandreau, M. (2009). The rise and fall of the dollar (or when did the dollar replace sterling as the leading reserve currency?)
- Green, T. (1999, for the World Gold Council). Central Bank Gold Reserves. An historical perspective since 1845.
- International Monetary Fund. International Financial Statistics.
- League of Nations, multiple publications.
- Lindert, P. H. (1967). Key Currencies and The Gold Exchange Standard, 1900-1913.
- Lindert, P. H. (1969). Key Currencies and Gold 1900-1913.
- Mehrling, P. (2012). Economics in Money and Banking.
- Triffin, R. (1961) Gold and the Dollar Crisis, The Future of Convertibility.
- Triffin, R. (1964). The Evolution of the International Monetary System: Historical Reappraisal and Future Perspectives.
- World Gold Council, Gold Demand Trends reports and Datahub.
Read more about gold's role as international reserves from the author:
Zoltan Pozsar, the Four Prices of Money, and the Coming Gold Bull Market
Estimating the True Size of China’s Gold Reserves
Europe Has Been Preparing for a Global Gold Standard. Part 2
Turkish Central Bank Sends Gold To London. In Need for FX?
Governor of Dutch Central Bank States Gold Revaluation Account Is Solvency Backstop
What Happened to the $650 Billion in SDRs Issued in 2021?
About the author
