Want to hear something really scary? Inflation, the scourge of the modern economy, may be running much faster than we’re led to believe.
I’ll use consumer spending on Halloween as an example of what I mean.
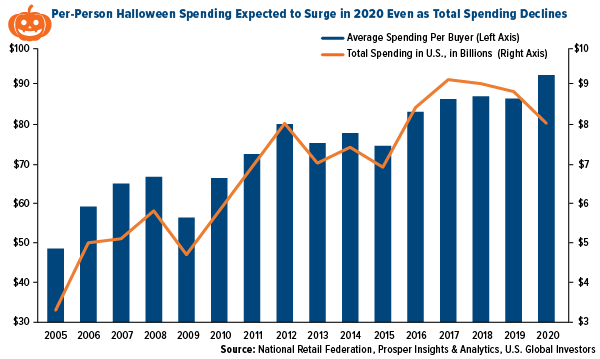
Total Halloween spending has fallen for the past three years and was projected to fall yet again this season, to $8 billion from $8.8 billion last year, according to recent data from the National Retail Federation (NRF).
No surprise there. With many people still avoiding large gatherings due to the pandemic, and health officials calling trick-or-treating a “high-risk activity,” less is going to be spent on candy, costumes, party decorations and other Halloween-related items.
Indeed, spending on costumes was forecast to plunge a not insignificant $600 million compared to last year, from $3.2 billion to $2.6 billion.
Given this, you might suppose that on a per-person basis, Halloween spending would also be down. And yet that’s not the case, according to the NRF’s survey. Average spending per consumer was expected to increase almost 7 percent, from $86.28 to $92.12.

So what’s going on here?
There may be a number of possible explanations for this phenomenon, but I believe the most convincing is also the simplest: Inflation.
And as I’ve said before, the real inflation may be much higher than the official consumer price index (CPI) issued monthly by the Bureau of Labor Statistics (BLS).
Last month, the BLS reported that consumer prices were up only 1.4 percent in September compared to the same time last year. If we remove volatile food and energy prices, they were up slightly more, at 1.7 percent.
How can this be, when consumers are spending 7 percent more on candy and costumes this year, despite total Halloween spending declining?
The truth is that the CPI has undergone several changes in methodology over the years. At one time, it was a genuine cost of goods index (COGI). Today, however, it’s more of a cost of living index (COLI). So when you see that inflation is up 1.4 percent year-over-year, you can be sure it’s actually higher—potentially much higher.
How much higher? Economist John Williams, who runs the popular website ShadowStats.com, uses the 1980 methodology for measuring inflation. According to this gauge, consumer prices are up closer to 9 percent than 1 percent.
The implication, of course, is that inflation could be eating your lunch faster than you realize. And that’s truly scary, whether you’re still in your wealth building years or retirement.
Positioning Your Portfolio for Treasury Secretary Elizabeth Warren
There’s reason to believe that the rate of inflation could get a boost next year, particularly if we see additional multi-trillion-dollar stimulus packages. I’ll discuss the election more in-depth below, but I’ll say upfront that it’s being reported that Massachusetts senator Elizabeth Warren is seeking an appointment as Treasury secretary should Joe Biden win tomorrow.
This is the same Elizabeth Warren who, while still a presidential candidate, said her Medicare-for-all health care plan would cost a staggering $52 trillion.
I’ve written before about modern monetary theory (MMT), the controversial economic thought that says governments with complete control over their own currencies can spend as freely as it wants. To a proponent of MMT, a $52 trillion price tag means nothing. Just print more money.
Currently the system is just that—a theory—but with the possibility of a Treasury Secretary Warren, MMT may become a reality sooner than we expected.
That said, get ready for unrestricted money printing—and, as a result, hyperinflation.
Goldman Sachs forecasts higher inflation next year. The investment bank recommends commodities, raw materials and other hard assets, which would benefit in a high-inflation environment.
Many big-name money managers are urging investors get exposure to gold. Speaking at the Robin Hood Investors Conference last week, billionaire family office manager Stanley Druckenmiller said he believed a “blue wave” would hurt equities long-term and that bond yields and gold prices would rise.
Also last week, I had the pleasure of co-hosting a webcast with my friend Kevin O’Leary, “Mr. Wonderful.” Kevin said he was maintaining a 5 percent weighting in gold, split between physical bullion and shares of SPDR Gold Shares (GLD). Gold, he said, is “all about hedging against inflation.”
Gold Investment at Record Highs
The yellow metal’s traditional haven status has definitely strengthened this year. The World Gold Council’s (WGC) summary of the third quarter shows that total holdings in gold-backed ETFs hit a record high of 3,880 tonnes, having added 272.5 tonnes in the three months ended September 30.
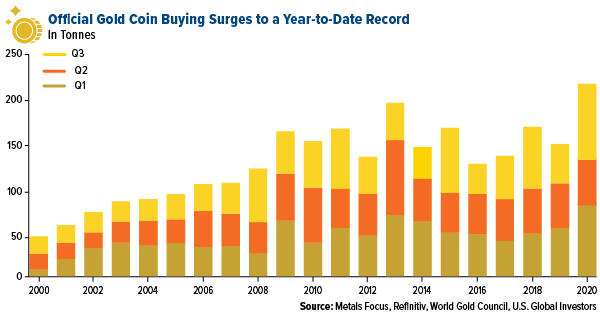
Physical gold investment also hit a new all-time high. Gold bar and coin purchases increased an incredible 49 percent year-over-year through the end of the third quarter, reaching 222.1 tonnes. Largest volume increases were seen in Western markets, China and Turkey, the WGC says.

Final Comments Before the Election
Speaking of breaking records… As of Friday, a record 80 million Americans participated in early voting. Here in my home state of Texas, more than 9 million people have voted early—which exceeds the total number of Texans who went to the polls in 2016.
What this suggests is that voters this cycle are galvanized like never before.
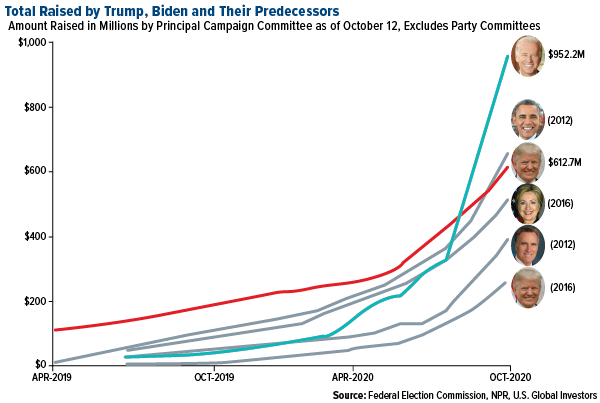
But we already knew that. For what it’s worth, Biden has raised more money than any other presidential candidate in U.S. history. As of October 12, his war chest stood at a head-spinning $952.2 million, which is one and a half times as much as President Donald Trump has raised over the same period.

The market also appears to be pointing toward a Biden victory. In August, I shared with you that when the market was up from July 31 to October 31, it historically favored the incumbent party. And when the market was down, it favored the challenger.
As of the close on Friday, the S&P 500 was down 0.37 percent from July 31. What’s more, last week was the worst for stocks since mid-March.
What’s working in Trump’s favor right now? Certainly stellar economic growth in the third quarter. GDP expanded at a record pace of 7.4 percent quarter-over-quarter and 33.1 percent annualized.

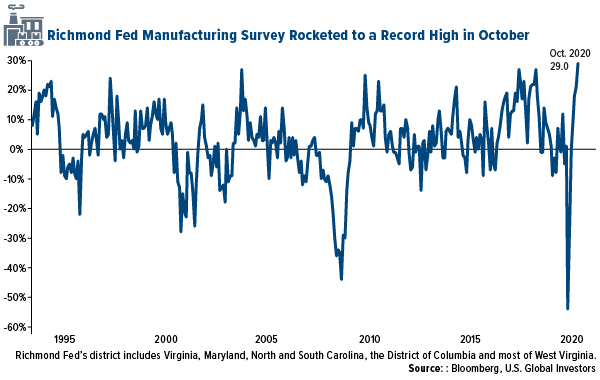
Also, manufacturing activity has been incredibly positive. The U.S. ISM Manufacturing PMI has been in expansionary mode for the past three months, and in October it registered a 59.3, the highest reading since September 2018. Last week, the manufacturing index for the Federal Reserve Bank of Richmond shows factories growing at a record pace. The index hit 29.0 in October, the highest reading going back to 1992.
Nothing is set in stone, obviously, and there’s always the possibility that election results will be contested. However things turn out, be prepared for heightened volatility.
All opinions expressed and data provided are subject to change without notice. Some of these opinions may not be appropriate to every investor. By clicking the link(s) above, you will be directed to a third-party website(s). U.S. Global Investors does not endorse all information supplied by this/these website(s) and is not responsible for its/their content.
Consumer prices (CPI) are a measure of prices paid by consumers for a market basket of consumer goods and services. The yearly (or monthly) growth rates represent the inflation rate. The Purchasing Managers' Index (PMI) is an index of the prevailing direction of economic trends in the manufacturing and service sectors.
The S&P 500 is widely regarded as the best single gauge of large-cap U.S. equities and serves as the foundation for a wide range of investment products. The index includes 500 leading companies and captures approximately 80% coverage of available market capitalization.
Holdings may change daily. Holdings are reported as of the most recent quarter-end. The following securities mentioned in the article were held by one or more accounts managed by U.S. Global Investors as of (09/30/2020): SPDR Gold Shares.

