
A government generally has two “levers” it can pull, to help get its economy back on track after it has fallen into a recession and/or is posting abnormally low economic growth.
Monetary policy refers to the actions of central banks to achieve macroeconomic policy objectives such as price stability, full employment and stable growth.
Fiscal policy encompasses the power of the federal government to tax and spend. In the United States, fiscal policy decisions are made by the Congress and the administration; the US Federal Reserve, or central bank, plays no role in this regard.
The Fed is responsible for setting monetary policy and it is supposed to be free of political interference from Congress or the executive branch. The US President appoints the Federal Reserve Chair and its seven-member board of governors, whose positions are then confirmed by the Senate.
All the board members serve on the Federal Open Market Committee (FOMC), which meets eight times a year to set monetary policy.
The Fed has a dual mandate of establishing maximum employment and price stability; the latter normally allows for 2% inflation. Its main policy tool is the federal funds rate, giving the Fed control over the rate that banks charge each other for short-term loans. By adjusting the level of short-term interest rates, the Fed can influence longer-term rates, thus changing the financial conditions that can affect the spending decisions of households and businesses. Read more about the Fed
When it comes to controlling inflation, the distinction between fiscal and monetary policy is important because one of the levers — fiscal policy — is far more likely to cause inflation than the other. And while the Fed has been saying that “the taper” (shorthand for a gradual end to the massive bond-buying program it unleashed in early 2020) that started in November is a precursor to cutting interest rates sometime next year, the reality is that the previous Fed “taper tantrum” in 2013 had virtually no impact on inflation, nor did “quantitative easing” cause inflation as it was expected to during the first rounds of QE between 2008 and 2014.
The Fed is currently caught between a rock and a hard place, to quote a well-worn phrase. The only way to tame the current out-of-control US inflation which at 6.8% is growing the fastest since 1982, is to raise interest rates, but the Federal Reserve is highly constrained in how much it can hike rates due to its monstrous national debt, which at last count has surpassed $29 trillion. This is the dilemma the Fed and US policymakers must contend with as 2021 draws to a close.
QE 2008 vs 2020
In 2008 in response to the financial crisis which started in 2007, the Fed tried a radical new program called quantitative easing. The idea behind QE, as it was soon shortened to, was to “goose the economy” through the purchase of bonds. The Fed realized that cutting short-term rates close to 0% wasn’t enough to stop the US economy from freefalling, so it began buying long-term bonds (and mortgage-backed securities). Adding to the demand for long-term bonds lowered their yields. QE was designed as a way to inject liquidity into the financial system by getting banks to make more loans.
Eventually QE caught on, and it was adopted as monetary policy by the Bank of England (BOE), the Bank of Japan (BOJ) and the European Central Bank (ECB).
Critical to an understanding of today’s inflation dilemma and what can (and can’t) be done about it, is to appreciate that the quantitative easing of 2008-14 is quite different from that of 2020-21.
To fight the Great Recession, the Fed began “printing money” (actually they just added it on a computer screen, but the effect was the same). Between 2008 and mid-2014 the Fed increased their balance sheet from $800 billion to $4.5 trillion, thus helping to recapitalize banks that were in danger of going bankrupt, and restoring confidence in the economy.
But most of the new money never made its way into the economy; it stayed within the banks and much of it wasn’t even leant out. We therefore didn’t see any real inflation. In fact during this time inflation averaged about 1.6% a year, below the Fed’s 2% target.
Once the pandemic started in early 2020, the Federal Reserve resumed quantitative easing at a torrid pace, within weeks printing $3 trillion and again lowering interest rates to 0%.
The key difference between QE from 2008 to mid-2019, “quantifornication” I like to call it, and now, is that the Federal Reserve has been buying up US government debt (Treasuries) to fund a massive amount of government spending and is therefore adding to the national debt currently sitting at $29T.
US politicians since 2020 have been willing to spend whatever it takes to get the economy moving again and to maintain a bullish stock market that has kept rising for over a decade. First there was the $2.2 trillion CARES Act passed by then-President Trump. It was followed in early 2021 by President Biden’s $1.9 trillion covid relief bill.
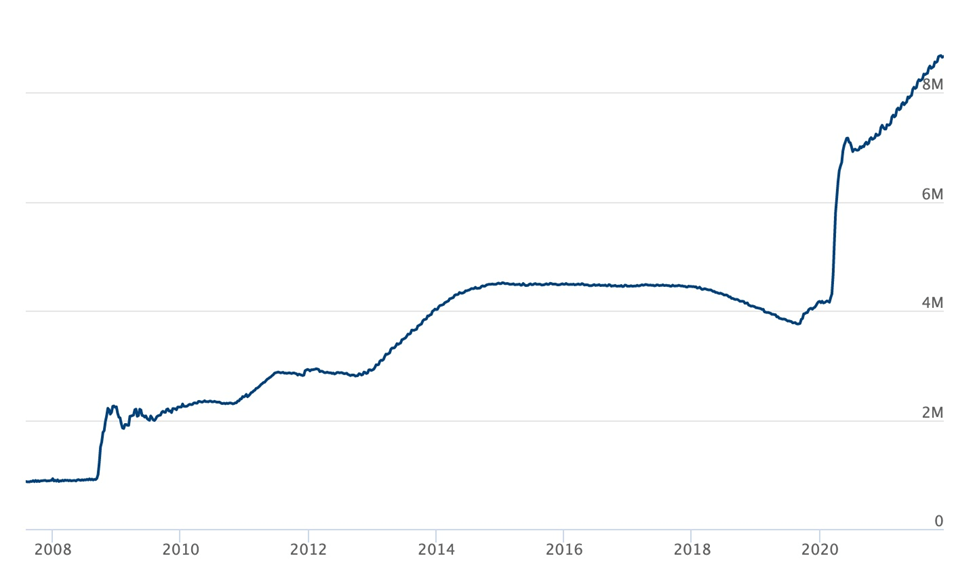
All of this pandemic-related spending has dramatically increased the “M2” money supply, shown below.
 M2 money stock. Source: Nasdaq
From March 2020 to November 2021, the Fed more than doubled its balance sheet to $8.7 trillion. The central bank raised its monthly bond purchases to $120 billion in December 2020, saying that the pace would continue until there was “substantial further progress” in the economic recovery.
 The Federal Reserve’s balance sheet. Source: US Federal Reserve
The federal government too has demonstrated its willingness to “do anything” to get an economic recovery and that has included sending stimulus checks, aka “stimmies” to individual Americans. The IRS has reportedly issued more than 169 million payments in the third round of direct stimulus aid, and there is a possibility of a fourth round. In all, eligible adults have so far received $3,200, including $1,200 in March 2020, $600 in December 2020 and $1,400 this past March.
Doing some quick math, if 169 million Americans received all three stimulus checks, that comes out to $540,800,000,000, or roughly half a trillion dollars. Only counting the $1,400 third payment amounts to 236 billion, 600 million dollars.
In 2008 regular people received no such payments, in fact the main recipients of US government generosity were the banks and large US corporations. According to MIT, the direct cost of the 2009 bailouts was $498 billion. Of this, the Treasury Department was authorized to buy up to $250 billion in bank shares, which it later sold for a profit, from among Troubled Asset Relief Program (TARP) assistance totaling $245.1 billion. Government capital fusions into Fannie Mae and Freddie Mac totaled $191.5 billion.
This also explains why financial crisis fiscal policy was not inflationary whereas 2020 fiscal policy was, and is — all the money or most of it in 2008-09 stayed within the banks or large corporations, and almost none of it made it into the economy. By contrast, in 2020-21 by our calculations about half a trillion dollars was given directly to Americans. In the United States consumer spending accounts for roughly two-thirds of GDP. How have Americans spent that money? There’s no way of knowing for sure. Some socked it away in savings accounts, others used it to buy bitcoin and meme stocks, but a good portion spent it on goods and services, helping to drive the economic recovery as well as pushing inflation higher.
Inflation highest in 40 years
An article in The Atlantic makes some erroneous statements regarding the “transitory” nature of inflation (in fact it’s more sticky that many want to believe), but is correct in naming the main factors behind rising prices over the past year as: fiscal stimulus (including direct payments) tight labor markets and supply-chain problems resulting from the covid-19 pandemic.
Author Adam Ozimek writes, Because so much of the $1.9 trillion stimulus was distributed all at once, its immediate fiscal impact was a massive 7.6 percent of GDP in the first quarter of 2021…
In an economy where in-person services were still mostly shut down, sending big, onetime checks to people not only pushed demand above the supply, but also ensured that spending largely went into already capacity-constrained goods sectors, such as furniture, household improvements, and consumer durables. Manufacturers that were already stretched thin could and would expand only so much to match what they knew was short-term, pandemic-driven demand; predictably, this pushed inflation in the goods sector even higher.
The evidence of widespread and quickening US inflation is now overwhelming. Inflation in November spiked 6.8% compared to a year ago, the highest since June, 1982 and the ninth consecutive month the rate stayed above the Fed’s 2% target.
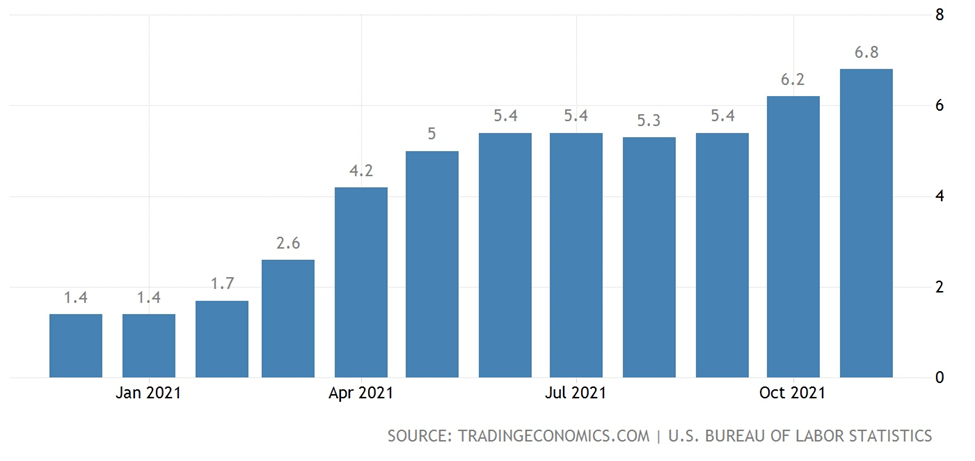 US inflation (CPI). Source: Trading Economics
The pace of the rise suggest the US Federal Reserve is well behind the curve in controlling price increases, led by “the essentials” of food, fuel and shelter.
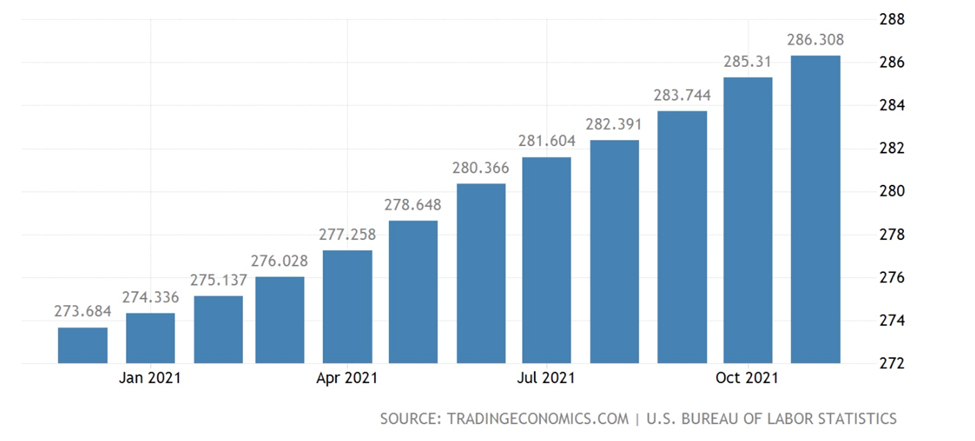
The chart below by Trading Economics says it all, with the Consumer Price Index (CPI) in the United States climbing steeply to 278 points in November 2021 compared to just 262 points in January.
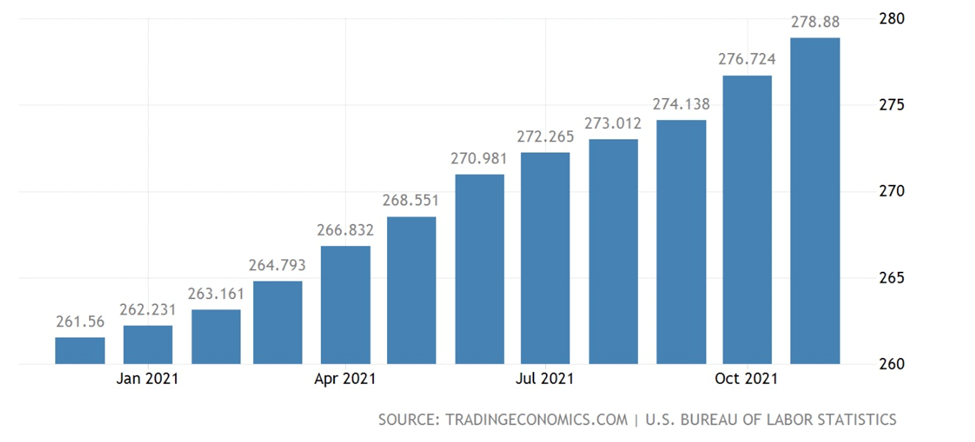 Consumer Price Index. Source: Trading Economics
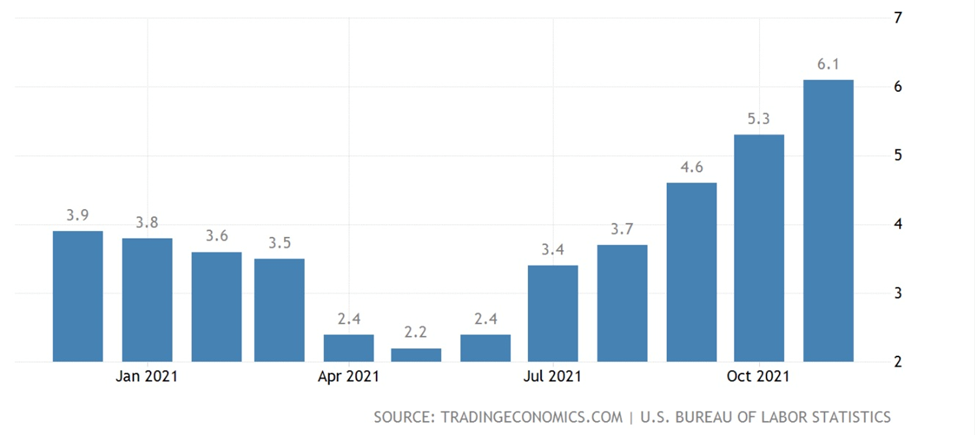
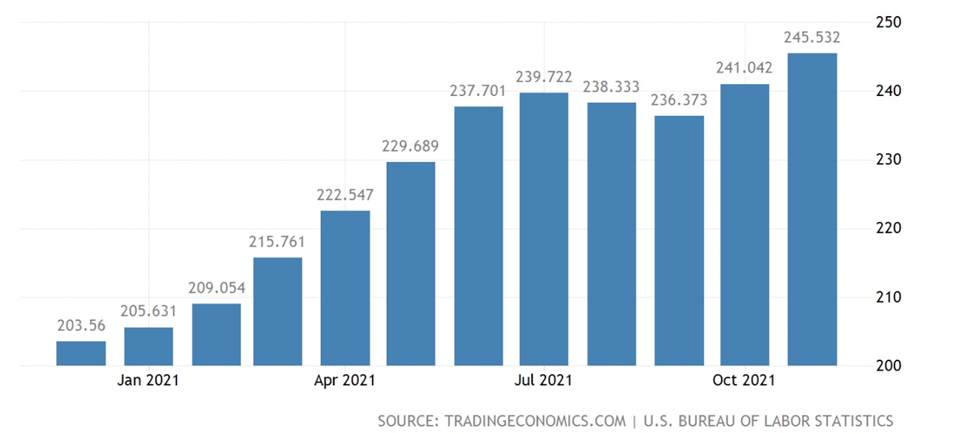
Energy costs recorded the biggest gain, 33%, including a 58% increase in gasoline and a 25% increase in natural gas; shelter costs rose 3.8%, the most since 2007; and food prices vaulted 6.1%, the highest since October, 2008 (the CPI for meat rose 16% year over year).
The producer price index in November climbed 9.6% from a year earlier, the largest in figures going back to 2010, and well above October’s 8.6%.
 Food inflation. Source: Trading Economics
 CPI housing utilities. Source: Trading Economics
 CPI transportation. Source: Trading Economics
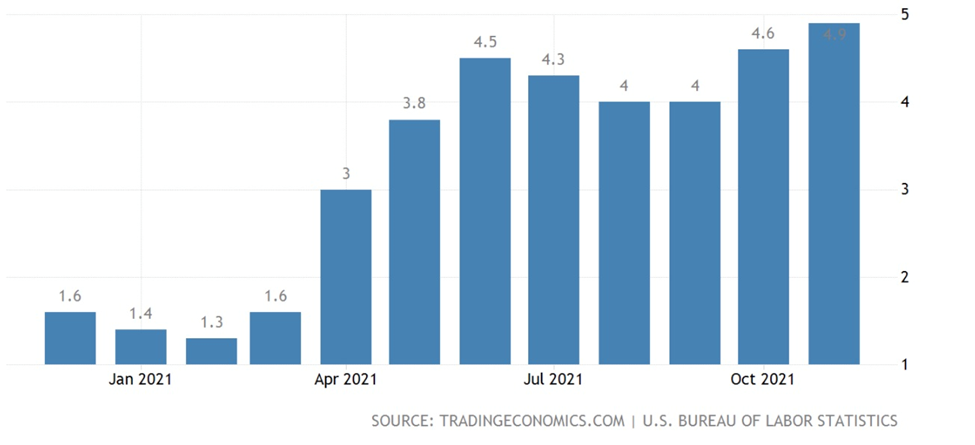
Excluding food and energy, the inflation metric known as core CPI went up 4.9% compared to 4.6% in October, the highest since June, 1991.
 Core inflation rate. Source: Trading Economics
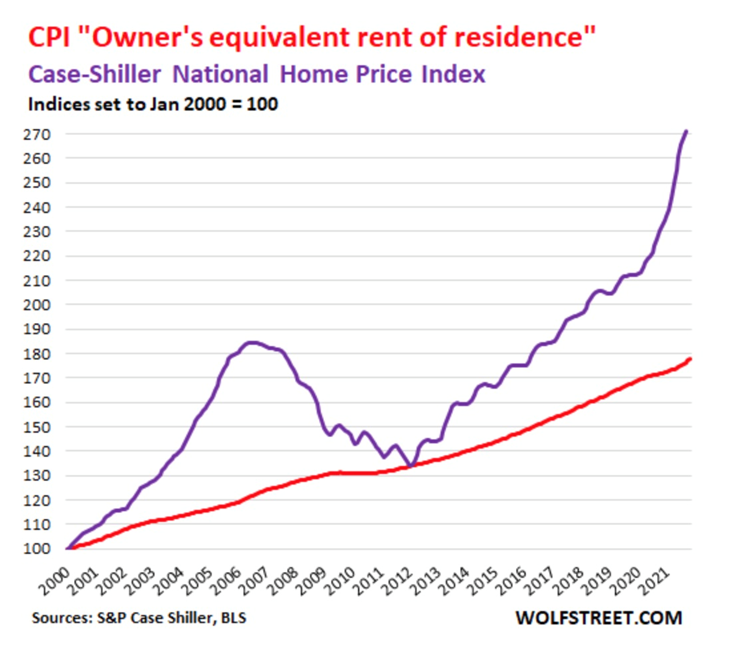
Wolf Street reports “actual home prices have spiked by historic amounts,” with the Case-Schiller Home Price Index which tracks price changes of the same house over time, soaring 20% year over year. The “owner’s equivalent of rent” which measures the costs of home ownership (red line in graph below) is also tracking higher.
Other salient points by Wolf Richter @ Wolf Street:
- Nearly all interest rates and yields, including on risky junk bonds, are now negative in real terms. This – the Powell Fed that unleashed this monster and has been feeding it month after month – has got to be the most reckless Fed ever.
- Inflation without food and energy – OK, Americans, go ahead and try to live without food and energy – spiked by 4.9%, the most since June 1991. This shows how embedded inflation is now in the economy beyond energy, and it has started to hit services, which is hard to explain away by jabbering uselessly about “bottlenecks and shortages.”
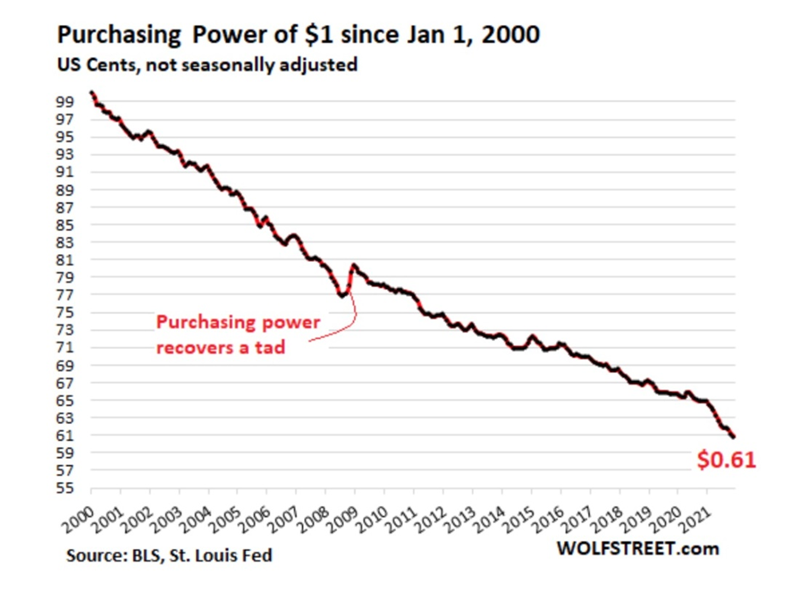
- Inflation in consumer prices is another term for the loss of the purchasing power of the consumer’s dollar. In November, the purchasing power of what was $1 in January 2000 dropped to 60.81 cents:
- The CPI for new cars and trucks spiked by 11.1% year-over-year. In the history of this CPI, there were only a couple of months in 1975 when new vehicle prices rose even faster topping out at 12.7% in March 1975. We may be looking at what in a few months from now will be the worst-ever inflation in new vehicles as consumers no longer care about price and pay whatever, even thousands of dollars over sticker (chart shows the year-over-year % change):
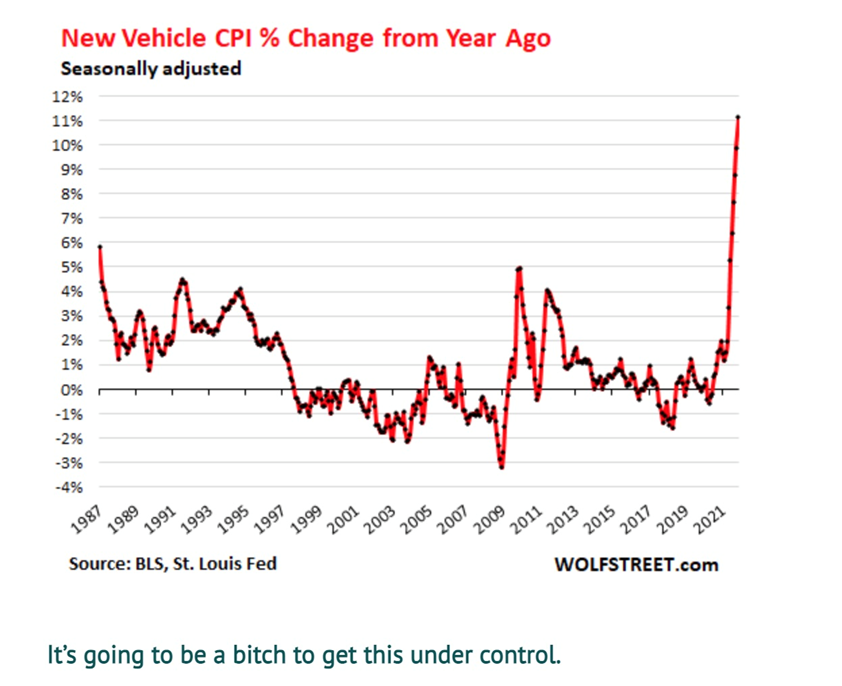
- This inflation is spiraling out of control because consumers and businesses are now willing to pay the higher prices. The dam has broken. The inflationary mindset has changed for the first time in decades. And this is happening as nearly unlimited amounts of newly created money washing around the globe has destroyed all sense of price resistance. And the Fed is still making it worse by pouring more fuel on the raging fire.
Trying to get this under control will be tough and will take a long time.
Higher costs have made their way to the bottom of the food supply chain ie fertilizer.
Higher fertilizer prices are usually passed onto the buyer of meat, fruits and vegetables, for the rancher/ grower to preserve his profit margin. This is precisely what we see happening right now.
In November the Green Markets North American Fertilizer Index hit a record high, rising 4.4% to US$1,094 per ton, surpassing the previous week’s record and its 2008 peak.
According to BNN Bloomberg, the fertilizer market has been smoked this year due to extreme weather, plant shutdowns and rising energy costs — in particular natural gas, the main feedstock for nitrogen fertilizer.
 Fertilizers Price Index. Source: YCharts
In Europe, surging natural gas prices have forced a number of nitrogen-fertilizer plants to halt or curtail production.
Green Markets says expensive fertilizer could push US corn farmers’ cost of production costs 16% higher. It could also mean smaller corn crops as some farmers look at switching to soybeans. Corn futures in Chicago haven risen more than 10% since mid-October, driven by concerns over fewer plantings.
Higher fertilizer costs are affecting farmers at a particularly bad time, as their crops are being ravaged by droughts and pandemic-related shortages that have interrupted normally smooth supply chains that deliver food from farm to table.
Canadian grain farmers say the fertilizer rally “could not be any worse” after many saw their profits tumble this past growing season due to a severe drought that withered crops. With rising fertilizer prices adding an extra C$40-50 per acre, some may decide to plant crops requiring less of the stuff, like lentils.
Grain prices have surged over the past 12 months, with corn and soy coming within 5% of their 2012 drought-related highs. “The world is slowly slipping into an agricultural crisis,” reads a recent report by Wall Street natural resource investment firm Goehring & Rozencwajg.
Making the connection between high fertilizer prices and crops, G&R notes that China has already restricted production of both nitrogen and phosphate fertilizers to help conserve energy, and has announced export restrictions. The country is the world’s largest fertilizer exporter, producing half of global urea and nearly 60% of all phosphate-based fertilizer.
“In the near term, these restrictions will put huge upward pressure on fertilizer prices. Over the medium term, less available fertilizer will negatively impact crop yields leading to higher grain prices as well,” the report states.
Bloomberg quotes David MacLennan, CEO of Cargill Inc., stating that food prices will probably stay elevated next year:
“I thought inflation in ags and food was transitory. I feel less so now because of continued shortages in labor markets,” MacLennan said last month in an interview at the Bloomberg New Economy Forum in Singapore.
The news service summarizes:
The data underscore how a perfect storm of snarled supply chains, a rebounding economy, robust consumer demand and labor constraints has driven up prices across the economy. While first concentrated in a handful of categories associated with the economy’s reopening, inflation has since broadened out to other categories.
And then there is Shrinkflation. According to The National Post Shrinkflation is paying the same amount for a product, say a box of cereal, but getting less cereal inside. Manufactures do this to offset increasing input costs w/o increasing prices. A 2014 study published in the Journal of Retailing reported consumers are four times as sensitive to price differences as they are to changes in package size. Though consumers often express frustration when they notice downsized products these negative reactions are typically short-term. When manufacturers surprise people with higher price tags, however, they tend to lose market share: “There’s less of a risk to shrinkflation than to increase prices.”
And going higher
Looking ahead, the evidence of worsening inflation is mounting.
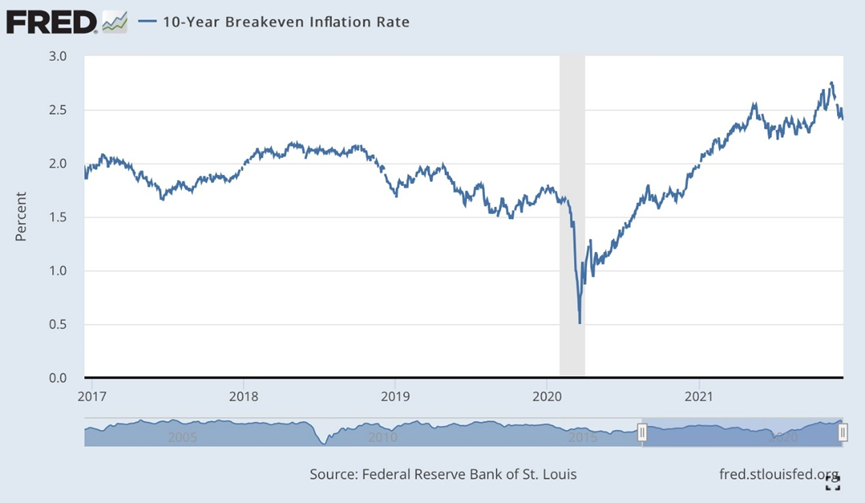
So-called breakeven rates, the amount of yield investors demand to offset expected inflation, rose late in the year to levels at or near record highs going back to the late 1990s, Bloomberg said. The 10-year breakeven rate, referring to what market participants expect inflation to be in the next 10 years, is charted below.
The New York Federal Reserve’s November survey of consumer inflation expectations hit a new all-time high of 6%, up from 5.6% in October, with at least a quarter of survey respondents seeing inflation surging to double digits.
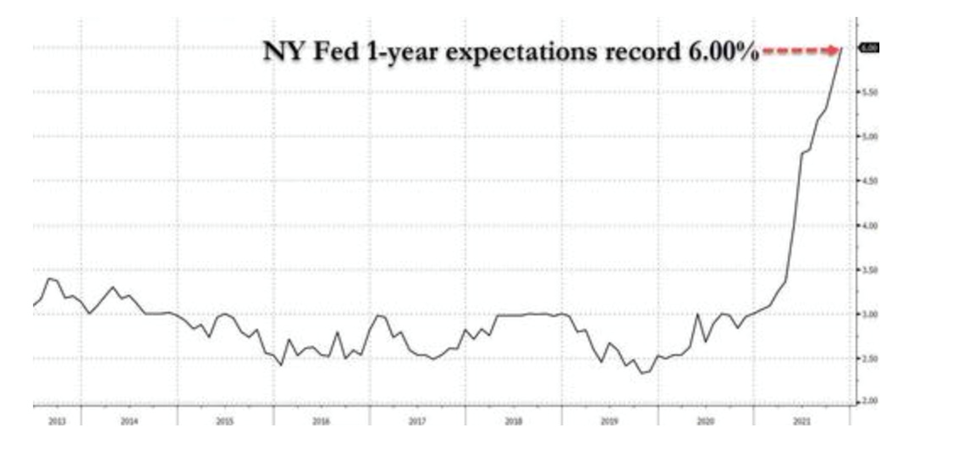 Source: Zero Hedge
Zero Hedge reports consumers now expect most expenditures to rise by around 10% in the coming year, with gasoline prices expected to go up 9.1%; food prices to increase 9.2%; medical costs to climb 9.6%, rent to rise 10%; and the cost of a college education expected to surge 9.1%, the highest since 2015.
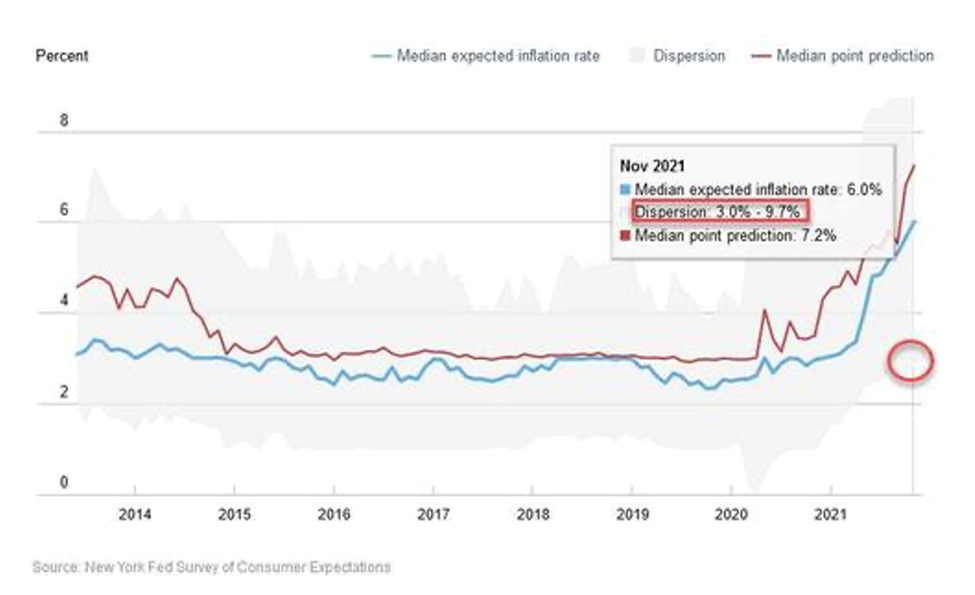 Source: Zero Hedge
Crucially, inflation’s impact on investments is starting to give investors pause on where they park their money. US Treasuries are currently offering the worst real returns since the early 1980s when Paul Volcker’s Fed was fighting a wage-price spiral. And it’s only expected to get worse:
The bond market is projecting that 10-year Treasury yields will hold below the inflation rate for the next decade, meaning any investment income will be more than wiped out by the rising cost of living.
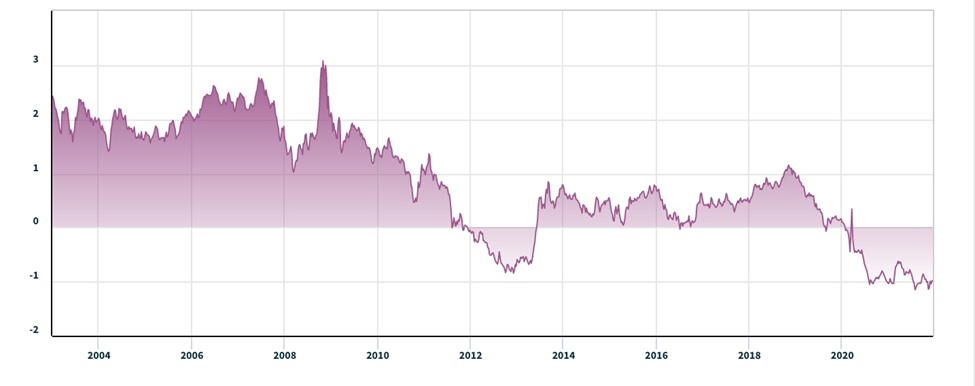 US 10-year Treasury real yield curve. Source: Nasdaq
What about the taper?
As mentioned at the top of the article, the US Federal Reserve is mandated to keep inflation at a “not-too-hot, not-too-cold” 2%, that keeps the economy humming along nicely, allowing for strong economic growth and full employment.
When inflation rises above 2%, like currently, the Fed can stop prices from rising any further by increasing interest rates, the theory being that hiking rates will stifle the incentive for consumers and businesses to borrow cheaply; the economy is cooled by putting a brake on aggregate (total) demand.
In the current situation, the Fed has another tool for fighting inflation, and that is reducing its level of quantitative easing. The idea behind QE, both in 2008-14 and 2020-21, was to heal the recession-plagued economy through the purchase of government bonds. Since late 2020 the Fed has been buying $120 billion of bonds per month but starting in November, it began trimming the monthly purchases by $15 billion, a pace that would bring the program to an end by mid-2022.
There has been much debate in the financial press over the impacts of this so-called Fed “taper”. A faster taper would open the door for the Fed to begin raising interest rates, but tapering too quickly could send bond yields plummeting, and have a negative knock-on effect on the housing market; the Fed wants to avoid a repeat of the 2013 “taper tantrum”.
More generally the Fed is hoping to find a balance between supporting a still-vulnerable economy while containing the inflation caused by the pandemic’s ebb.
The stakes are high, because, as Bloomberg explains,
The gusher of cash the Fed poured into the financial system helped drive U.S. stocks and housing prices to record highs. Investors could interpret a sped-up taper as a sign that the Fed will move rate hikes forward. Tightening policy too quickly could derail the economic recovery at a time of continued uncertainty over the duration of the health crisis. Moving too slowly could fuel inflationary pressures.
Recently Fed Chair Jerome Powell suggested the pace of the taper could be quickened, from a June 2022 completion target to March 2022, in response to rising and stickier-than-expected inflation. He and other Fed officials have stressed that no interest rate hikes will happen before the taper is done. The Federal Open Market Committee is meeting this week to “chart a path of higher interest rates next year,” Reuters reported on Monday, with analysts expecting the Fed to stick to a forecast of three rate hikes in 2023 and 2024.
QE’s minimal effect on prices
Summing up, the Fed has two “bullets” in the chamber of its inflation-fighting gun. The first is the taper, and the second is interest rate hikes. How effective would a taper be on keeping the prices of goods and services from rising? At AOTH we wanted to find out, so we consulted a historical Consumer Price Index chart, reproduced below.
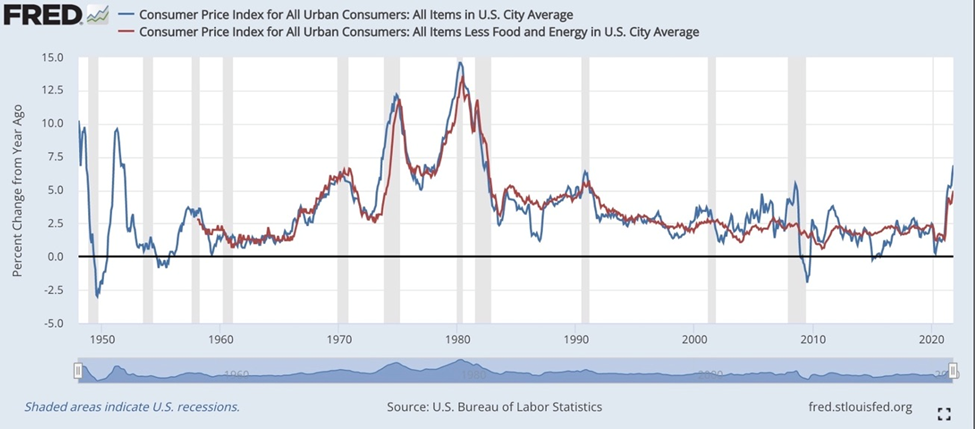
Our analysis starts by looking at the blue line, the Consumer Price Index for All Urban Consumers.
When the United States was in the thick of the Great Recession, shown as a gray bar in the chart, the CPI fell from 5.4% in July 2008 to -1.4% in August 2009. So the initial impact of QE, which began on Nov. 25, 2008, was not to raise inflation, as many expected, but for inflation to fall 6%, into negative territory. (why it fell is beyond the scope of this article, but it likely had to do with a dramatically slowed economy. US GDP growth weakened from 1.8% in 2007 to -0.1% in 2008 to -2.5% in 2009)
As the economy came out of the recession, inflation climbed again, as we would expect it to during a recovery. It hit 3.8% in September 2011 before diving to 1.5% in August 2013 and -0.08% in February 2015. Again, if anyone expected QE to result in significantly rising inflation they’d be wrong. From 2008 to 2014, despite three rounds of QE, the CPI only reached a high of 5.4% and at its lowest point in four years was 0.6%
What about tapering? From all the current taper coverage anticipating an inflation reduction, we would expect inflation to have dropped during the Fed’s last taper, in 2013. In fact the “taper tantrum” had virtually no effect on inflation — it was 3.8% in 2011 and hovered between around 1.2% and 2% in 2013. Even then-Fed Chair Janet Yellen’s decision to raise interest rates in December 2015 had a muted effect on inflation, with the CPI sitting around 0.5% in 2015 and actually rising, not falling, to 2% in December 2016.
What caused inflation to “go negative” in early 2015? Again a thorough analysis is beyond our scope but we suspect it has more to do with energy than anything. Crude oil prices “fell off a cliff” in the fall of 2014, with the Western Texas Intermediate (WTI) benchmark more than cut in half from $105/barrel in June 2014 to $44/bl in March 2015, dragging the CPI down with it. (energy comprises 30% of the CPI)
Back to the above chart, we see inflation bumping along for the next five years, never going beyond 3%, until we get to the coronavirus pandemic in early 2020. Like during the Great Recession, the sudden shock to demand pushed inflation down, from 2.3% in February 2020 to 0.2% during lockdowns in May of last year. From there the CPI has shot up to 6.8% in the space of a year and half.
It is here that we see the difference between “covid-era” QE versus “financial crisis-era” quantitative easing. During both events the Fed splashed out hundreds of billions in bond purchases yet only in 2020-21 do we see a loose monetary policy (low inflation rates, bond purchase) combined with an extremely expansive fiscal policy. The US Treasury in 2008 bailed out the banks, in 2020 it helped average Americans.
The bailouts weren’t inflationary, the stimmy checks were, and are. Remember, $3,200 in direct aid sent to 169 million Americans equates to half a trillion dollars. This is money that is being spent in the economy, and it, combined with supply chain disruptions and labor shortages, is driving inflation higher.
What about interest rate hikes?
We have just proven that QE including bond-buying and money-printing on a massive scale has had very little effect on the Consumer Price Index. Between 2008 and 2014 inflation averaged about 1.6% a year, below the Fed’s 2% target. Inflation is currently sitting on 6.8% but it has nothing to do with monetary policy and everything to do with fiscal policy, i.e., government covid-19 relief spending including direct stimulus payments that are finding their way into the economy and resulting in rising prices. From a pandemic-related low of USD$11,756 billion in July 2020, consumer spending which makes up two-thirds of US GDP, has risen to $13,723B, an increase of 16%. That’s huge.
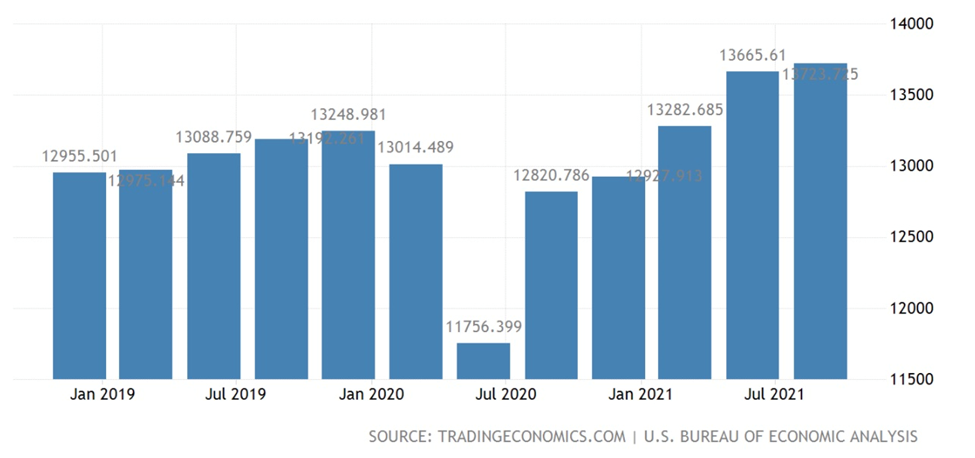 US consumer spending. Source: Trading Economics
If price changes are not caused by quantitative easing and if tapering QE doesn’t do much to tame inflation, the only tool left in the Fed’s toolbox, or to use the gun analogy, the second of only two bullets, is to raise interest rates.
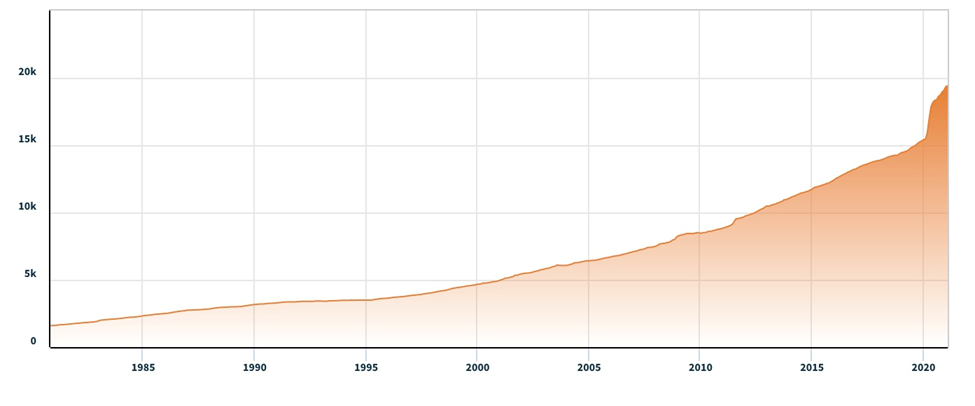
But as we have previously shown, the US Federal Reserve is severely constrained in how much it can raise interest rates, to quell rising inflation, due to ballooning debt. The national debt is now over $29 trillion, and heading higher, much higher. The Fed can telegraph its intentions all it wants, the fact remains that at such unsustainably high debt levels, the interest payments will eventually cripple the federal government.
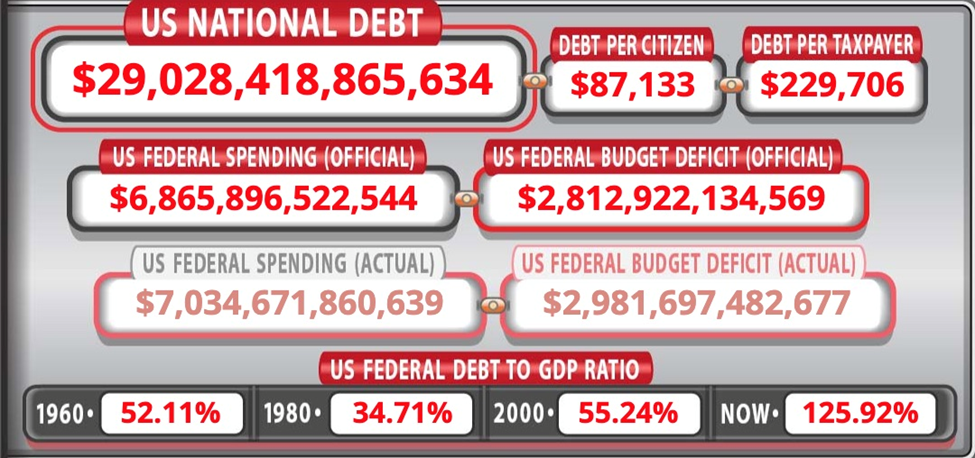 US national debt. Source: usddebtclock.org
The now-$29 trillion national debt doesn’t include what the Biden administration has already spent on pandemic relief ($1.9T). It doesn’t include the infrastructure bill and the social spending/ climate bill, total $2.8T, and it also excludes the $3T deficit on Biden’s proposed $6 trillion budget.
The Congressional Budget Office (CBO) is projecting that with all of this year’s spending, the national debt in 2021 could hit $35 trillion!
By the end of 2022 the national debt, presuming all of the spending commitments use borrowed (or printed) money, will be approaching $44 trillion.
The Fed won’t raise interest rates on $29T worth of debt, yet they tell us they will raise interest rates on $44 trillion of debt?
According to the Committee for a Responsible Federal Budget:
“This year, the federal government will spend $300 billion on interest payments on the national debt. This is the equivalent of nearly 9 percent of all federal revenue collection and over $2,400 per household.”
The federal government spends more on interest than on science, space, and technology, transportation and education combined. The household share of federal interest is larger than average household spending on many typical expenditures, including gas, clothing, education, or personal care.
Despite historically low interest rates, this significant interest cost is the result of high levels of debt. This cost could be even worse if interest rates rise. Each one percent rise in the interest rate would increase FY 2021 interest spending by roughly $225 billion at today’s debt levels.
On a per-household basis, a 1% interest rate hike would increase interest costs by $1,805, to $4,210.
US consumer debt rose to nearly $14.6 trillion at the end of 2020, driven by a record-breaking increase in mortgages, as home buyers took advantage of low mortgage rates. Mortgage debt in Q4 2020 increased 1.4%, or $206 billion, making it the fastest fourth-quarter rise since 2006.
A more recent CNBC story states that household debt jumped the most in 14 years in the second quarter of 2021. Though mostly driven by the housing market, credit card debt is reportedly back on the rise.
According to the Federal Reserve and the Securities Industry and Financial Markets Association (SIFA), US companies now face the highest debt levels on record, at more than $10.5 trillion. In 40 years the amount of corporate bonds outstanding has grown by over 2,000%, from 16% of US GDP in 1980, to 50% of GDP in 2020.
There has been talk of a “corporate bond bubble” triggering the next financial crisis, after the Fed took extraordinary measures at the beginning of the pandemic to buy corporate bonds — part of a $250 billion program funded by the CARES Act.
Questions emerged about why the Fed was purchasing the bonds of companies that really didn’t need their help, including such economic stalwarts as Microsoft, Visa and Home Depot.
Moreover, several of them had “junk bond” as opposed to “investment-grade” status, such as Heinz, Ford and Macy’s. “The corporate bond market is hanging on right now by a very precarious string. How long can we continue to live on red ink?” asks a CNBC video on the subject.
The way we’re going, interest payments on the debt will almost certainly top $1 trillion by the end of the decade if not before.
The people supposedly represented by the government can’t afford that level of interest (they will suffer higher interest payments on their own debt), same as businesses cannot afford higher interest payments on their debt. Corporations will simply pass on the higher interest obligations to their customers, cut dividends or in the worst case scenarios, lay off staff.
Conclusion
Excessive money-printing not only in the United States, but Britain, Japan and the EU, is continuing to devalue currencies at an alarming rate (this, by definition, is inflation, because it takes more units of currency to buy the same amount of goods as before) — for which precious metals, namely gold and silver, are the best defence.
Inflation erodes the purchasing power of fiat currencies and eventually they become worthless.
The dollar has lost 90% of its purchasing power since 1950.
By contrast, since 1972 gold has gone from $35/oz to $1,780.
The Fed can telegraph its intentions all it wants, the fact remains that at such unsustainably high, and going much higher, debt levels, the interest payments will eventually cripple the federal government, corporations and the ultimate bag holder — the consumer.
The US government is addicted to spending and Wall Street is addicted to the Fed’s easy money policies including money-printing to support government borrowing and ultra-low interest rates, both of which appear to have no end.
In this environment of excessive debt accumulation and runaway inflation there is only one way to protect one’s wealth and that is by owning gold and silver or quality junior precious metals stocks.
Richard (Rick) Millsaheadoftheherd.com
About the author

Richard (Rick) Mills

Legal Notice / Disclaimer
Ahead of the Herd newsletter, aheadoftheherd.com, hereafter known as AOTH.
Please read the entire Disclaimer carefully before you use this website or read the newsletter. If you do not agree to all the AOTH/Richard Mills Disclaimer, do not access/read this website/newsletter/article, or any of its pages. By reading/using this AOTH/Richard Mills website/newsletter/article, and whether or not you actually read this Disclaimer, you are deemed to have accepted it.
Any AOTH/Richard Mills document is not, and should not be, construed as an offer to sell or the solicitation of an offer to purchase or subscribe for any investment.