
US Bond Market
For someone who uses the bond markets as important indicators to the macro analysis, I am the furthest thing from an astute bond trader and am certainly not a bond investor. This probably owes to the fact that my earliest (gold bug) training in the markets was with an eye toward the dangers of debt in a fiat driven system.
In other words, how could I take seriously the debt of a government hopelessly in multi-trillions of dollars in debt and adding to it all the time? That is what a bond as an investment is, a call on the debt of, in this case, a supposedly high quality entity (the US government). No thank you.
Though I am not well liked in some corners of the gold promotion err, analysis business, I consider myself today to be a full on gold bug just as I did 20 years ago. Nothing has changed because gold does not change. It has remained a steady literal and figurative rock within the financial system for years, decades and centuries. It’s what confidence in risk assets – including bonds – is measured by.
So I am not a bond investor and I am not going to put much effort into figuring out the best strategies to buy bonds directly. I am not looking to maximize income right now. I am looking to park cash, collect interest on it and wait. Government/Treasury money markets are paying a fine income at this time, unlike so many of the preceding years thanks to Ben Bernanke and his misguided (yup, I said it) financial adventures, which IMO have helped intensify the system’s innate vulnerabilities.
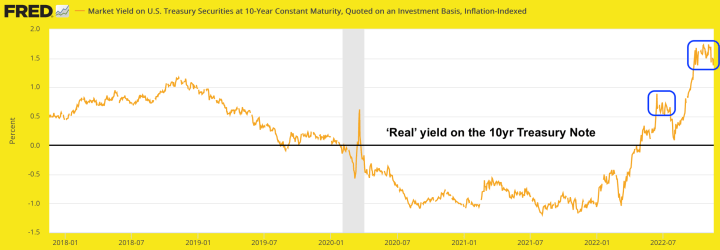
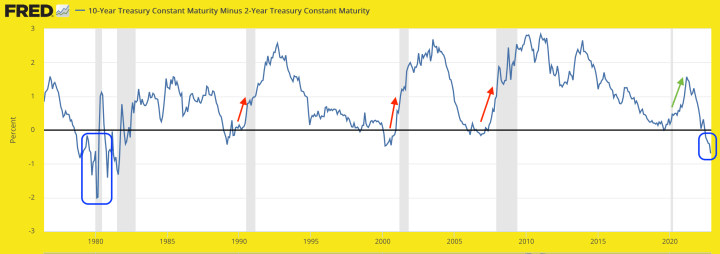
That mini screed aside, let’s take a look at a couple of important bond market signalers (the ‘real’ 10yr yield and the 10-2yr yield spread) and then discuss them in the Precious Metals segment, which obviously is front and center with respect to the implications of these indicators.
Precious Metals
Each of the graphs above show very bearish signaling for gold. Okay, we’ve got the memo; the Fed is in complete control as it mops up the inflationary mess it was primary in spilling upon the world’s markets. These graphs reflect that. Gold is not for times when things appear well and normal with respect for the Fed intact, whether under an inflationary or disinflationary regime (which can included a pleasant ‘Goldilocks’ style economy).
Gold is for when things get off the hook and are perceived by a critical mass of the population as destructive (public mans the pitchforks and torches and sets about the Fed). In my opinion, we are on our way there pending the potential for a Q1-Q4 seasonal party to resume [this article was written on 11.20.22, and as of 11.22 the party began an attempt to resume].
As to the charts above, the ‘real’ yield is making the same kind of topping structure it made earlier in the year before dropping, holding above zero and impulsively rising again. We have been noting how bearish this is for gold but also of late how such an extreme is positive for gold’s forward risk/reward relative to other assets.
The yield curve is another extreme, taking out all inversion lows since the early 1980s. I’ve marked up the graph to make the point that the last 3 inversions preceded economic recessions (shaded areas). As we’ve frequently noted, it’s not the inversion that brings the recession but the turn toward steepening. Those steepeners were deflationary.
The most recent steepener (2020 into 2021) was inflationary and I doubt the next one will be. Whenever it stops flattening and turns up a strong caution signal on the economy will be at hand.
The other steepening case on the graph is from the late 1970s into the 1980s. Hat tip to a subscriber for making me aware of this St. Louis Fed graph going back that far. What a volatile mess that inversion was. Noise aside, it resolved into two recessions and then a disinflationary bull phase for the economy and markets. It was something of an extended Goldilocks economy as gold was sent back into the desert for 20 years after its bull market blow out in 1980.
Interesting stuff, eh? I think we are in a different world than 1979-1983. Inflation was strong in the 70s and gold was an emblem of inflation protection. But as we have shown repeatedly in the decades since, that is not its primary utility, at least not in the modern era. Gold is going to be there when this mess falls apart. That’s my dogma, as it has been for 20 years.
On to the checklist of items to watch as the macro grinds out a turn, which I anticipate to favor gold in 2023.
NFTRH 732 then went on to do its thing with respect to our weekly management of the precious metals and the process of pivoting toward a fundamentally positive macro backdrop for the sector going forward and charting the metals, HUI and individual gold and silver stocks.
For “best of breed” top down analysis of all major markets, subscribe to NFTRH Premium, which includes an in-depth weekly market report, detailed market updates and NFTRH+ dynamic updates and chart/trade setup ideas. Subscribe by Credit Card or PayPal using a link on the right sidebar (if using a mobile device you may need to scroll down) or see all options and more info. Keep up to date with actionable public content at NFTRH.com by using the email form on the right sidebar. Follow via Twitter@NFTRHgt.
About the author
